Downloaded 586 times
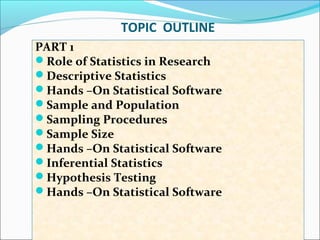
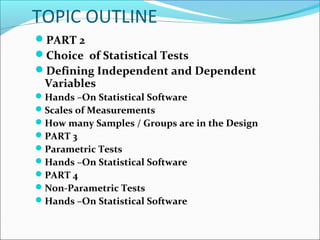
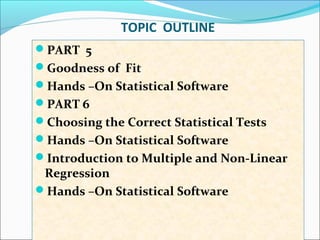
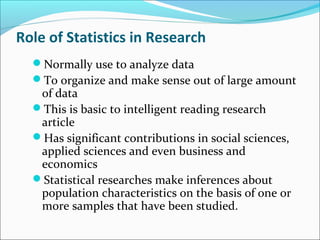
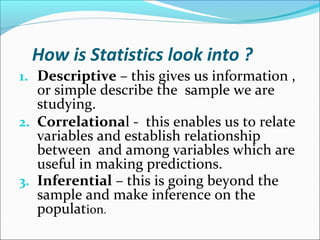


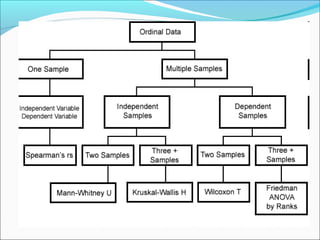
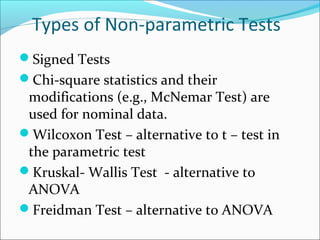
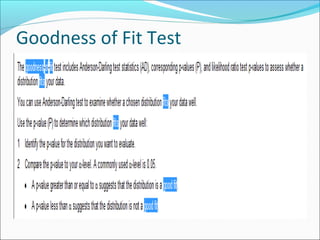
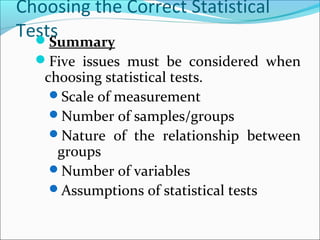


This document outlines topics related to statistics that will be covered. It is divided into 6 parts. Part 1 discusses the role of statistics in research, descriptive statistics, sampling procedures, sample size, and inferential statistics. Part 2 covers choice of statistical tests, defining variables, scales of measurements, and number of samples. Parts 3 and 4 discuss parametric and non-parametric tests. Part 5 is about goodness of fit tests. Part 6 covers choosing correct statistical tests and introduction to multiple regression. The document also provides examples and definitions of key statistical concepts like mean, median, mode, range, and different sampling methods.