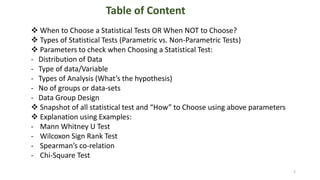
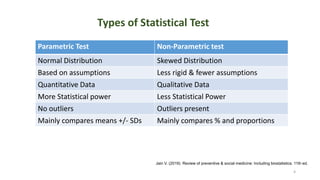
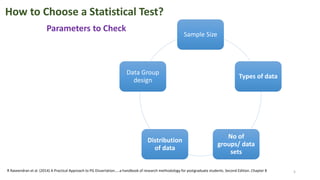
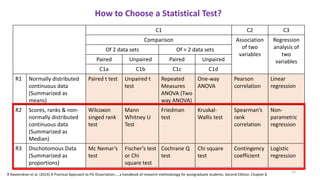
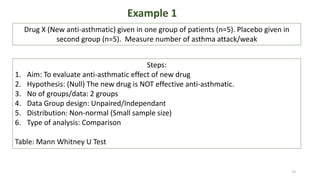
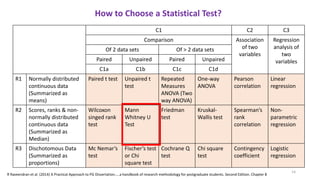
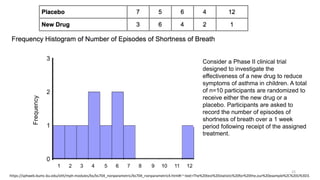
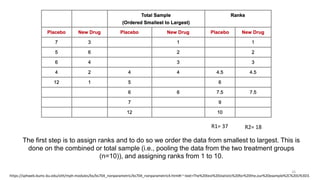
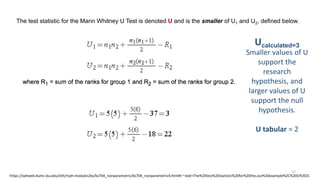
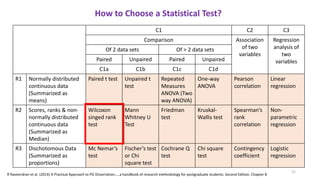
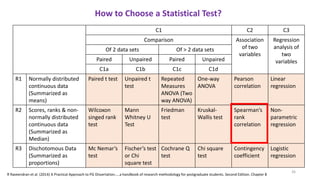
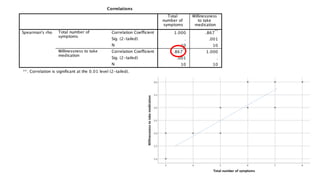
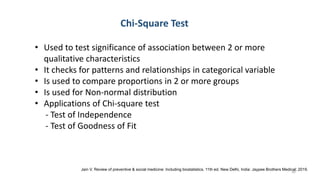
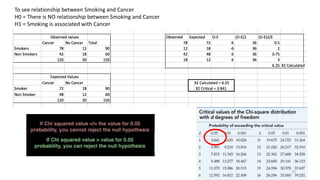
v When to Choose a Statistical Tests OR When NOT to Choose? v Parametric vs. Non-Parametric Tests (Comparison)
v Parameters to check when Choosing a Statistical Test:
- Distribution of Data
- Type of data/Variable
- Types of Analysis (What’s the hypothesis)
- No of groups or data-sets
- Data Group Design
v Snapshot of all statistical test and “How” to Choose using above parameters v Explanation using Examples:
- Mann Whitney U Test
- Wilcoxon Sign Rank Test
- Spearman’s co-relation
- Chi-Square Test
v Conclusion
2. 2
Table of Content
When to Choose a Statistical Tests OR When NOT to Choose?
Types of Statistical Tests (Parametric vs. Non-Parametric Tests)
Parameters to check when Choosing a Statistical Test:
- Distribution of Data
- Type of data/Variable
- Types of Analysis (What’s the hypothesis)
- No of groups or data-sets
- Data Group Design
Snapshot of all statistical test and “How” to Choose using above parameters
Explanation using Examples:
- Mann Whitney U Test
- Wilcoxon Sign Rank Test
- Spearman’s co-relation
- Chi-Square Test
3. 3
When to Choose a Statistical Tests?
Or
When NOT to Choose a Statistical Tests?
4. Parametric Test Non-Parametric test
Normal Distribution Skewed Distribution
Based on assumptions Less rigid & fewer assumptions
Quantitative Data Qualitative Data
More Statistical power Less Statistical Power
No outliers Outliers present
Mainly compares means +/- SDs Mainly compares % and proportions
Jain V. (2019) Review of preventive & social medicine: Including biostatistics. 11th ed.
4
Types of Statistical Test
5. 5
Sample Size
Types of data
No of
groups/ data
sets
Distribution
of data
Data Group
design
How to Choose a Statistical Test?
Parameters to Check
R Raveendran et al. (2014) A Practical Approach to PG Dissertation…..a handbook of research methodology for postgraduate students. Second Edition. Chapter 8
6. Normal
Non-Normal
Dichotomous
Distribution of Data
All bodily parameters follow Normal Distribution
exception; Ab titers
Measure of ranks/scores viz. Apgar, Scoring of liver
fibrosis, Pain in visual analogue scale follow Non-
normal Distribution
Variables measured as counts e.g. no of people
having headache etc. are binomial measurements.
These for Non-normal distribution
If Mean < 2 times SD then the distribution is Non-
Normal Distribution
Mean=Median=Mode Normal Distribution
6
7. Left sided Skewing
Mean < Median < Mode
Right sided Skewing
Mean > Median > Mode
Non-Normal Distribution Normal Distribution
No Skewing
Mean = Median = Mode
Dakhale GN, Hiware SK, Shinde AT, Mahatme MS. Basic biostatistics for post-graduate students. Indian journal of pharmacology. 2012 Jul;44(4):435.
7
9. Types of Analysis
(What we want to do?)
(What’s the Hypothesis)
Comparison
Between Mean,
Median &
Proportions of one
or > one group
Co-relation Analysis
Find relationship
between two
variable
Regression Analysis:
Predicting one
variable with
another
R Raveendran et al. (2014) A Practical Approach to PG Dissertation…..a handbook of research methodology for postgraduate students. Second Edition. Chapter 8 9
10. No of Groups
& Data sets
One group (Two or > Two Data sets)
Two groups (Two data sets)
> Two groups/ > 2 data sets
10
R Raveendran et al. (2014) A Practical Approach to PG Dissertation…..a handbook of research methodology for postgraduate students. Second Edition. Chapter 8
11. UNPAIRED /
INDEPENDANT
PAIRED /
MATCHED
•2 GROUPS OR > 2
GROUPS OF TOTALLY
DIFFERENT SET OF
SUBJECTS
INDEPENDENT OF
EACH OTHER
• ONE GROUP
BEFORE OR AFTER
INTERVENTION
Data Group Design
11
R Raveendran et al. (2014) A Practical Approach to PG Dissertation…..a handbook of research methodology for postgraduate students. Second Edition. Chapter 8
12. C1 C2 C3
Comparison Association
of two
variables
Regression
analysis of
two
variables
Of 2 data sets Of > 2 data sets
Paired Unpaired Paired Unpaired
C1a C1b C1c C1d
R1 Normally distributed
continuous data
(Summarized as
means)
Paired t test Unpaired t
test
Repeated
Measures
ANOVA (Two
way ANOVA)
One-way
ANOVA
Pearson
correlation
Linear
regression
R2 Scores, ranks & non-
normally distributed
continuous data
(Summarized as
Median)
Wilcoxon
singed rank
test
Mann
Whitney U
Test
Friedman
test
Kruskal-
Wallis test
Spearman’s
rank
correlation
Non-
parametric
regression
R3 Dischotomous Data
(Summarized as
proportions)
Mc Nemar’s
test
Fischer’s test
or Chi
square test
Cochrane Q
test
Chi square
test
Contingency
coefficient
Logistic
regression
How to Choose a Statistical Test?
12
R Raveendran et al. (2014) A Practical Approach to PG Dissertation…..a handbook of research methodology for postgraduate students. Second Edition. Chapter 8
13. Example 1
Drug X (New anti-asthmatic) given in one group of patients (n=5). Placebo given in
second group (n=5). Measure number of asthma attack/weak
Steps:
1. Aim: To evaluate anti-asthmatic effect of new drug
2. Hypothesis: (Null) The new drug is NOT effective anti-asthmatic.
3. No of groups/data: 2 groups
4. Data Group design: Unpaired/Independant
5. Distribution: Non-normal (Small sample size)
6. Type of analysis: Comparison
Table: Mann Whitney U Test
13
14. C1 C2 C3
Comparison Association
of two
variables
Regression
analysis of
two
variables
Of 2 data sets Of > 2 data sets
Paired Unpaired Paired Unpaired
C1a C1b C1c C1d
R1 Normally distributed
continuous data
(Summarized as
means)
Paired t test Unpaired t
test
Repeated
Measures
ANOVA (Two
way ANOVA)
One-way
ANOVA
Pearson
correlation
Linear
regression
R2 Scores, ranks & non-
normally distributed
continuous data
(Summarized as
Median)
Wilcoxon
singed rank
test
Mann
Whitney U
Test
Friedman
test
Kruskal-
Wallis test
Spearman’s
rank
correlation
Non-
parametric
regression
R3 Dischotomous Data
(Summarized as
proportions)
Mc Nemar’s
test
Fischer’s test
or Chi
square test
Cochrane Q
test
Chi square
test
Contingency
coefficient
Logistic
regression
How to Choose a Statistical Test?
14
R Raveendran et al. (2014) A Practical Approach to PG Dissertation…..a handbook of research methodology for postgraduate students. Second Edition. Chapter 8
15. Consider a Phase II clinical trial
designed to investigate the
effectiveness of a new drug to reduce
symptoms of asthma in children. A total
of n=10 participants are randomized to
receive either the new drug or a
placebo. Participants are asked to
record the number of episodes of
shortness of breath over a 1 week
period following receipt of the assigned
treatment.
https://sphweb.bumc.bu.edu/otlt/mph-modules/bs/bs704_nonparametric/bs704_nonparametric4.html#:~:text=The%20test%20statistic%20for%20the,our%20example%2C%20U%3D3.
15
17. The test statistic for the Mann Whitney U Test is denoted U and is the smaller of U1 and U2, defined below.
Ucalculated=3
Smaller values of U
support the
research
hypothesis, and
larger values of U
support the null
hypothesis.
U tabular = 2
https://sphweb.bumc.bu.edu/otlt/mph-modules/bs/bs704_nonparametric/bs704_nonparametric4.html#:~:text=The%20test%20statistic%20for%20the,our%20example%2C%20U%3D3.
17
18. Decision rule is to
reject H0 if Ucalc < U tab
Ucalc = 3 > Utab =2
H0 is NOT rejected
The difference between
the two arms is not
statistically different
https://sphweb.bumc.bu.edu/otlt/mph-modules/bs/bs704_nonparametric/bs704_nonparametric4.html#:~:text=The%20test%20statistic%20for%20the,our%20example%2C%20U%3D3.
18
20. Example 2
Drug X given in one group of autistic children (n=8). The number of repetitive behavior
was observed over period of three hours before and after the administration of the
new drug for a period of one weak
Steps:
1. Aim: To evaluate anti-autistic effect of new drug
2. Hypothesis: (Null) The new drug is NOT effective in treating autism
3. No of groups/data: one group but two data sets
4. Group Data design: Paired
5. Distribution: Non-normal (Small sample size)
6. Type of analysis: Comparison
Table: Wilcoxon singed rank test
20
21. C1 C2 C3
Comparison Association
of two
variables
Regression
analysis of
two
variables
Of 2 data sets Of > 2 data sets
Paired Unpaired Paired Unpaired
C1a C1b C1c C1d
R1 Normally distributed
continuous data
(Summarized as
means)
Paired t test Unpaired t
test
Repeated
Measures
ANOVA (Two
way ANOVA)
One-way
ANOVA
Pearson
correlation
Linear
regression
R2 Scores, ranks & non-
normally distributed
continuous data
(Summarized as
Median)
Wilcoxon
singed rank
test
Mann
Whitney U
Test
Friedman
test
Kruskal-
Wallis test
Spearman’s
rank
correlation
Non-
parametric
regression
R3 Dischotomous Data
(Summarized as
proportions)
Mc Nemar’s
test
Fischer’s test
or Chi
square test
Cochrane Q
test
Chi square
test
Contingency
coefficient
Logistic
regression
How to Choose a Statistical Test?
21
R Raveendran et al. (2014) A Practical Approach to PG Dissertation…..a handbook of research methodology for postgraduate students. Second Edition. Chapter 8
22. W+ (sum of the positive ranks) =32
W- (sum of the negative ranks) =4
The test statistic is W (cal) = 4.
https://sphweb.bumc.bu.edu/otlt/mph-modules/bs/bs704_nonparametric/BS704_Nonparametric6.html
22
23. If W (calculated) =/< W (tabulated), then reject H0
If W (calculated) > W (tabulated), then DO NOT reject H0
W (calculated) = 4
W (tabulated) = 6
Thus, null hypothesis is rejected …..
https://sphweb.bumc.bu.edu/otlt/mph-modules/bs/bs704_nonparametric/BS704_Nonparametric6.html
23
25. Example 3
Does the number of symptoms in a patient predict their willingness to take
medication?
Steps:
1. Aim: To evaluate co-relation between number of symptoms the patients have to
their willingness to take medicine
2. Hypothesis: (Null) There is NO correlation between the two variable
3. No of groups/data: one groups
4. Group Data design: NA
5. Distribution: Non-normal (ordinal data)
6. Type of analysis: Correlation
Table: Spearman rank correlation analysis
25
26. C1 C2 C3
Comparison Association
of two
variables
Regression
analysis of
two
variables
Of 2 data sets Of > 2 data sets
Paired Unpaired Paired Unpaired
C1a C1b C1c C1d
R1 Normally distributed
continuous data
(Summarized as
means)
Paired t test Unpaired t
test
Repeated
Measures
ANOVA (Two
way ANOVA)
One-way
ANOVA
Pearson
correlation
Linear
regression
R2 Scores, ranks & non-
normally distributed
continuous data
(Summarized as
Median)
Wilcoxon
singed rank
test
Mann
Whitney U
Test
Friedman
test
Kruskal-
Wallis test
Spearman’s
rank
correlation
Non-
parametric
regression
R3 Dischotomous Data
(Summarized as
proportions)
Mc Nemar’s
test
Fischer’s test
or Chi
square test
Cochrane Q
test
Chi square
test
Contingency
coefficient
Logistic
regression
How to Choose a Statistical Test?
26
R Raveendran et al. (2014) A Practical Approach to PG Dissertation…..a handbook of research methodology for postgraduate students. Second Edition. Chapter 8
29. Chi-Square Test
• Used to test significance of association between 2 or more
qualitative characteristics
• It checks for patterns and relationships in categorical variable
• Is used to compare proportions in 2 or more groups
• Is used for Non-normal distribution
• Applications of Chi-square test
- Test of Independence
- Test of Goodness of Fit
Jain V. Review of preventive & social medicine: Including biostatistics. 11th ed. New Delhi, India: Jaypee Brothers Medical; 2019.
30
33. 34
Some Perks in Statistical Concepts:
• Uniform Distribution
• Degree of Freedom
• Kurtosis
• Normality testing
34. 35
Methods to Check for Normality of Data
Visual Methods:
Histogram,
Box-plots,
Q-Q plots
Normality Tests
Kolmogorov-Smirnov (K-S) test
Lilliefors corrected K-S test
Shapiro-Wilk test
Anderson-Darling test
Cramer-von Mises test
Kurtosis
Skweness
Ghasemi et al. Normality Tests for Statistical Analysis: A Guide for Non-Statisticians. Int J Endocrinol Metab. 2012;10(2):486-489.
More statistical power means more likely to detect a difference when truly exists…
Uniform Distribution….
Co-relation analysis: E.g. We measure BP & body weight in one group. We measure whether BP increases with increase in weight and vice-a-versa
Regression Analysis: If a patient comes to my OPD weighing 50 Kg, what would be his BP. Predicting variables is called regression analysis.
We call the placebo group 1 and the new drug group 2 (assignment of groups 1 and 2 is arbitrary). We let R1 denote the sum of the ranks in group 1 (i.e., R1=37), and R2 denote the sum of the ranks in group 2 (i.e., R2=18). If the null hypothesis is true (i.e., if the two populations are equal), we expect R1 and R2 to be similar. In this example, the lower values (lower ranks) are clustered in the new drug group (group 2), while the higher values (higher ranks) are clustered in the placebo group (group 1). This is suggestive, but is the observed difference in the sums of the ranks simply due to chance? To answer this we will compute a test statistic to summarize the sample information and look up the corresponding value in a probability distribution.
In every test, we must determine whether the observed U supports the null or research hypothesis. This is done following the same approach used in parametric testing. Specifically, we determine a critical value of U such that if the observed value of U is less than or equal to the critical value, we reject H0 in favor of H1 and if the observed value of U exceeds the critical value we do not reject H0.
The critical value of U can be found in the table below. To determine the appropriate critical value we need sample sizes (for Example: n1=n2=5) and our two-sided level of significance (α=0.05). For Example 1 the critical value is 2, and the decision rule is to reject H0 if U < 2. We do not reject H0 because 3 > 2. We do not have statistically significant evidence at α =0.05, to show that the two populations of numbers of episodes of shortness of breath are not equal. However, in this example, the failure to reach statistical significance may be due to low power. The sample data suggest a difference, but the sample sizes are too small to conclude that there is a statistically significant difference.
The test statistic for the Wilcoxon Signed Rank Test is W, defined as the smaller of W+ (sum of the positive ranks) and W- (sum of the negative ranks). If the null hypothesis is true, we expect to see similar numbers of lower and higher ranks that are both positive and negative (i.e., W+ and W- would be similar). If the research hypothesis is true we expect to see more higher and positive ranks (in this example, more children with substantial improvement in repetitive behavior after treatment as compared to before, i.e., W+ much larger than W-).
In this example, W+ = 32 and W- = 4. Recall that the sum of the ranks (ignoring the signs) will always equal n(n+1)/2. As a check on our assignment of ranks, we have n(n+1)/2 = 8(9)/2 = 36 which is equal to 32+4. The test statistic is W = 4.
Next we must determine whether the observed test statistic W supports the null or research hypothesis. This is done following the same approach used in parametric testing. Specifically, we determine a critical value of W such that if the observed value of W is less than or equal to the critical value, we reject H0 in favor of H1, and if the observed value of W exceeds the critical value, we do not reject H0.
Compared to the Pearson correlation coefficient, the Spearman correlation does not require continuous-level data (interval or ratio), because it uses ranks instead of assumptions about the distributions of the two variables. This allows us to analyze the association between variables of ordinal measurement levels. Moreover, the Spearman correlation does not assume that the variables are normally distributed. A Spearman correlation analysis can therefore be used in many cases in which the assumptions of the Pearson correlation (continuous-level variables, linearity, heteroscedasticity, and normality) are not met.
Whereas correlation explains the strength of the relationship between an independent and dependent variable, R-squared explains to what extent the variance of one variable explains the variance of the second variable.
Expected values= row total multiplied by column total divided by All total