TESTS OF SIGNIFICANCE
Dr. ANUSHA DIVVI
2ND YEAR POST GRADUATE
DEPARTMENT OF PUBLIC HEALTH DENTISTRY
CONTENTS
• Introduction
• Data and Types
• Measures of central tendency
• Measures of dispersion
• Hypothesis and types
• Errors
• Power, Level of significance, effect size
• Parametric tests
• Non Parametric tests
• Flowchart for deciding appropriate statistical test
• Conclusion
• References
INTRODUCTION
Statistics is a mathematical science which deals with the methods of
collecting, compiling, presenting, interpreting the numerical data and
making inferences/drawing conclusions based on the analysis of data
Gordon B. Drummond Statistics: all together now, one step at a time; Adv Physiol Educ 2011:35;129
• Biostatistics – Branch of statistics
• John Graunt (1620 – 1674) is the father of biostatistics
• Biostatistics can be divided into two subcategories:
• Descriptive biostatistics
• Inferential biostatistics
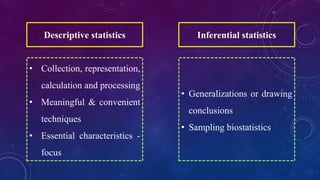
Descriptive statistics
• Collection, representation,
calculation and processing
• Meaningful & convenient
techniques
• Essential characteristics -
focus
Inferential statistics
• Generalizations or drawing
conclusions
• Sampling biostatistics
DATA
• Data is a collection of facts, such as numbers, words,
measurements, observations or even just descriptions of things.
• The singular form is "datum"
TYPES OF DATA
1. Qualitative / Categorical data
• Nominal
• Ordinal
2. Quantitative / Measurement data
• Discrete
• Continuous
CATEGORICAL DATA
• Variable being measured is grouped into categories
• Resulting data are merely labels or categories
Classified as:
• Nominal(Nominal / Binary or Dichotomous)
• Ordinal
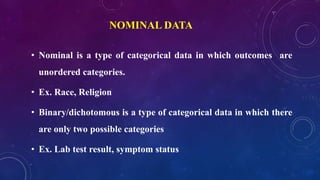
NOMINAL DATA
• Nominal is a type of categorical data in which outcomes are
unordered categories.
• Ex. Race, Religion
• Binary/dichotomous is a type of categorical data in which there
are only two possible categories
• Ex. Lab test result, symptom status
ORDINAL DATA
• A type of categorical data in which natural order is important
• Interval between categories is not meaningful
• Ex. Pain: Mild, moderate, severe
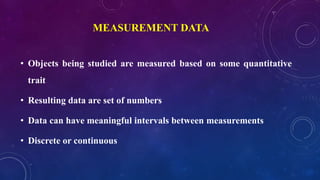
MEASUREMENT DATA
• Objects being studied are measured based on some quantitative
trait
• Resulting data are set of numbers
• Data can have meaningful intervals between measurements
• Discrete or continuous
DISCRETE DATA
• Discrete data – only certain values are possible
• There are gaps between the possible values
• Ex. No. of missing teeth, No of lesions in mouth
CONTINUOUS DATA
• Continuous measurement data means any value within an
interval is possible
• Ex. Mouth opening, Distances between teeth
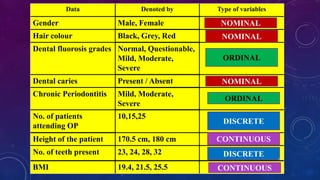
Data Denoted by Type of variables
Gender Male, Female
Hair colour Black, Grey, Red
Dental fluorosis grades Normal, Questionable,
Mild, Moderate,
Severe
Dental caries Present / Absent
Chronic Periodontitis Mild, Moderate,
Severe
No. of patients
attending OP
10,15,25
Height of the patient 170.5 cm, 180 cm
No. of teeth present 23, 24, 28, 32
BMI 19.4, 21.5, 25.5
ORDINAL
NOMINAL
NOMINAL
NOMINAL
ORDINAL
DISCRETE
DISCRETE
CONTINUOUS
CONTINUOUS
15
MEASURES OF CENTRAL TENDENCY
• Tendency of the observations towards the central point of data
• A single number
• Measures of central location
• Summary Statistics
• Representative of the entire data
• Mean, median, mode
• Mean – Average of the values of all the variables
Types
1. Arithmetic mean
2. Geometric mean – when values change exponentially
3. Harmonic mean – reciprocal of arithmetic mean
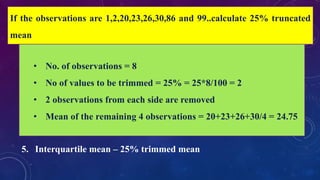
4. Truncated mean – trimmed mean
5. Interquartile mean – 25% trimmed mean
If the observations are 1,2,20,23,26,30,86 and 99..calculate 25% truncated
mean
• No. of observations = 8
• No of values to be trimmed = 25% = 25*8/100 = 2
• 2 observations from each side are removed
• Mean of the remaining 4 observations = 20+23+26+30/4 = 24.75
• Median: The middle value when all the variables are arranged in an
order ( either ascending or descending)
• Mode : The most repeated value
• Mode = 3 median – 2 mean
• The mean has one main disadvantage: it is particularly
susceptible to the influence of outliers.
• These are values that are unusual compared to the rest of the
data set by being especially small or large in numerical value.
• For example, consider the wages of staff at a factory below:
Staff 1 2 3 4 5 6 7 8 9 10
Salary 15k 18k 16k 14k 15k 15k 12k 17k 90k 95k
• Mean salary for these ten staff is 30.7k
• Mean is being skewed by the two large salaries
• Therefore, in this situation consider median
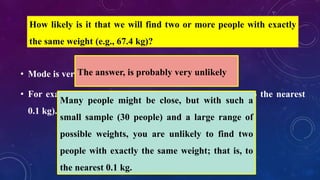
• Mode is very rarely used with continuous data
• For example, consider measuring 30 peoples' weight (to the nearest
0.1 kg).
How likely is it that we will find two or more people with exactly
the same weight (e.g., 67.4 kg)?
The answer, is probably very unlikely
Many people might be close, but with such a
small sample (30 people) and a large range of
possible weights, you are unlikely to find two
people with exactly the same weight; that is, to
the nearest 0.1 kg.
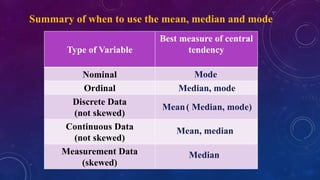
Summary of when to use the mean, median and mode
Type of Variable
Best measure of central
tendency
Nominal
Ordinal
Discrete Data
(not skewed)
Continuous Data
(not skewed)
Measurement Data
(skewed)
Mean( Median, mode)
Mean, median
Median
Mode
Median, mode
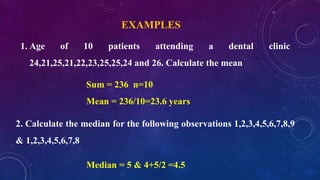
EXAMPLES
1. Age of 10 patients attending a dental clinic
24,21,25,21,22,23,25,25,24 and 26. Calculate the mean
Sum = 236 n=10
Mean = 236/10=23.6 years
Median = 5 & 4+5/2 =4.5
2. Calculate the median for the following observations 1,2,3,4,5,6,7,8,9
& 1,2,3,4,5,6,7,8
3. What is the mode for the following observations
A+, O+, B+, A+, A+, A-, A+,A+
Mode = A+
MEASURES OF DISPERSION
• Degree of spread or variation of the variable about a central value
Range: It is the difference between the highest and lowest
observations.
Ex. Diastolic BP of 5 individuals is 90,80,78,84,98.
Highest observation is 98
Lowest observation is 78
Range is 98-78= 20.
Mean deviation
• Average of the deviations from the arithmetic mean
• M.D. = ∑ X-Xi /n
• X – arithmetic mean
• Xi – value of each observation in the data
• N= number of observations
• Calculate the mean deviation of the data 3, 6, 6, 7, 8, 11, 15, 16
• Mean = 72/8 = 9
• Value Distance from 9
3 6
6 3
6 3
7 2
8 1
11 2
15 6
16 7
• Mean deviation = 30/8 = 3.75
Quartile deviation
• It is based on the lower quartile Q1 and upper quartile Q3.
• Q1 = 25*n/100 Q3 = 75*n/100
• The difference Q3 - Q1 is called the inter quartile range.
• The difference Q3 - Q1 divided by 2 is called semi-inter-quartile
range or the quartile deviation.
• Q.D = Q3 - Q1 /2
Suppose the values of X are 20, 12,
18, 25, 32, 10, 35
Calculate inter quartile range and
quartile deviation of the data
• Arrange the given data in ascending or descending order
• X = 10, 12, 18, 20, 25, 32,35
• No. of items = 7
• Q1 = 25*7/100 = 1.75 (rounded to 2nd)
= 12
• Q3 = 75*6/100 = 5.25th item (rounded to 5th)
= 25
• Inter-quartile range = Q3 – Q1 = 25-12= 13
• Quartile deviation = 13/2 = 6.5
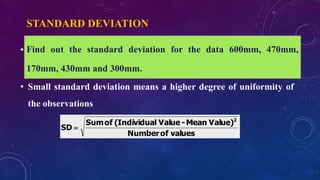
STANDARD DEVIATION
• Square root of the mean of the squared deviations from the
arithmetic mean
• Small standard deviation means a higher degree of uniformity of
the observations
valuesofNumber
Value)Mean-Valuel(IndividuaofSum
SD
2

Find out the standard deviation for the data 600mm, 470mm,
170mm, 430mm and 300mm.
• Mean = 1970/5 = 394
• Calculate variance - take each difference, square it, and then
average the result:
• Standard Deviation
• σ= √21,704
= 147.32...
= 147 (to the nearest mm)
HYPOTHESIS
• A hypothesis can be defined as a tentative prediction or explanation
of the relationship between two or more variables.
• A supposition arrived at from observation or reflection
• A hypothesis helps to translate the research problem & objectives
into a clear explanation or prediction of the expected results or
outcomes of the research study
A clearly stated hypothesis includes:
• Variables to be manipulated or measured
• Identifies the population to be examined
• Indicates the proposed outcome for the study
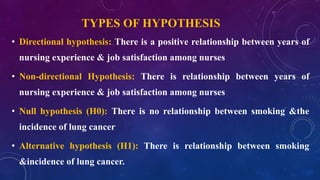
TYPES OF HYPOTHESIS
• Directional hypothesis: There is a positive relationship between years of
nursing experience & job satisfaction among nurses
• Non-directional Hypothesis: There is relationship between years of
nursing experience & job satisfaction among nurses
• Null hypothesis (H0): There is no relationship between smoking &the
incidence of lung cancer
• Alternative hypothesis (H1): There is relationship between smoking
&incidence of lung cancer.
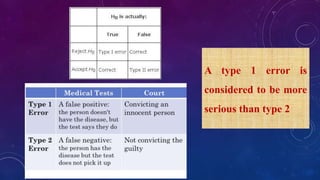
ERRORS
• Mistakes regarding the relationship between the two variables
• In 1928, Jerzy Neyman and Egon Pears – 2 errors
• Type I error: Rejection of true null hypothesis
• Accept the null hypothesis and reject the alternate hypothesis, but the
opposite occurs.
• Probability - alpha
• Type II error : Accepting false null hypothesis
• Reject the null hypothesis and accept the alternate hypothesis,
but the opposite occurs
• Probability - beta
A type 1 error is
considered to be more
serious than type 2
In this example, which type of error would you prefer to commit?
• Null Hypothesis: The new mouthwash is no better at treating
chronic periodontitis than the old mouthwash
• Research Hypothesis: The new mouthwash is better at treating
chronic periodontitis than the old mouthwash
• If a Type I error is committed, the null hypothesis should be
accepted, but it is rejected
• People may be treated with the new mouthwash, when they would
have been better off with the old one
• If a Type II error is committed, the null hypothesis should be
rejected, but it is accepted
• People may not be treated with the new mouthwash, although they
would be better off than with the old one
LEVEL OF SIGNIFICANCE
• Researchers generally specify the probability of committing a Type I
error that they are willing to accept, i.e., the value of alpha.
• Most researchers select an alpha=0.05
• This means that they are willing to accept a probability of 5% of
making a Type I error
POWER
• The probability that the researcher will make a correct decision to reject
the null hypothesis when it is really false
• More power = less risk for a type 2 error
• Usually set at 0.8 or greater before a study begins
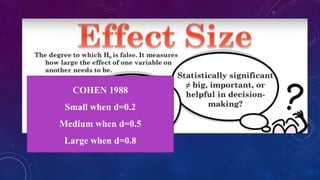
COHEN 1988
Small when d=0.2
Medium when d=0.5
Large when d=0.8
‘p’ value
• Probability of occurrence of the differences in values due to chance
or otherwise
• Evidence against null hypothesis
• Smaller p value – more evidence
• <0.05
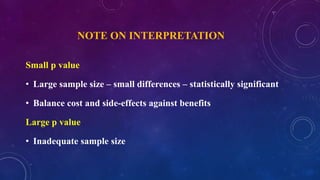
NOTE ON INTERPRETATION
Small p value
• Large sample size – small differences – statistically significant
• Balance cost and side-effects against benefits
Large p value
• Inadequate sample size
• P value indicates only the role of chance but not the precision of
the observed effect size
• To overcome this a more informative measure - Confidence
interval is reported
Confidence level
• Confidence level = 1-alpha
• So if your level of significance is 0.05, the corresponding confidence
level is 95%
• Probability of any difference falling outside 95% is only 0.05
• 95% confident that true mean of population will fall within the
given range of values
• Confidence level may also be fixed at 90%, 99%, 99.9%
CONFIDENCE LIMITS
• Lowe and upper boundaries which define the range of
confidence interval
• The limits of 95% confidence interval will be x +/- 1.96 SE
• For example if the sample mean is 180 mg/dl and the standard
error is 15mg, then the confidence limits are 150.6 and 209.4
mgs/dl
CONFIDENCE INTERVAL
• Range between lower and upper boundaries of confidence
limits
• An interval calculated at a 95% level means we are 95%
confident that the interval contains true population mean
• We can also say that 95% of all the confidence intervals formed
in this manner will include the true population mean
The relative risk of oral cancer among smokers is 1.9 compared
with those who did not, the 95% confidence interval is 1.3-2.8. How
do you elaborate this?
This indicates that the risk of oral cancer is 1.9 times more among
smokers compared to those who don’t smoke. However we are 95%
confident that the true relative risk is no less than 1.3 and no
greater than 2.8
NORMAL DISTRIBUTION
• A normal distribution means that most of the observations in a set of
data are close to the average, while few observations tend to one
extreme or the other
• Bell shaped curve
• Symmetrical
• Total area under the curve is 1
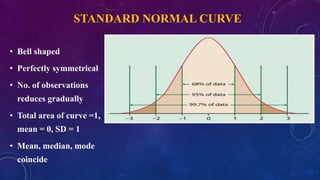
STANDARD NORMAL CURVE
• Bell shaped
• Perfectly symmetrical
• No. of observations
reduces gradually
• Total area of curve =1,
mean = 0, SD = 1
• Mean, median, mode
coincide
EMPIRICAL RULE
• The area between one standard deviation on either side of the mean
will include approximately 68% of the values
• The area between two standard deviation on either side of the mean
will include approximately 95% of the values
• The area between three standard deviation on either side of the mean
will include approximately 99.7% of the values
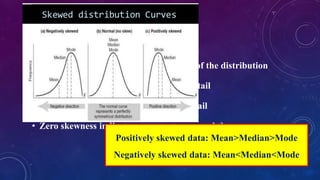
SKEWNESS
• Skewness is the measure of asymmetry of the distribution
• Positive skewness indicates a long right tail
• Negative skewness indicates a long left tail
• Zero skewness indicates a symmetry around the mean
Positively skewed data: Mean>Median>Mode
Negatively skewed data: Mean<Median<Mode
TESTS OF SIGNIFICANCE
Statistical procedures to draw inferences from samples about population
Why
required?
Whether difference between sample estimate and population values is
significant or not?
Differences between different sample estimates significant or not?
STEPS IN TESTS OF SIGNIFICANCE
State Null Hypothesis clearly (Ho)
Choose Level of Significance (α)
Decide test of Significance
Calculate value of test statistic
Obtain P-Value and Conclude Ho
• According to Robson (1994), a parametric statistical test is a test
whose model specifies certain conditions about the parameters of the
population from which the research sample was drawn.
PARAMETRIC TESTS
• Parametric tests are more robust and require less data to make a
stronger conclusion
To use a parametric test,
• Data need to be normally distributed,
• Data also need to have equal variance and have the same standard
deviation.
• Continuous Data
PARAMETRIC TESTS
1. Pearson Product Correlation Coefficient test
2. T test
3. Z test
4. ANOVA
PEARSON PRODUCT CORRELATION COEFFICIENT
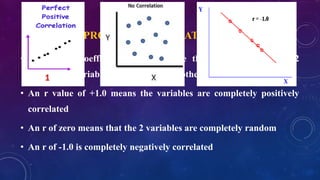
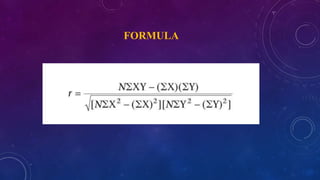
• Correlation coefficient (r) is a value that tells us how well 2
continuous variables correlate to each other.
• An r value of +1.0 means the variables are completely positively
correlated
• An r of zero means that the 2 variables are completely random
• An r of -1.0 is completely negatively correlated
FORMULA
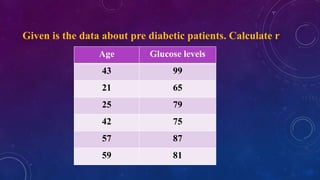
Given is the data about pre diabetic patients. Calculate r
Age Glucose levels
43 99
21 65
25 79
42 75
57 87
59 81
STEP-WISE CALCULATION
X Y
43 99
21 65
25 79
42 75
57 87
59 81
X * Y
4257
1365
1975
3150
4959
4779
X2
1849
441
625
1764
3249
3481
Y2
9801
4225
6241
5625
7569
6561
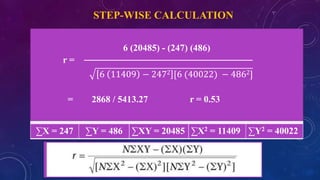
∑X = 247 ∑Y = 486 ∑XY = 20485 ∑X2 = 11409 ∑Y2 = 40022
6 (20485) - (247) (486)
6 11409 − 2472 [6 (40022) − 4862]
r =
= 2868 / 5413.27 r = 0.53
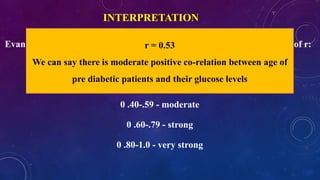
INTERPRETATION
Evans (1996) suggested the strength of correlation for the absolute value of r:
0.00-.19 - very weak
0.20-.39 - weak
0 .40-.59 - moderate
0 .60-.79 - strong
0 .80-1.0 - very strong
r = 0.53
We can say there is moderate positive co-relation between age of
pre diabetic patients and their glucose levels
Z- TEST
• A z-test is used for testing the mean of a sample versus population
mean, or comparing the means of two populations, with large (n ≥ 30)
samples
• It is also used for testing the proportion of some characteristic versus a
standard proportion, or comparing the proportions of two populations.
64
65
A principal at a certain school claims that the students in his school have
above average intelligence. A random sample of 30 students IQ scores have
a mean score of 112. Is there sufficient evidence to support the principal’s
claim? The mean population IQ is 100 with a standard deviation of 15.
Step 1: State the null hypothesis. The accepted fact is that the population
mean is 100, so: H0 is μ = 100
Step 2: State the alternate hypothesis. The claim is that the students have
above average IQ scores, so H1 is μ > 100.
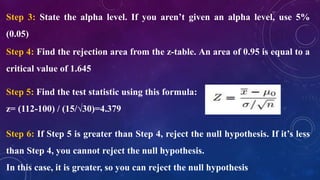
Step 3: State the alpha level. If you aren’t given an alpha level, use 5%
(0.05)
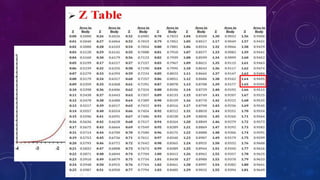
Step 4: Find the rejection area from the z-table. An area of 0.95 is equal to a
critical value of 1.645
Step 5: Find the test statistic using this formula:
z= (112-100) / (15/√30)=4.379
Step 6: If Step 5 is greater than Step 4, reject the null hypothesis. If it’s less
than Step 4, you cannot reject the null hypothesis.
In this case, it is greater, so you can reject the null hypothesis
Total area = 0.95
CRITICAL VALUE
0.5
0.5 – 0.05
= 0.45
T- TEST
Derived by William Seally Gosset in 1908

Assumption for t test:
i. Standard deviation is not known
ii. n < 30
iii. Data must be quantitative
68

Types of t test:
a. Paired t test
b. Unpaired t test
69
Paired t test:
• Consists of a sample of matched pairs of
similar units, or one group of units that has been
tested twice (a "repeated measures" t-test).
• Ex. where subjects are tested prior to a
treatment, say for probing depth, and the same
subjects are tested again after treatment
70
• Suppose a sample of n students were given a diagnostic test before
studying a particular module and then again after completing the
module. Find out if, teaching leads to improvements in students’ test
scores.
• Let x = test score before the module and Y= test score after the module
• Null hypothesis : true mean difference is zero
• Calculate the difference (di = yi − xi) between the two observations on
each pair
• Calculate the mean difference, d.
• Calculate the standard deviation of the differences, Sd, and use this to
calculate the Standard error of the mean difference, SEd = Sd/√n
• Calculate the t-statistic, which is given by T = d/ SEd
• Under the null hypothesis, this statistic follows a t-distribution with n − 1
degrees of freedom.
• Use tables of the t-distribution to compare your value for t to the n−1
distribution.
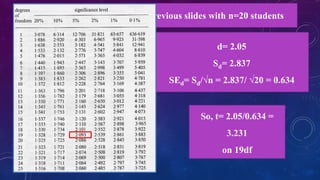
Using the steps mentioned in previous slides with n=20 students
d= 2.05
Sd= 2.837
SEd= Sd/√n = 2.837/ √20 = 0.634
So, t= 2.05/0.634 =
3.231
on 19df
Unpaired t test:
• When two separate sets of independent and identically
distributed samples are obtained, one from each of the two
populations being compared.
• Ex: 1. compare the height of girls and boys.
2. compare 2 stress reduction interventions
when one group practiced mindfulness meditation while the
other learned progressive muscle relaxation.
74
ANALYSIS OF VARIANCE(ANOVA)
• Analysis of variance (ANOVA) is a collection of statistical
models used to analyze the differences between group means
(such as "variation" among and between groups)
• Compares multiple groups at one time
• Developed by R.A. Fisher.
77
NON PARAMETRIC TESTS
• If data doesn't meet the criteria for a parametric test
• Requires more data
• Distribution free, easy to calculate
• Less efficient
NON PARAMETRIC TESTS
• Commonly used Non Parametric Tests are:
− Chi Square test
− McNemar test
− Wilcoxon Signed-Ranks Test
− Mann–Whitney U test
− Kruskal Wallis test
− Friedman test
CHI SQUARE TEST
• First used by Karl Pearson
• Simplest & most widely used non-parametric test
• Calculated using the formula-
χ2 = ∑ ( O – E )2
E
O = observed frequencies
E = expected frequencies
Karl Pearson
(1857–1936)
STEPS IN THE CALCULATION
1. Test the null hypothesis
2. Calculating chi square statistic
3. Applying chi square test
4. Finding degree of freedom
5. Probability tables
• Application of chi-square test:
• Test of association (smoking & cancer, treatment & outcome of
disease, vaccination & immunity)
• Test of proportions (compare frequencies of diabetics & non-
diabetics in groups weighing 40-50kg, 50-60kg, 60-70kg & >70kg.)
• The chi-square for goodness of fit (determine if actual numbers
are similar to the expected/theoretical numbers)
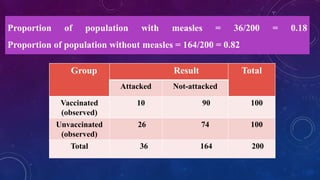
• Attack rates among vaccinated & unvaccinated children against measles
• Prove protective value of vaccination by χ2 test at 5% level of significance
Group Result Total
Attacked Not-attacked
Vaccinated
(observed)
10 90 100
Unvaccinated
(observed)
26 74 100
Total 36 164 200
Proportion of population with measles = 36/200 = 0.18
Proportion of population without measles = 164/200 = 0.82
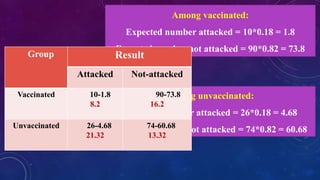
Among unvaccinated:
Expected number attacked = 26*0.18 = 4.68
Expected number not attacked = 74*0.82 = 60.68
Among vaccinated:
Expected number attacked = 10*0.18 = 1.8
Expected number not attacked = 90*0.82 = 73.8
Group Result
Attacked Not-attacked
Vaccinated 10-1.8
8.2
90-73.8
16.2
Unvaccinated 26-4.68
21.32
74-60.68
13.32
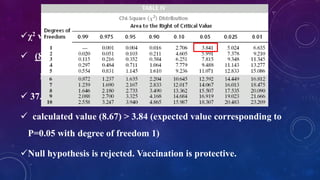
χ2 value = ∑ (O-E)2/E
 (8.2)2 + (16.2)2 + (21.32)2 + (13.32)2
1.8 73.8 4.68 60.68
 37.35 + 3.5561 + 97.12 + 2.923 = 140.949
 calculated value (8.67) > 3.84 (expected value corresponding to
P=0.05 with degree of freedom 1)
Null hypothesis is rejected. Vaccination is protective.
FISHER’S EXACT TEST
• Used when the
• Total number of cases is <20 or
• The expected number of cases in any cell is ≤1 or
• More than 25% of the cells have expected
frequencies <5.
Ronald A.
Fisher
(1890–1962)
Mc NEMAR TEST
• Used to compare before and after findings in the same
individual or to compare findings in a matched analysis
• Example: comparing the attitudes of medical students
toward confidence in statistics analysis before and after
the intensive statistics course.
McNemar
88
WILCOXON SIGNED-RANK TEST
• Nonparametric equivalent of the paired t-test.
• Takes into consideration the magnitude of
difference among the pairs of values.
WILCOXON
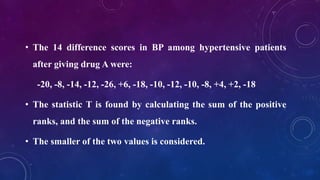
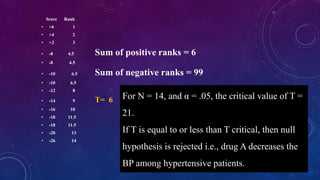
• The 14 difference scores in BP among hypertensive patients
after giving drug A were:
-20, -8, -14, -12, -26, +6, -18, -10, -12, -10, -8, +4, +2, -18
• The statistic T is found by calculating the sum of the positive
ranks, and the sum of the negative ranks.
• The smaller of the two values is considered.
Score Rank
• +6 1
• +4 2
• +2 3
• -8 4.5 Sum of positive ranks = 6
• -8 4.5
• -10 6.5 Sum of negative ranks = 99
• -10 6.5
• -12 8
• -14 9 T= 6
• -16 10
• -18 11.5
• -18 11.5
• -20 13
• -26 14
For N = 14, and α = .05, the critical value of T =
21.
If T is equal to or less than T critical, then null
hypothesis is rejected i.e., drug A decreases the
BP among hypertensive patients.
MANN-WHITNEY U TEST
• Mann-Whitney U – similar to Wilcoxon signed-ranks test except that
the samples are independent and not paired
• Null hypothesis: the population means are the same for the two
groups
• Rank the combined data values for the two groups. Then find the
average rank in each group.
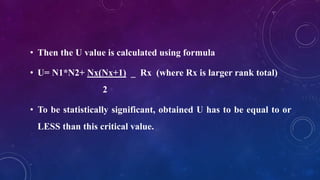
• Then the U value is calculated using formula
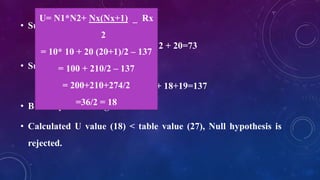
• U= N1*N2+ Nx(Nx+1) _ Rx (where Rx is larger rank total)
2
• To be statistically significant, obtained U has to be equal to or
LESS than this critical value.
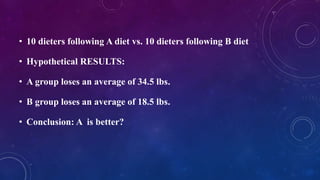
• 10 dieters following A diet vs. 10 dieters following B diet
• Hypothetical RESULTS:
• A group loses an average of 34.5 lbs.
• B group loses an average of 18.5 lbs.
• Conclusion: A is better?
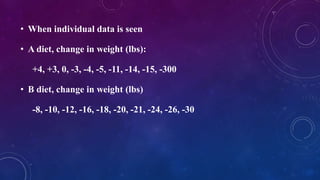
• When individual data is seen
• A diet, change in weight (lbs):
+4, +3, 0, -3, -4, -5, -11, -14, -15, -300
• B diet, change in weight (lbs)
-8, -10, -12, -16, -18, -20, -21, -24, -26, -30
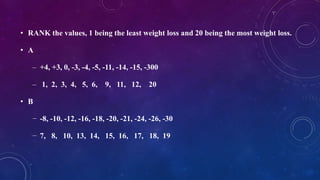
• RANK the values, 1 being the least weight loss and 20 being the most weight loss.
• A
– +4, +3, 0, -3, -4, -5, -11, -14, -15, -300
– 1, 2, 3, 4, 5, 6, 9, 11, 12, 20
• B
− -8, -10, -12, -16, -18, -20, -21, -24, -26, -30
− 7, 8, 10, 13, 14, 15, 16, 17, 18, 19
• Sum of A’s ranks:
1+ 2 + 3 + 4 + 5 + 6 + 9 + 11+ 12 + 20=73
• Sum of B’s ranks:
7 + 8 +10+ 13+ 14+ 15+16+ 17+ 18+19=137
• B clearly ranked higher.
• Calculated U value (18) < table value (27), Null hypothesis is
rejected.
U= N1*N2+ Nx(Nx+1) _ Rx
2
= 10* 10 + 20 (20+1)/2 – 137
= 100 + 210/2 – 137
= 200+210+274/2
=36/2 = 18
KRUSKAL-WALLIS
• It’s more powerful than Chi-square test.
• It is computed exactly like the Mann-Whitney test, except that
there are more groups (>2 groups).
FRIEDMAN TEST
• Friedman : When either a matched-subjects or repeated-
measure design is used and the hypothesis of a difference
among three or more (k) treatments is to be tested, the
Friedman ANOVA can be used.
SPEARMAN CORRELATION COEFFICIENT TEST
• Spearman correlation coefficient, rs, can take values from +1 to -1.
• A rs of +1 indicates a perfect association of ranks, a rs of zero
indicates no association between ranks and a rs of -1 indicates a
perfect negative association of ranks.
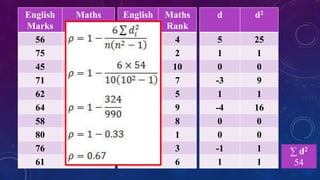
S
English
Marks
Maths
Marks
56 66
75 70
45 40
71 60
62 65
64 56
58 59
80 77
76 67
61 63
English
Rank
Maths
Rank
9 4
3 2
10 10
4 7
6 5
5 9
8 8
1 1
2 3
7 6
d d2
5 25
1 1
0 0
-3 9
1 1
-4 16
0 0
0 0
-1 1
1 1
∑ d2
54