Download as PDF, PPTX
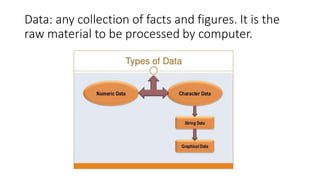
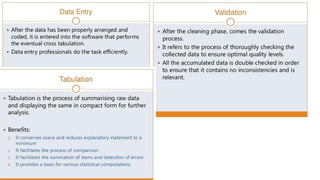
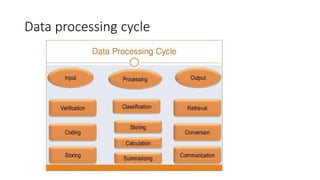
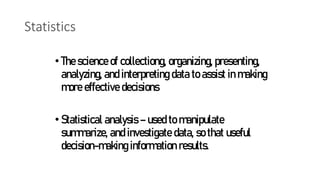
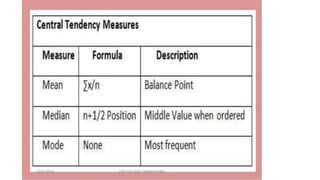
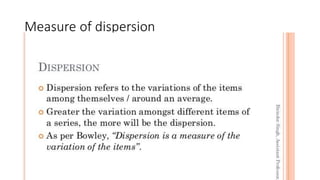
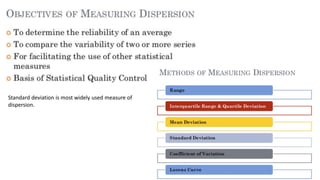
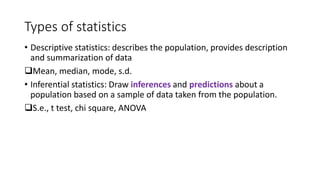
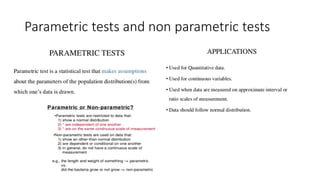
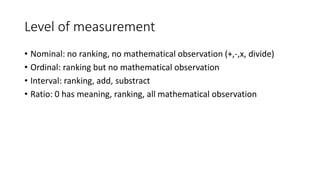
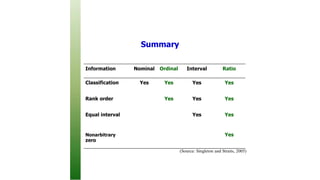

This document provides an overview of basic statistical concepts including: 1) It defines key terms like data, dataset, variables, cases, and the data processing cycle. 2) It explains the differences between descriptive statistics which summarize data, and inferential statistics which make predictions from samples. 3) It discusses measures of dispersion like standard deviation and standard error, and how to choose between them depending on the goal of analyzing spread or comparing sample means.