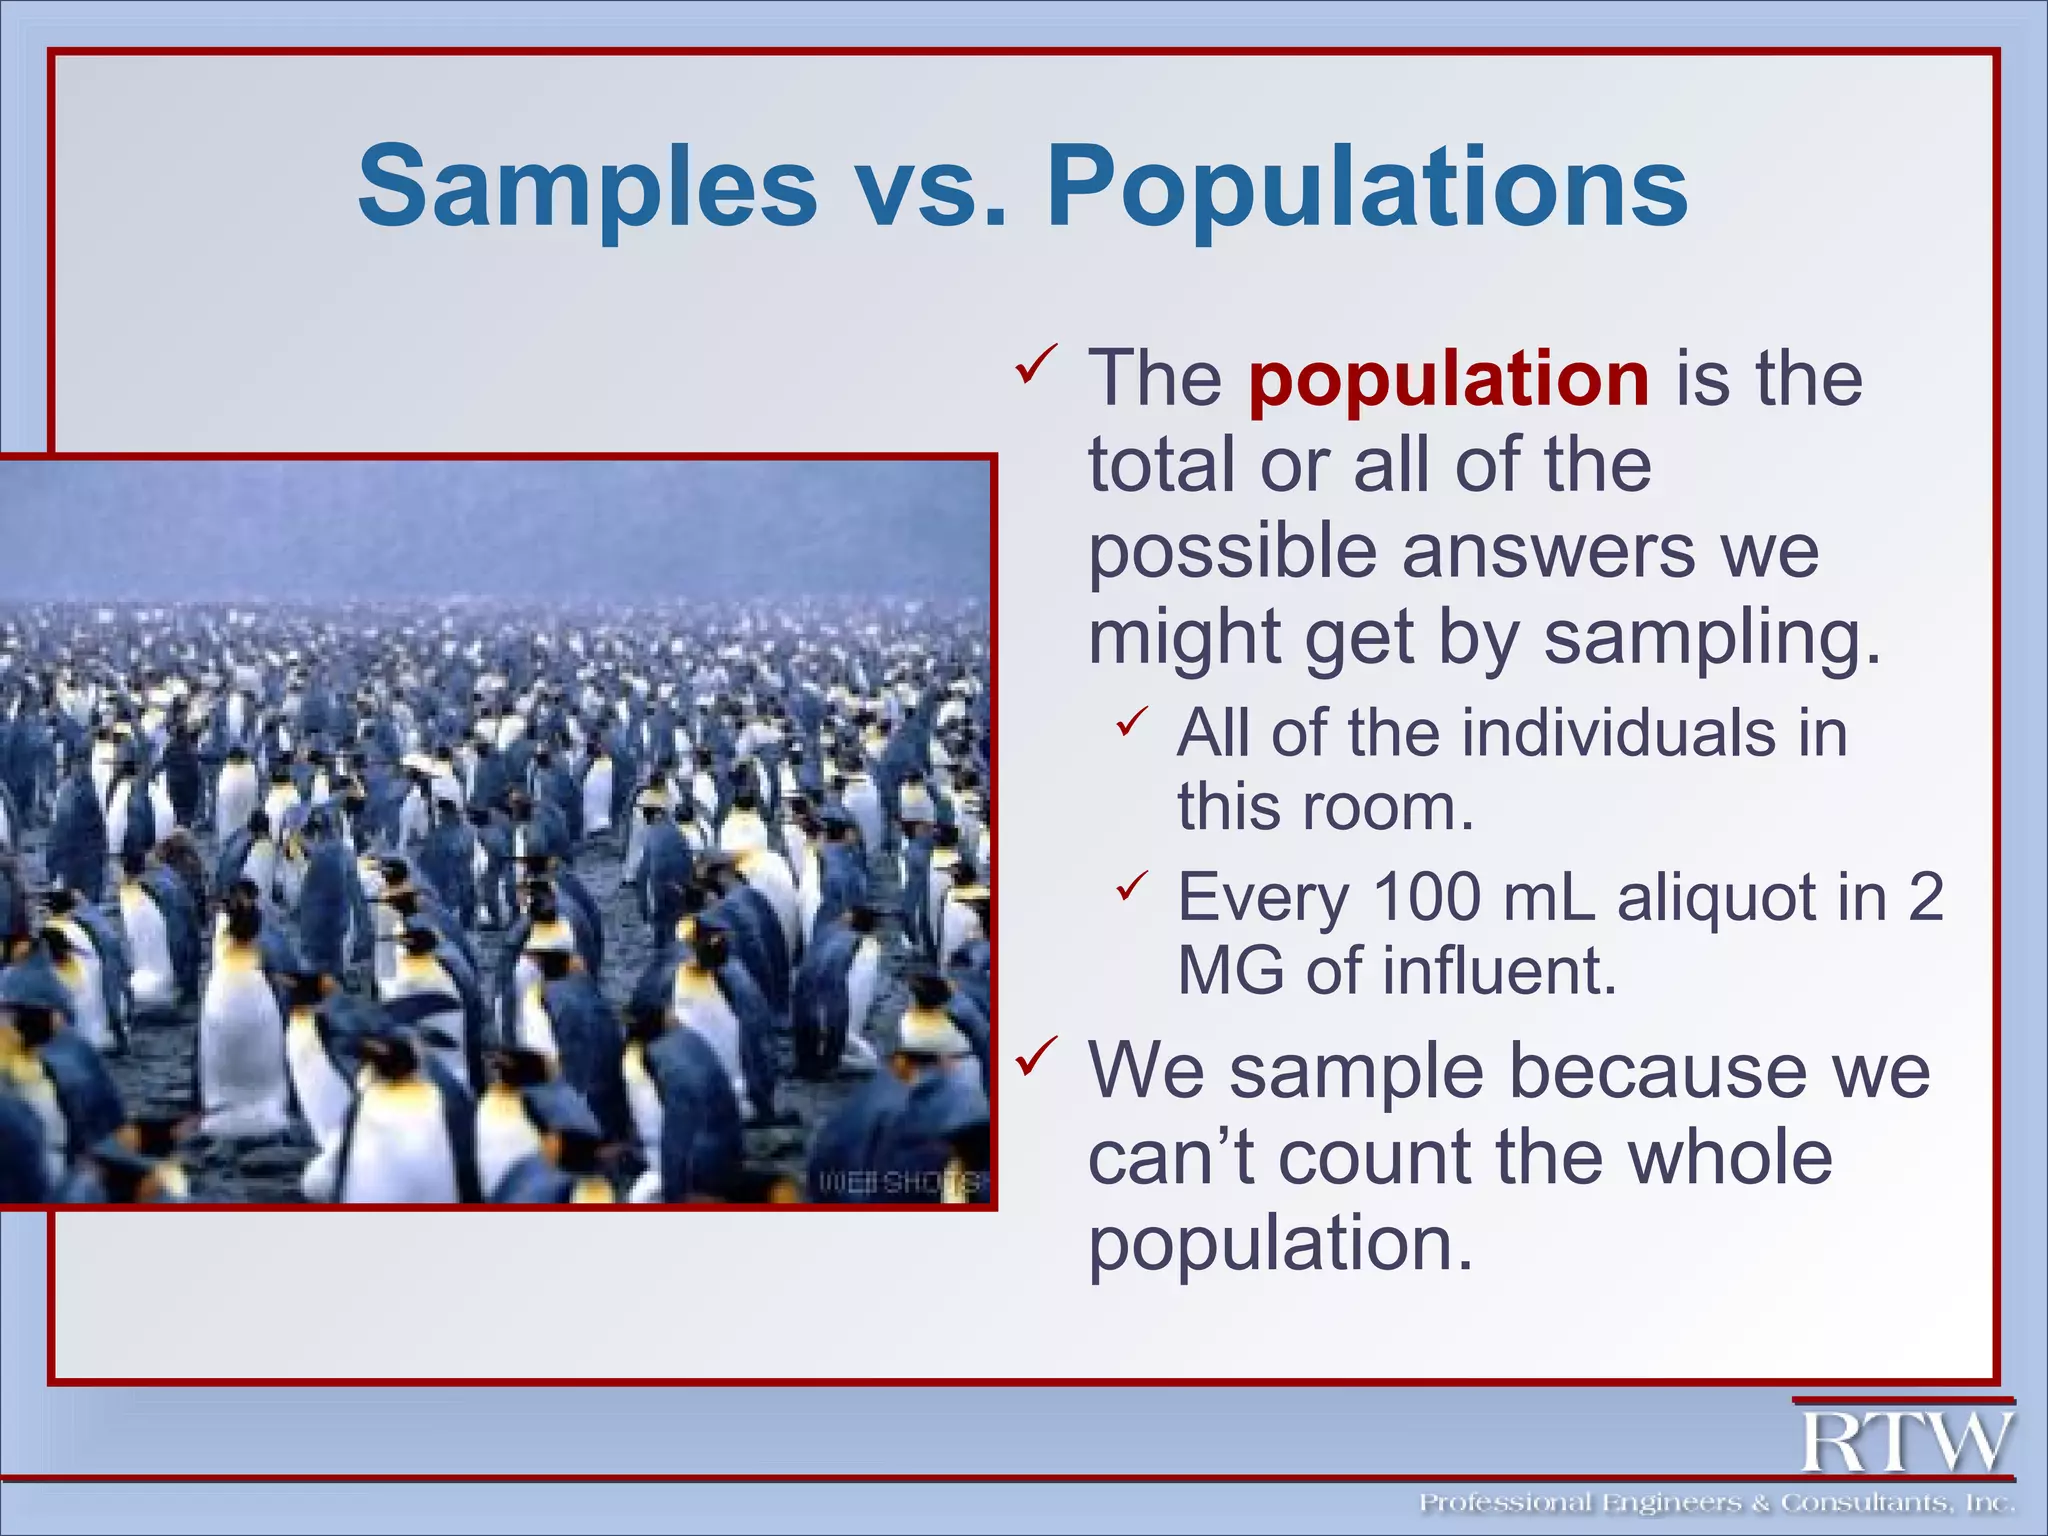
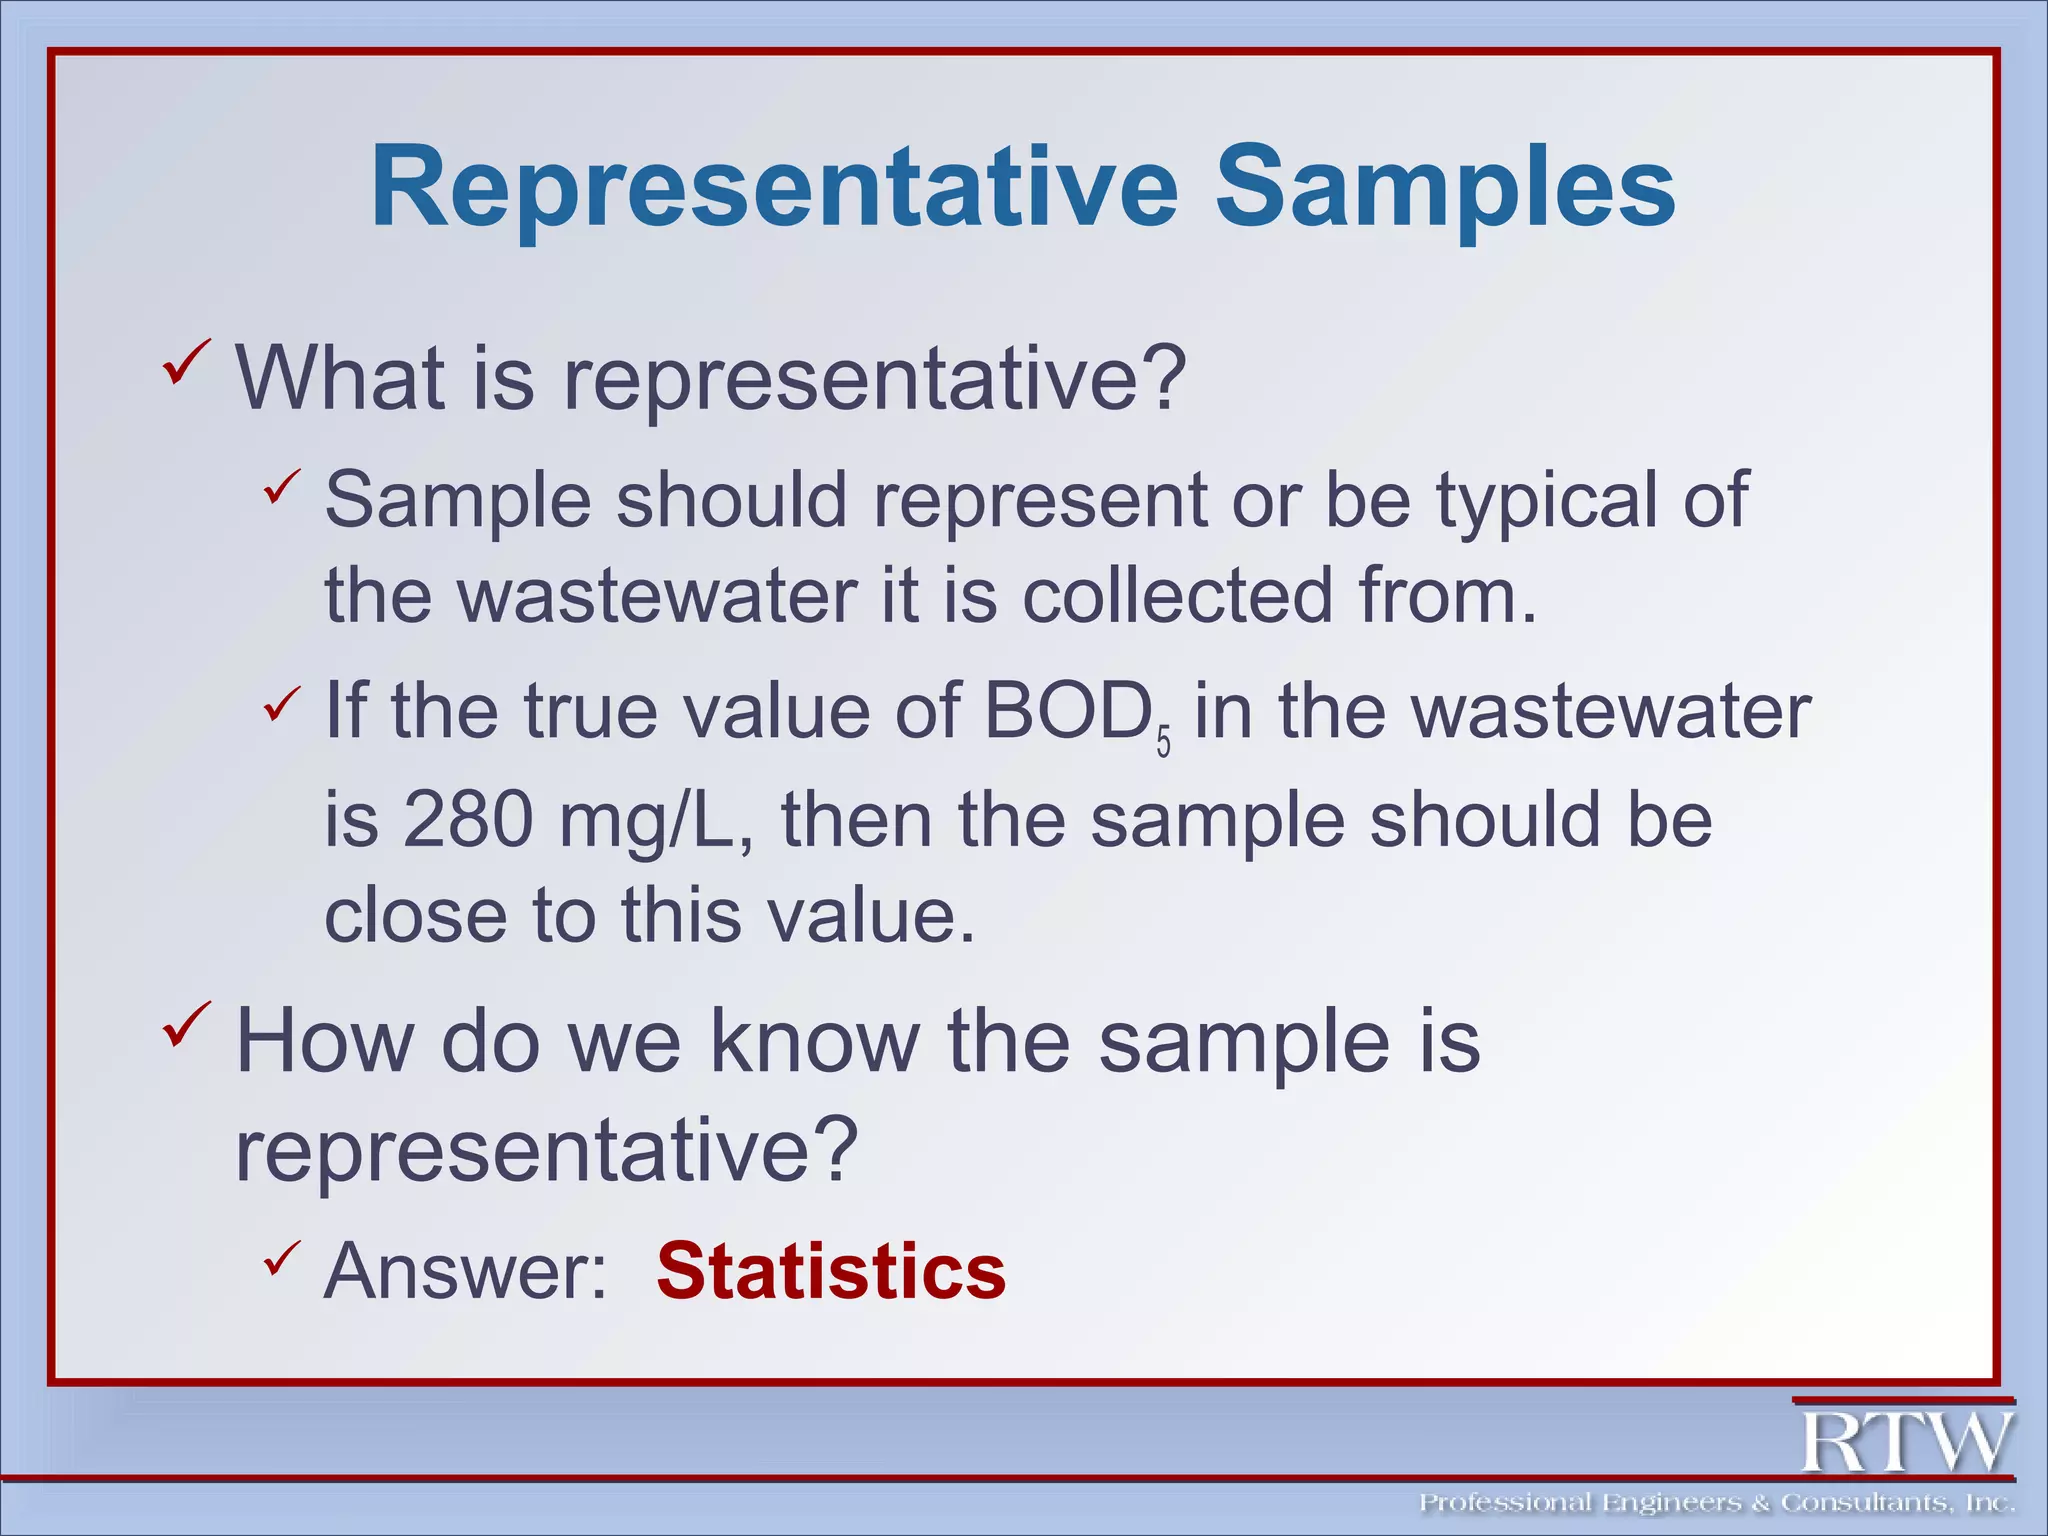
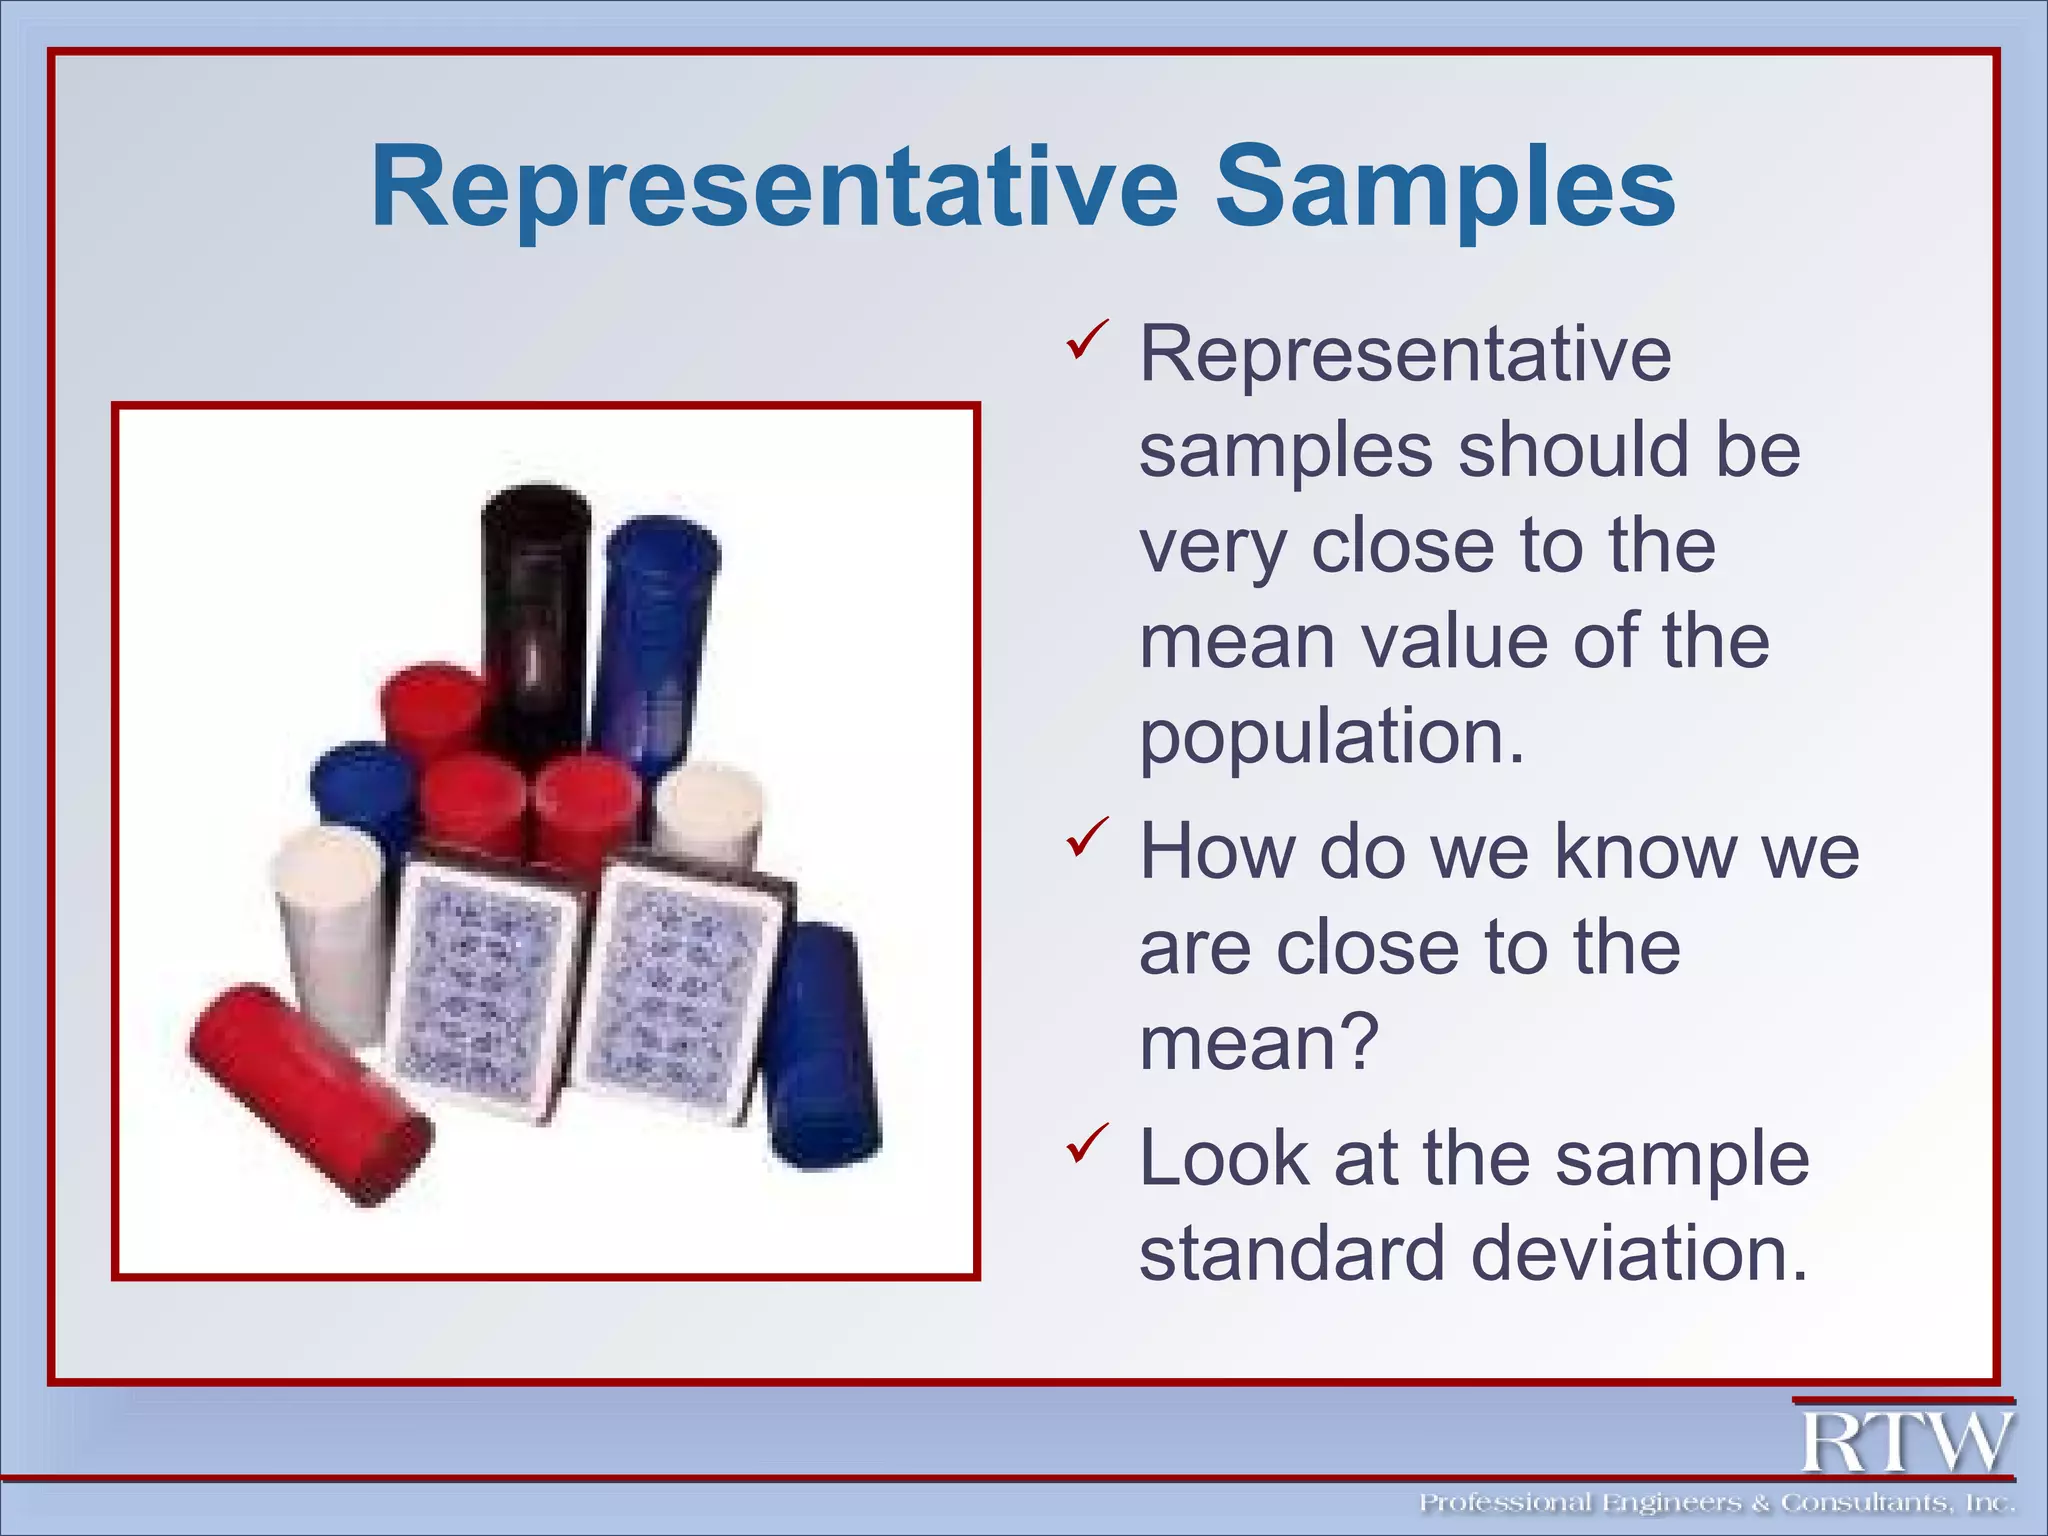
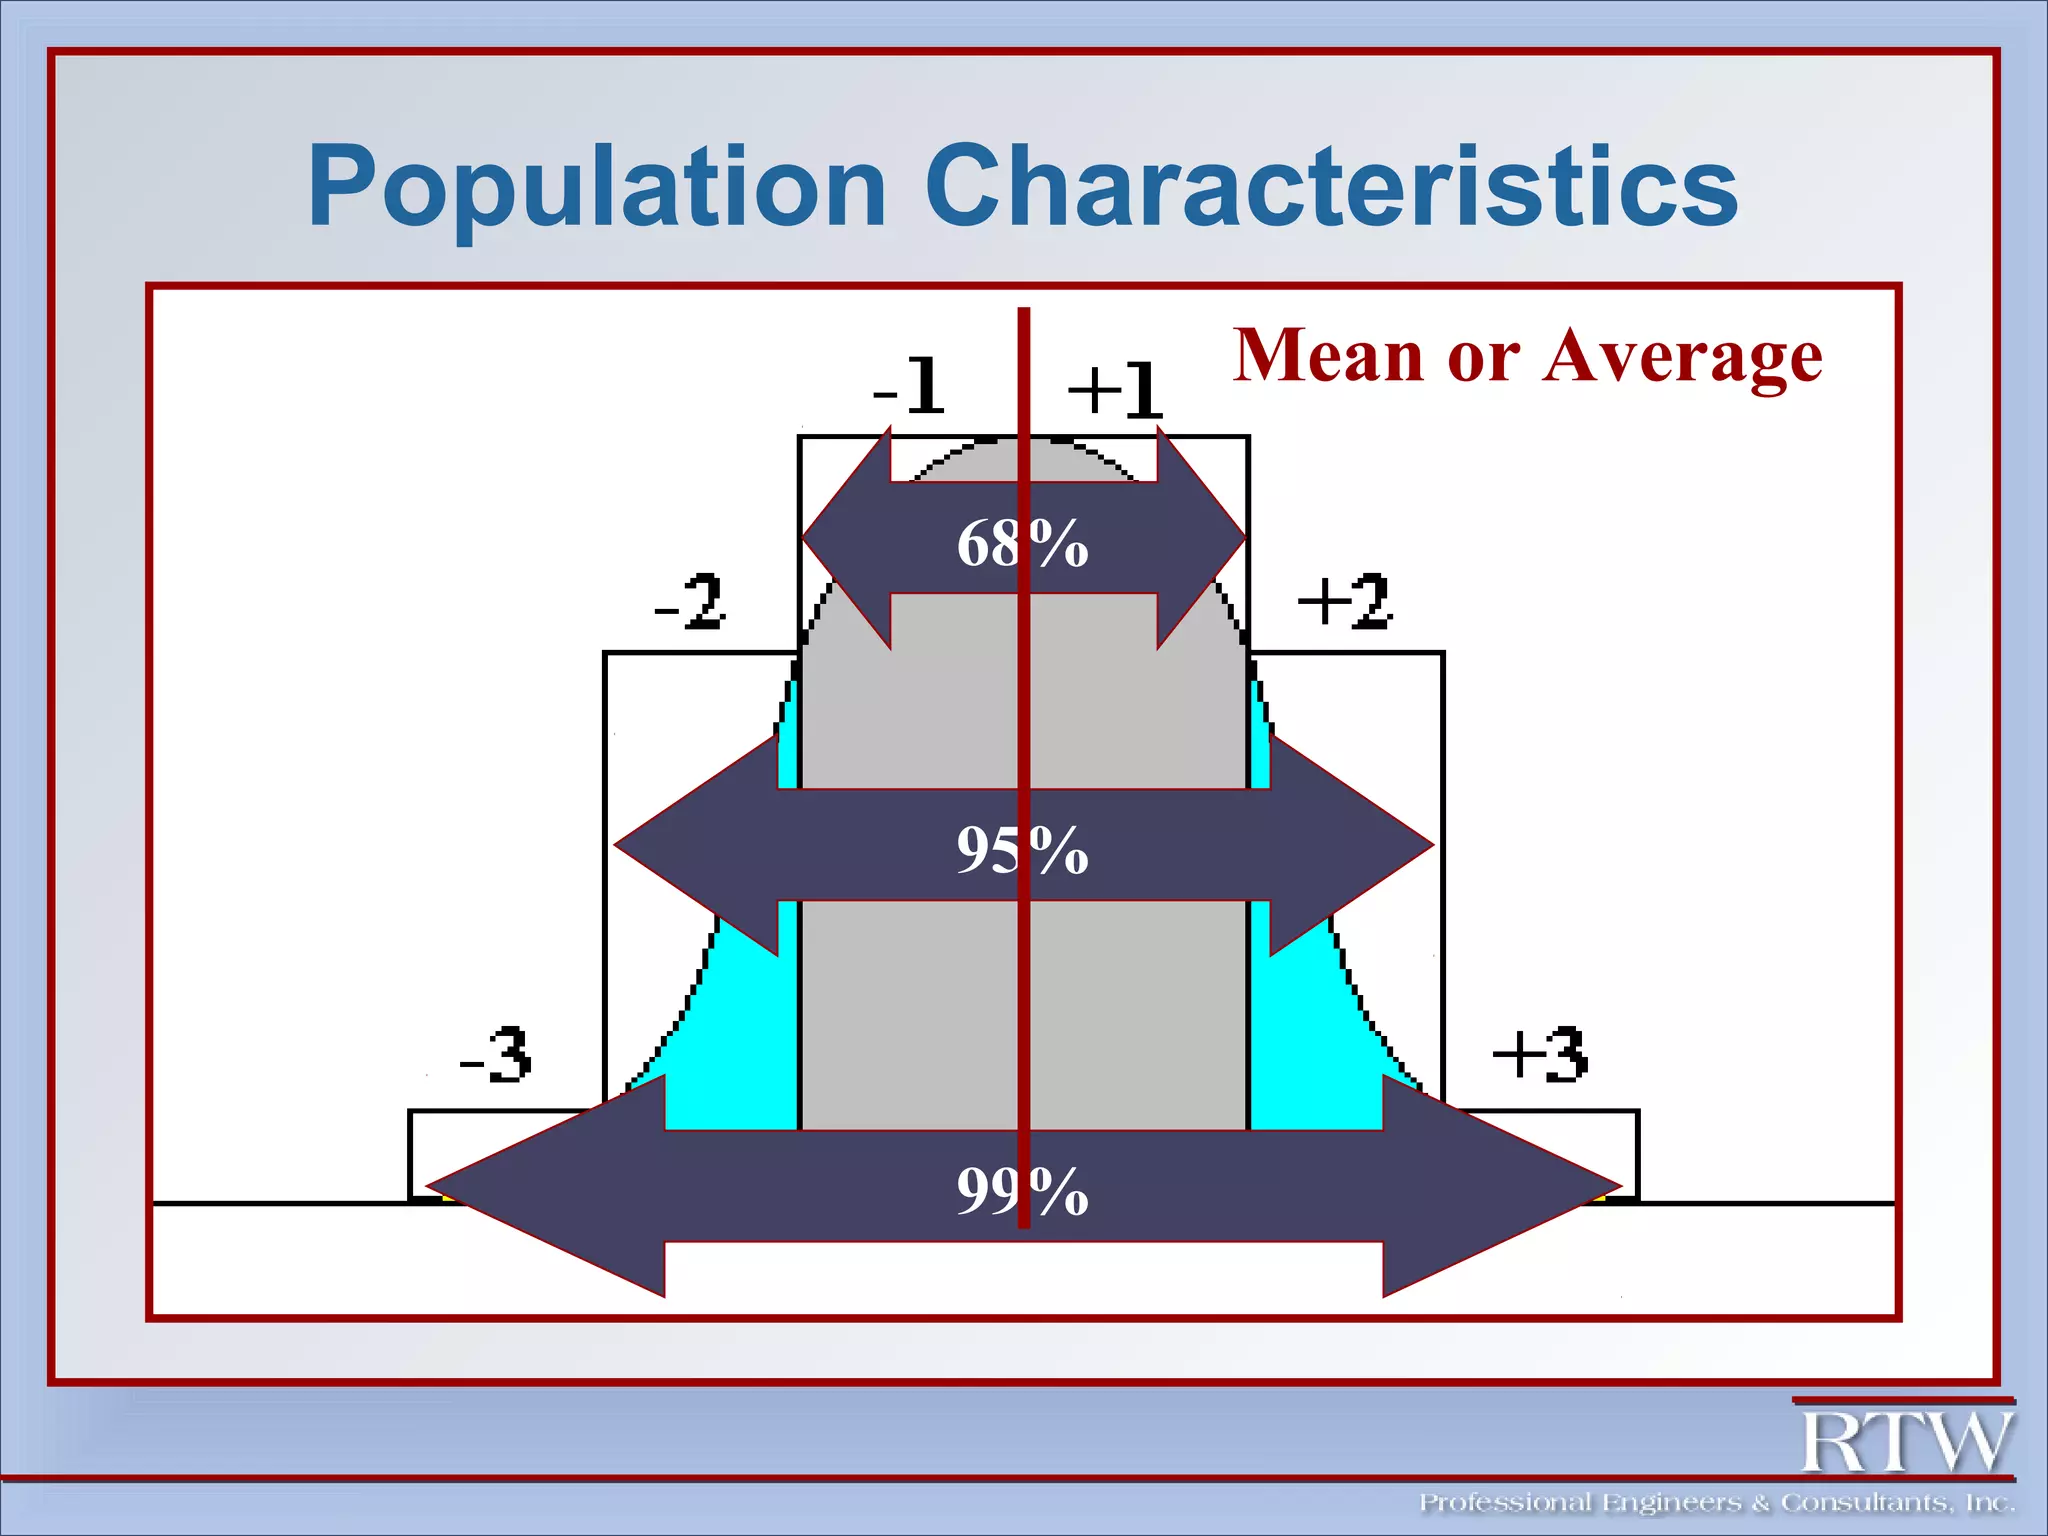
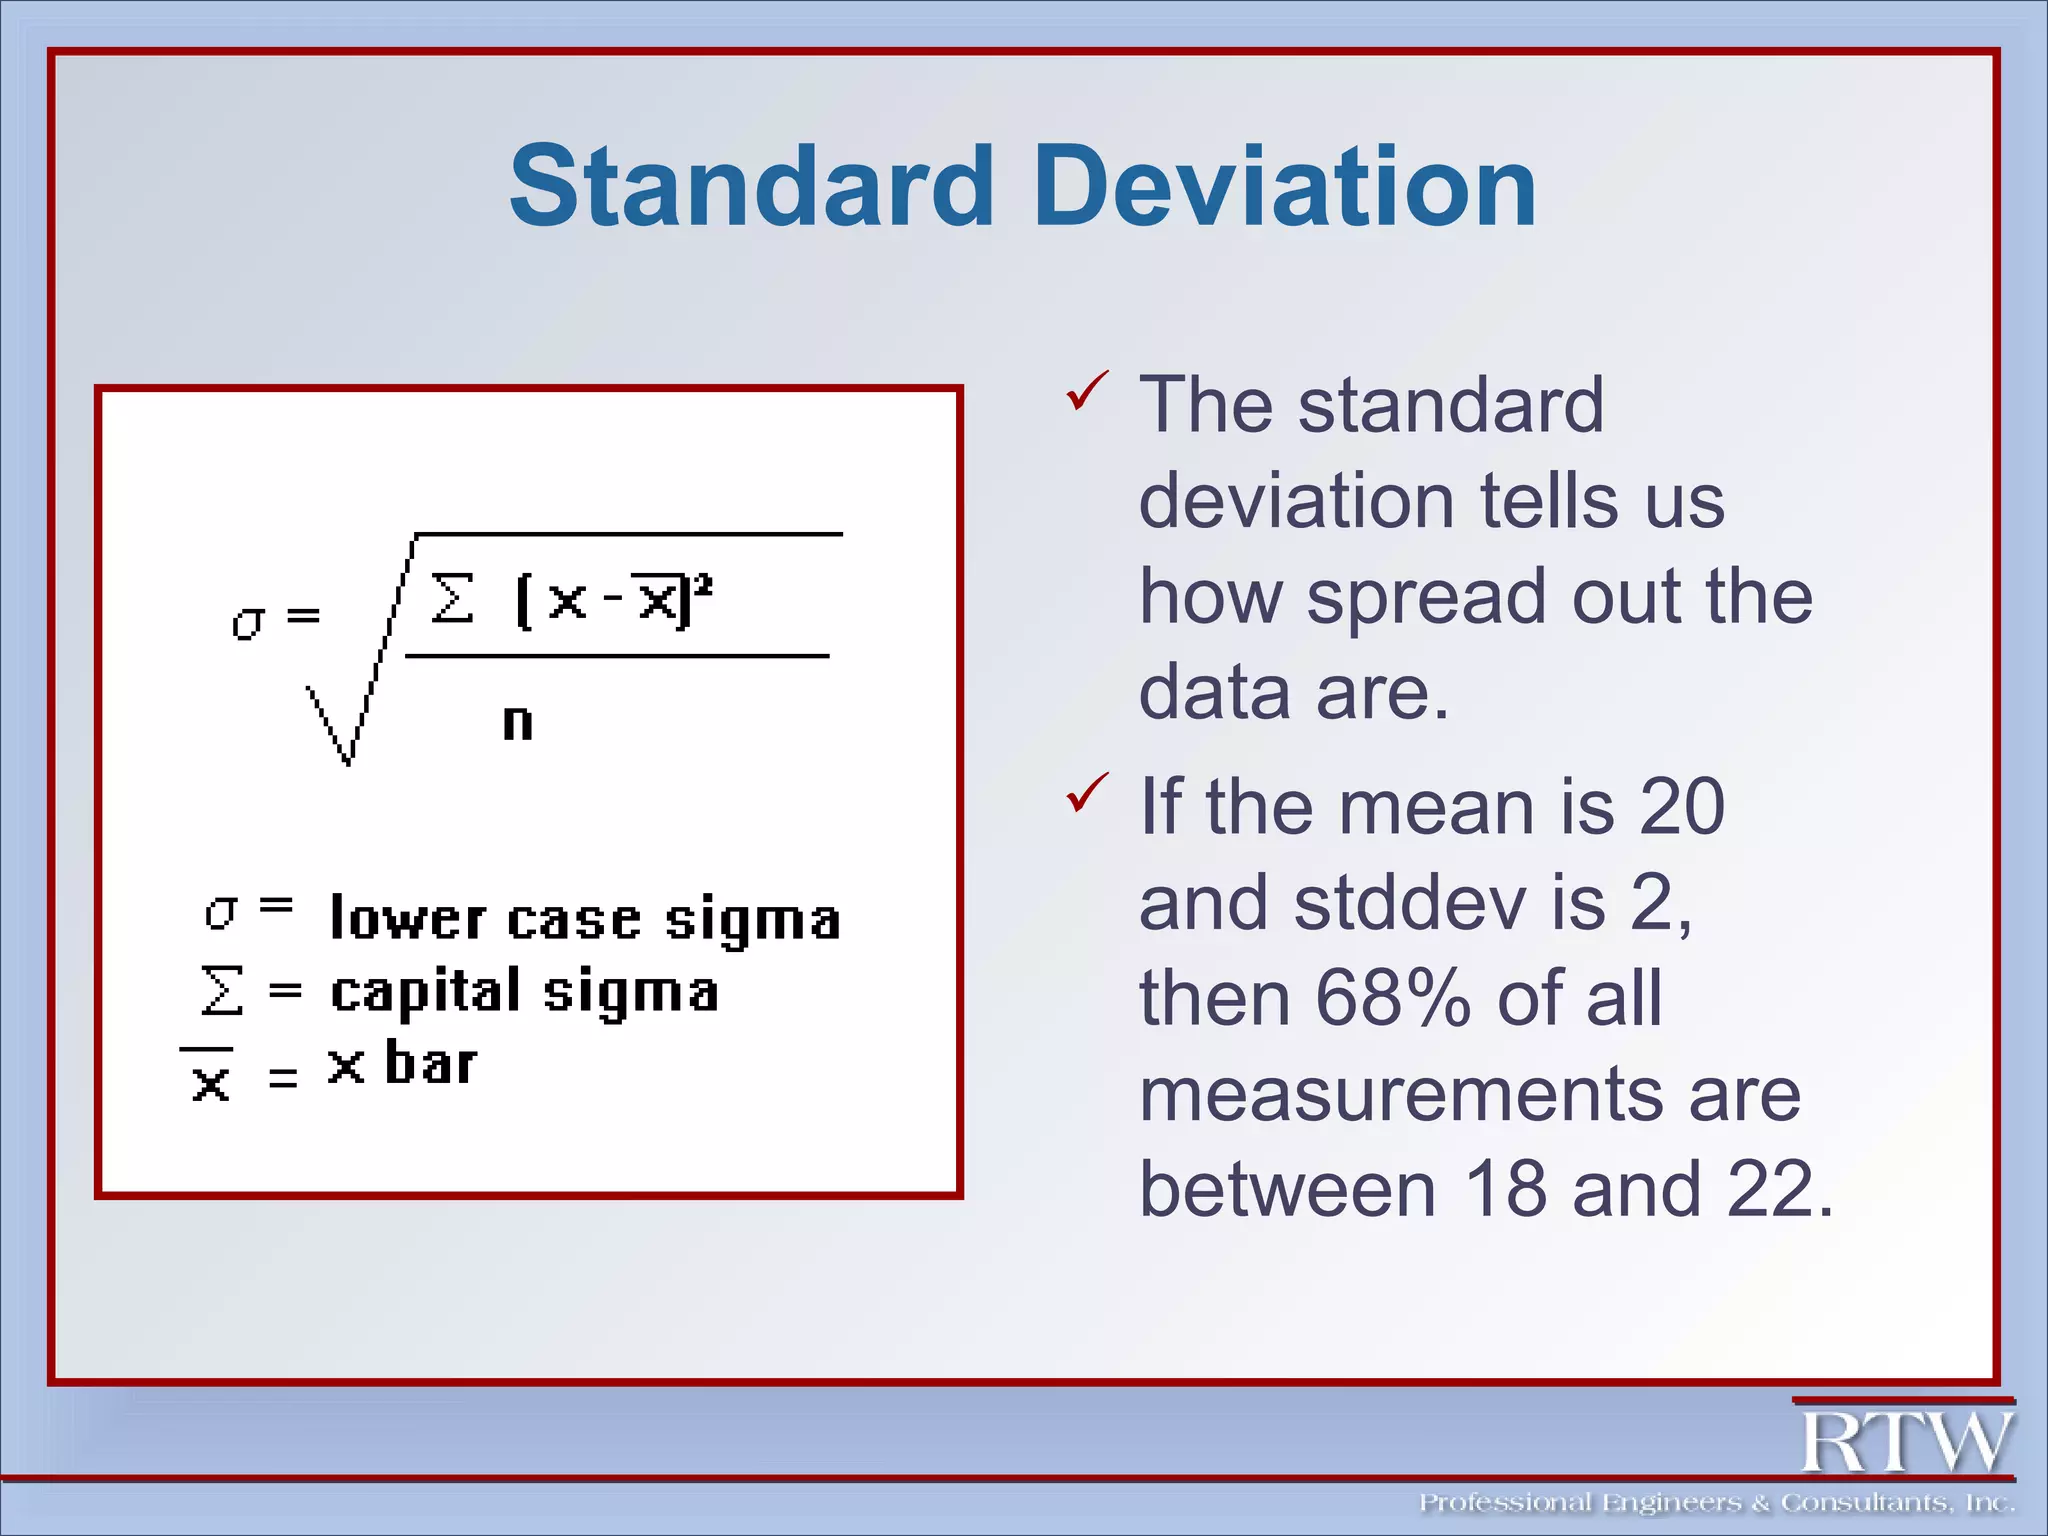
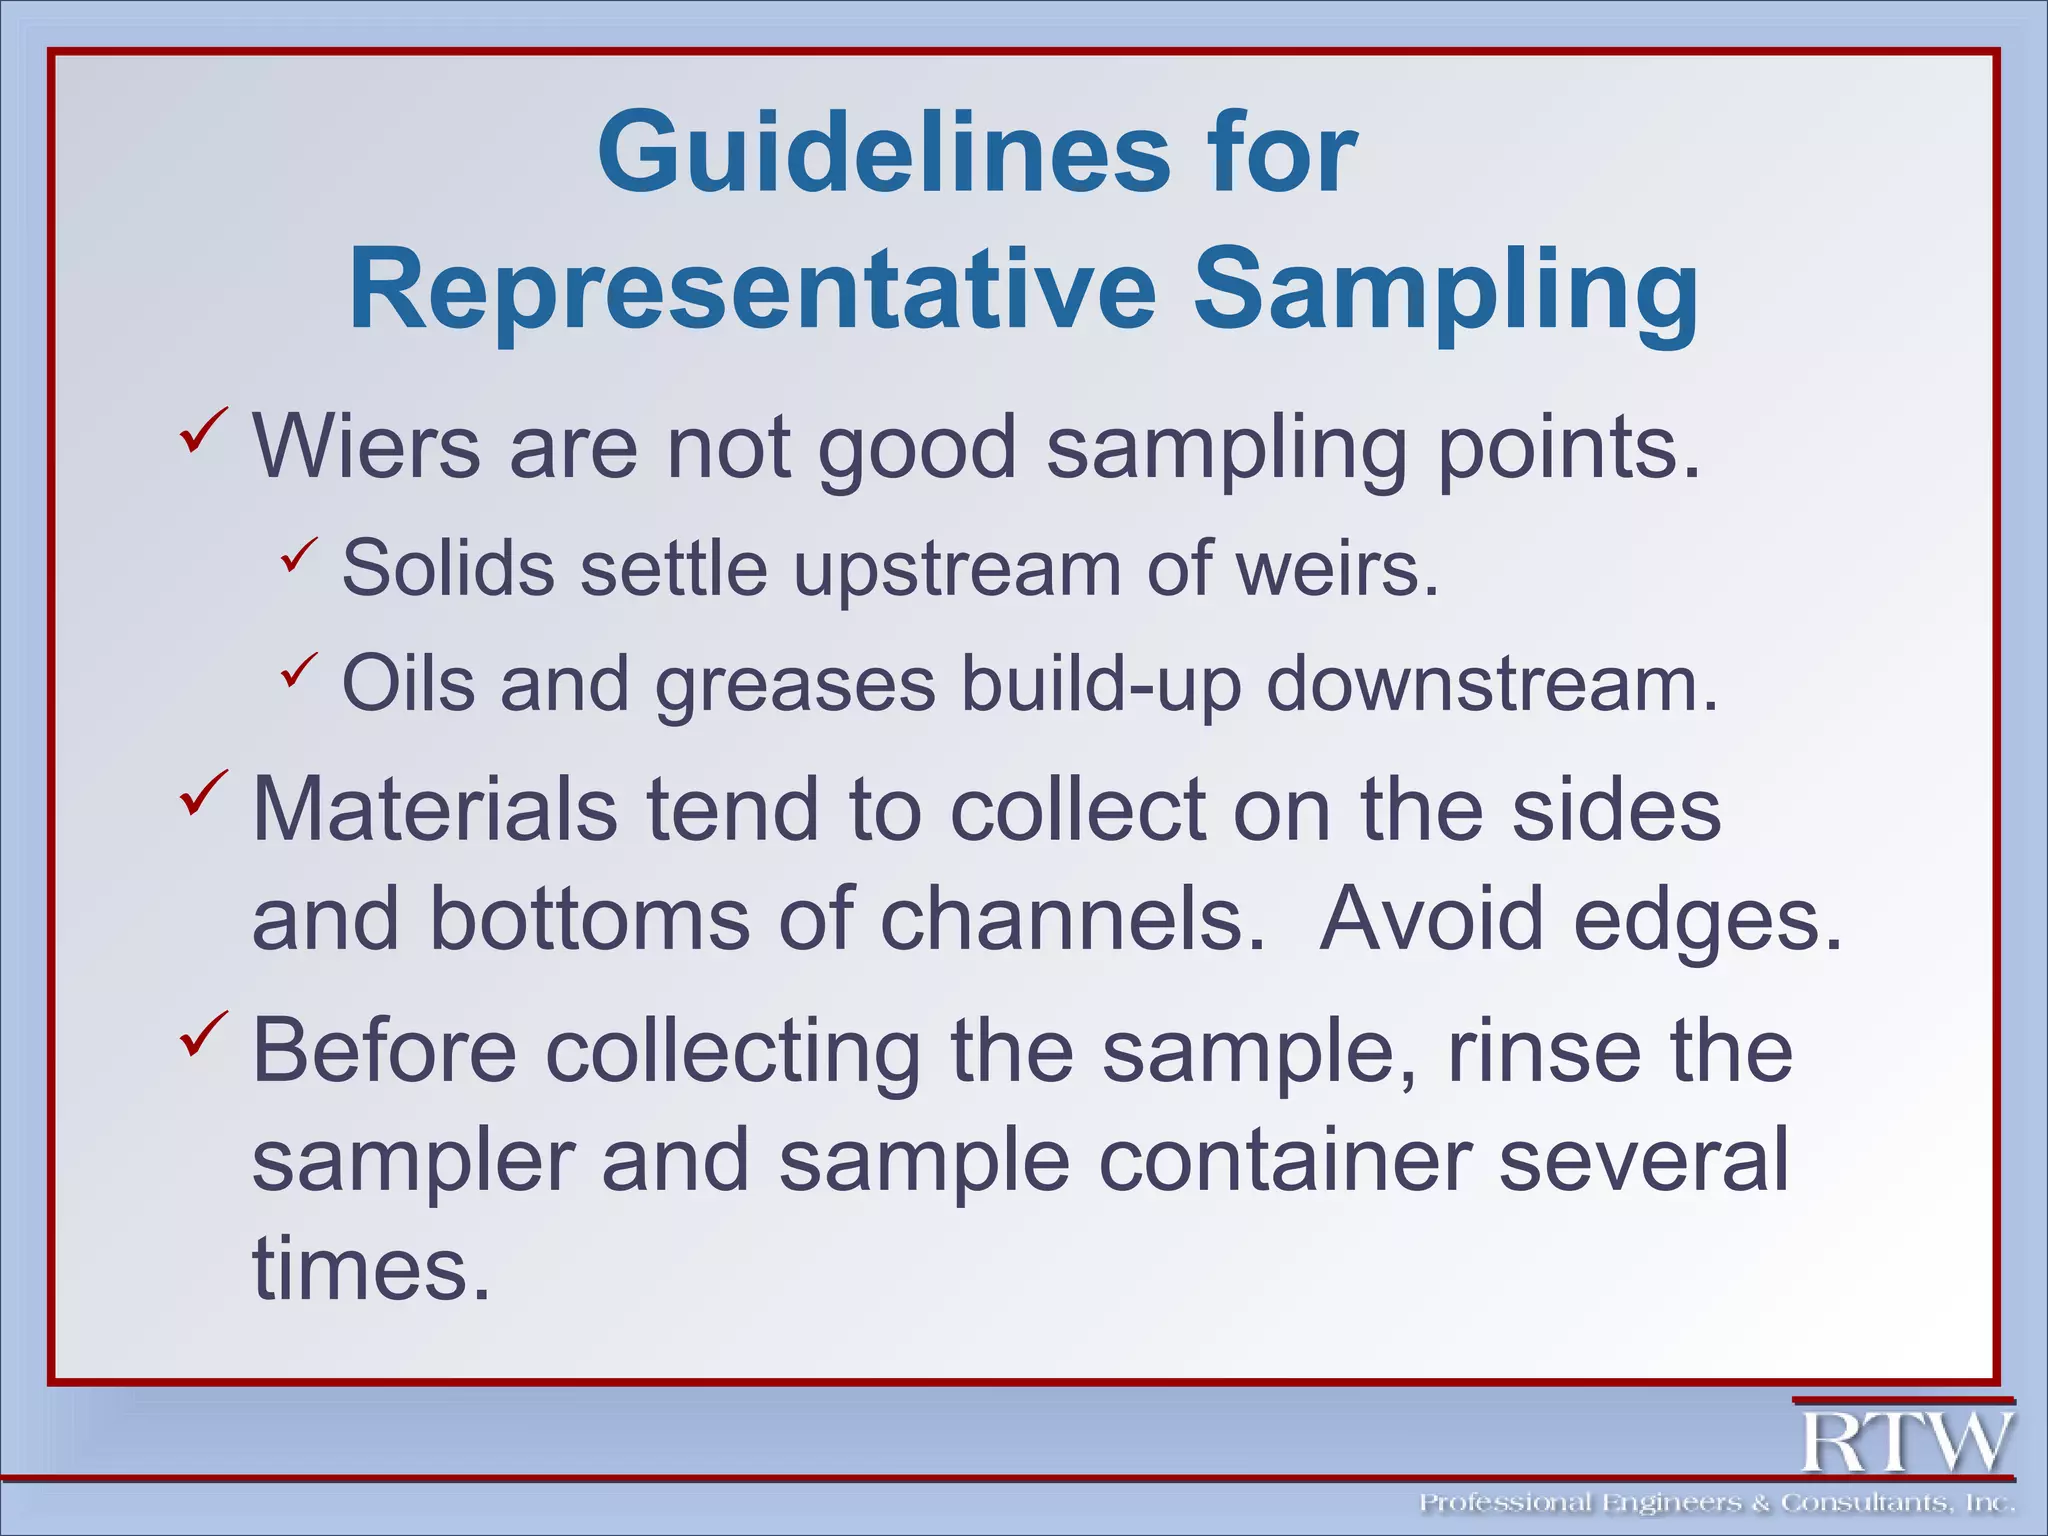
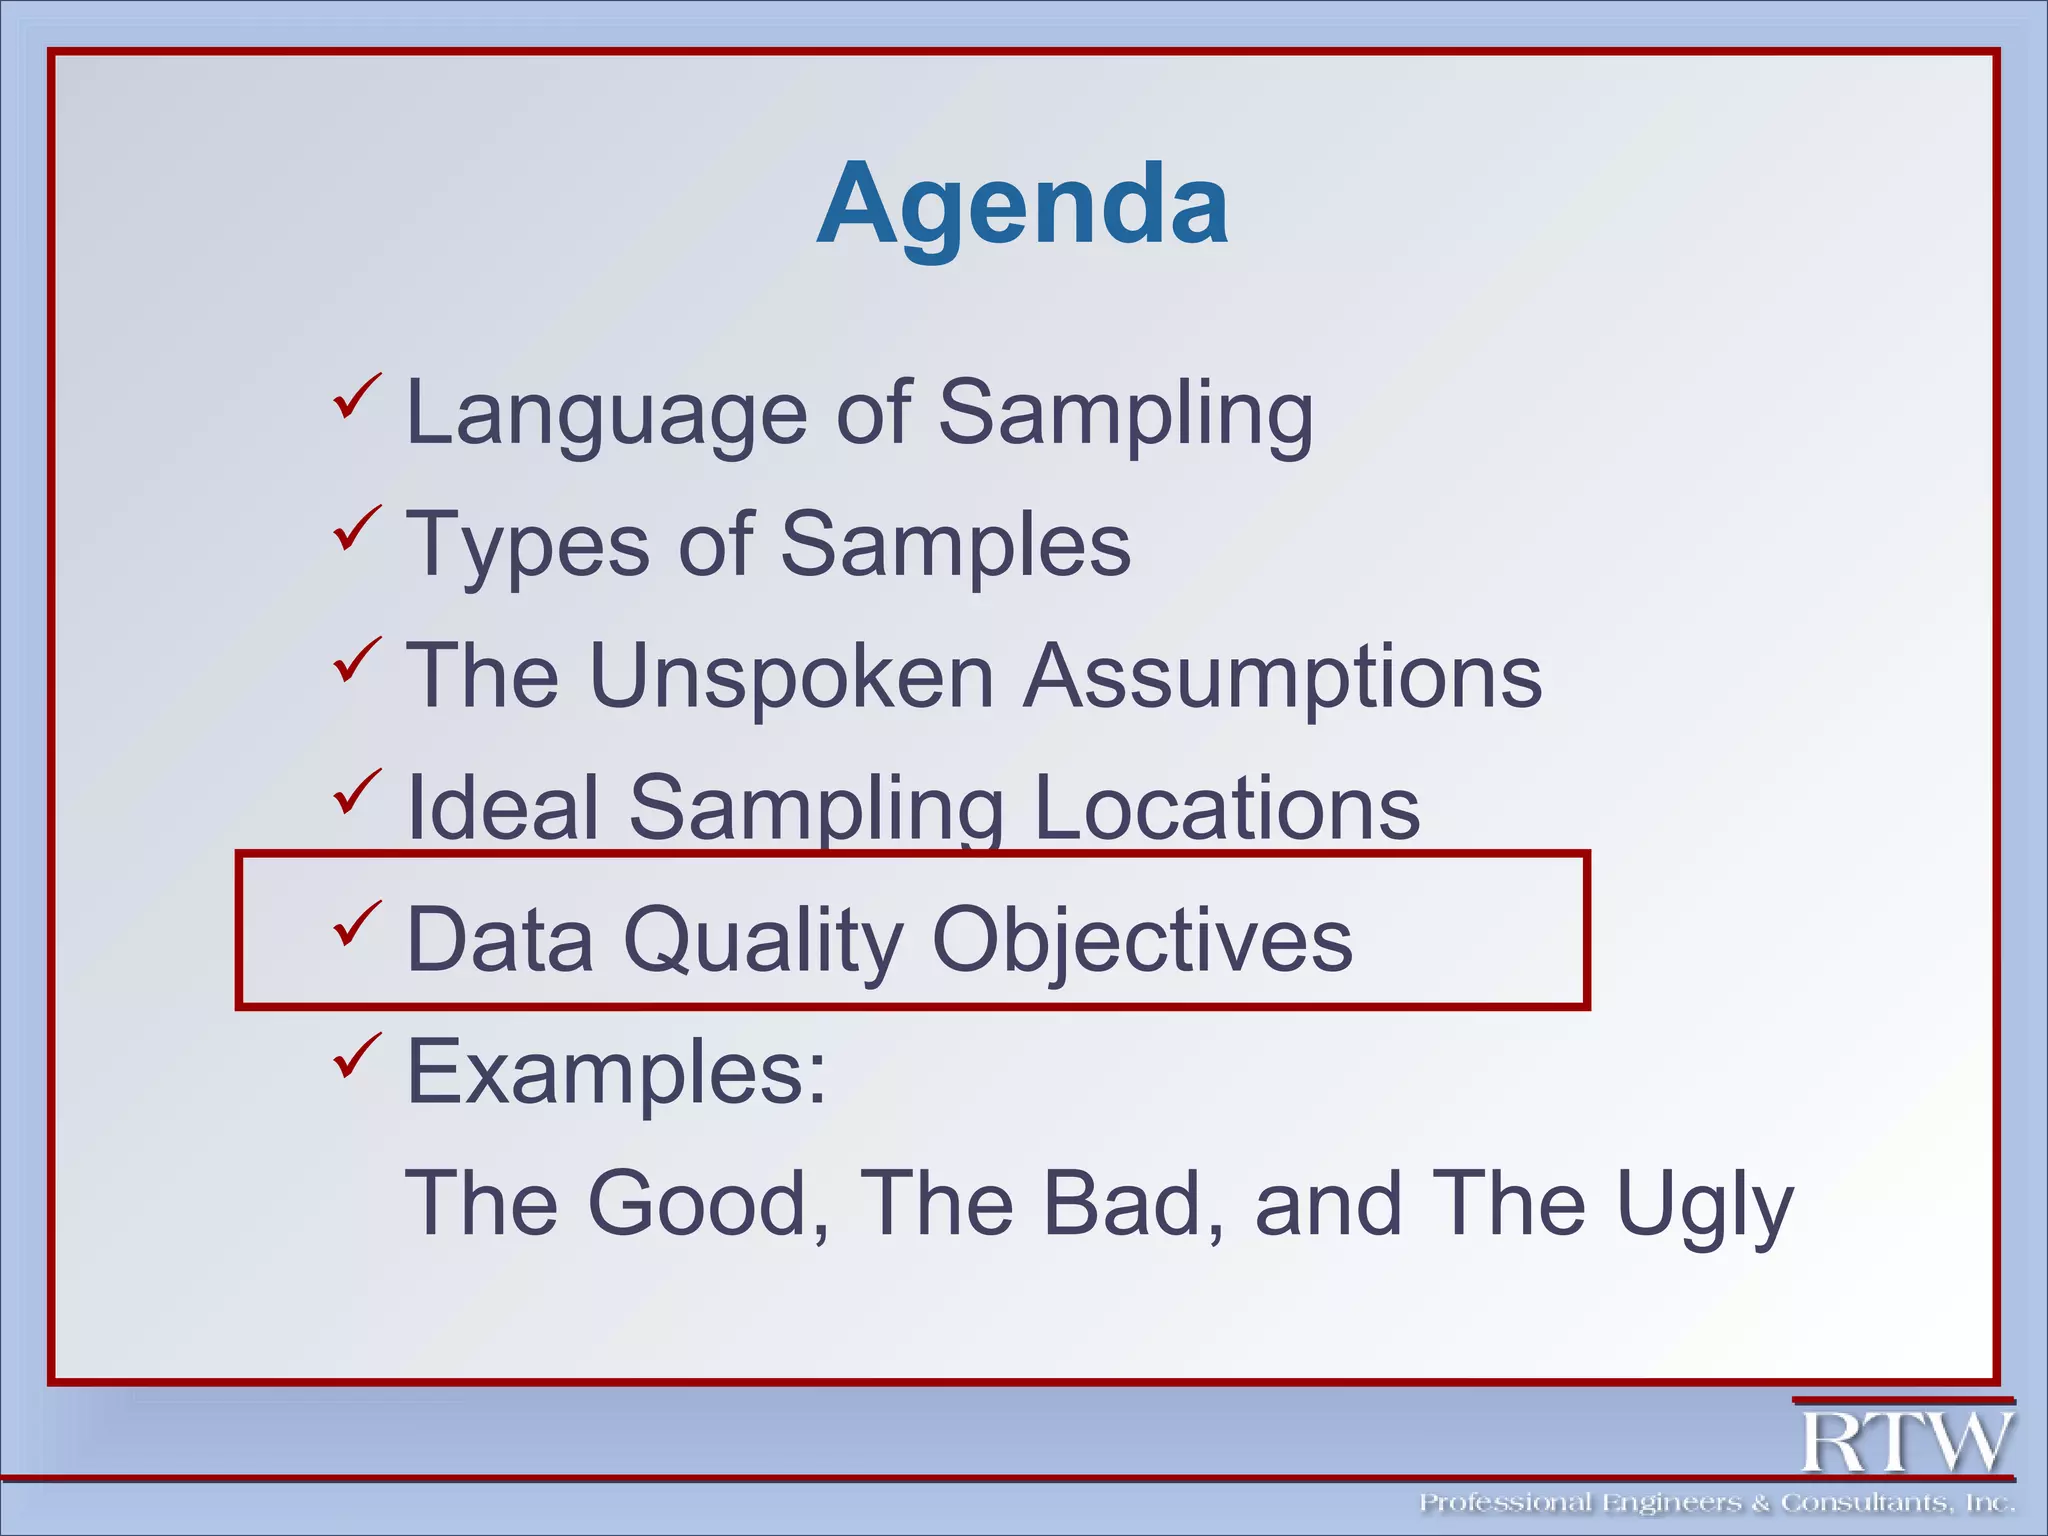
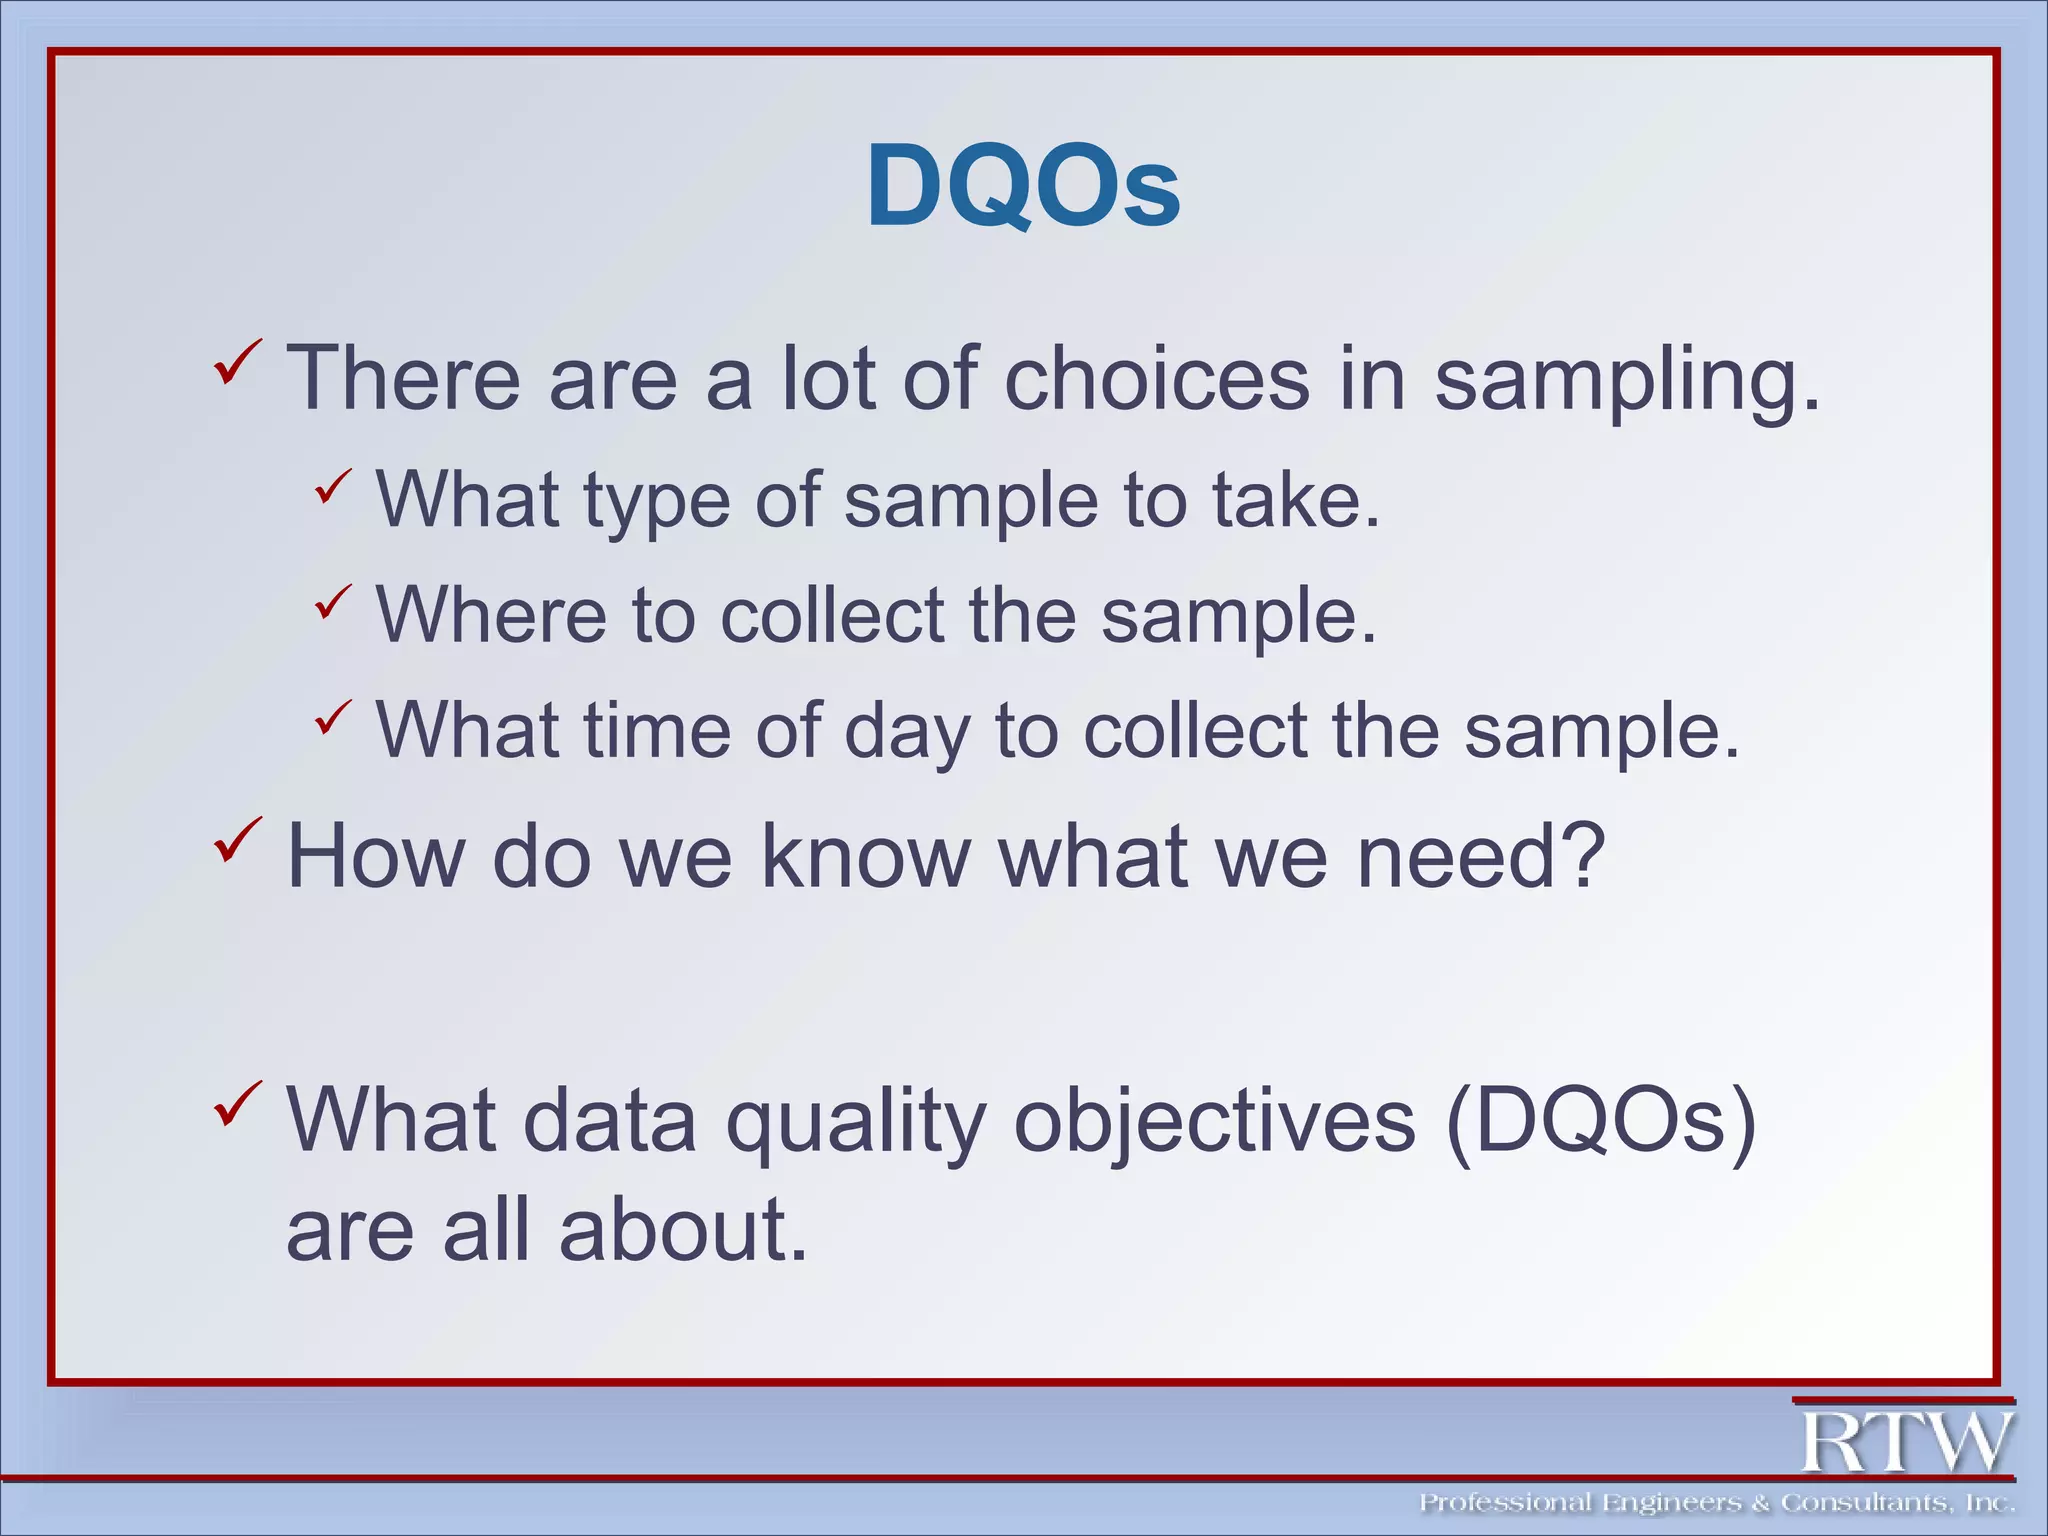
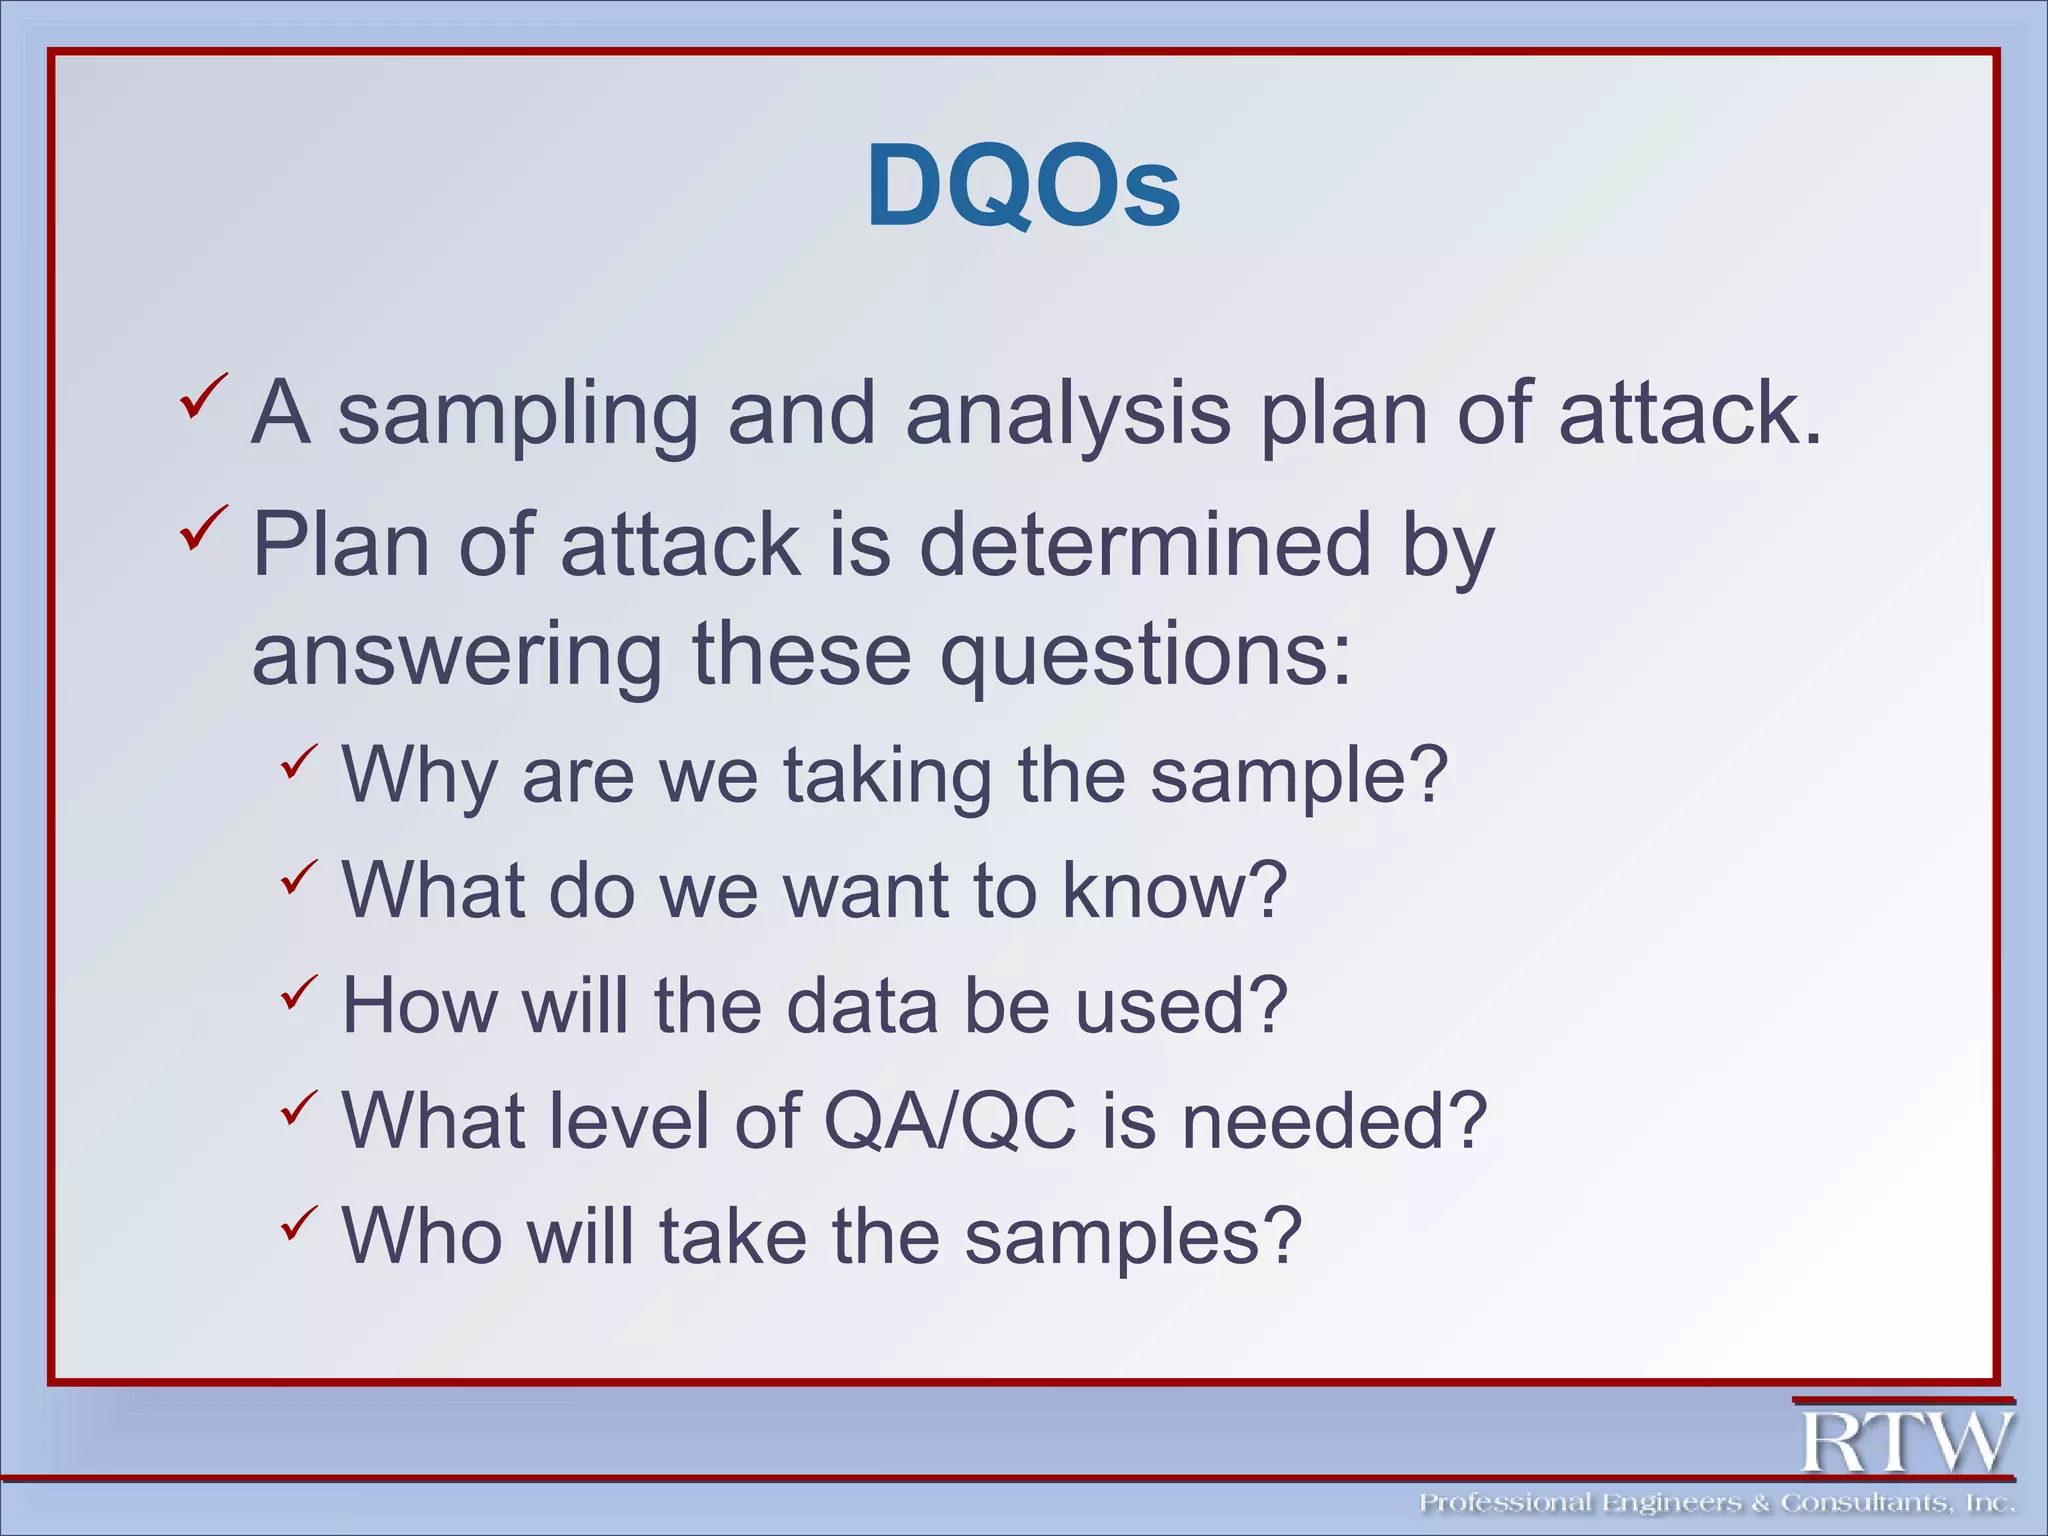
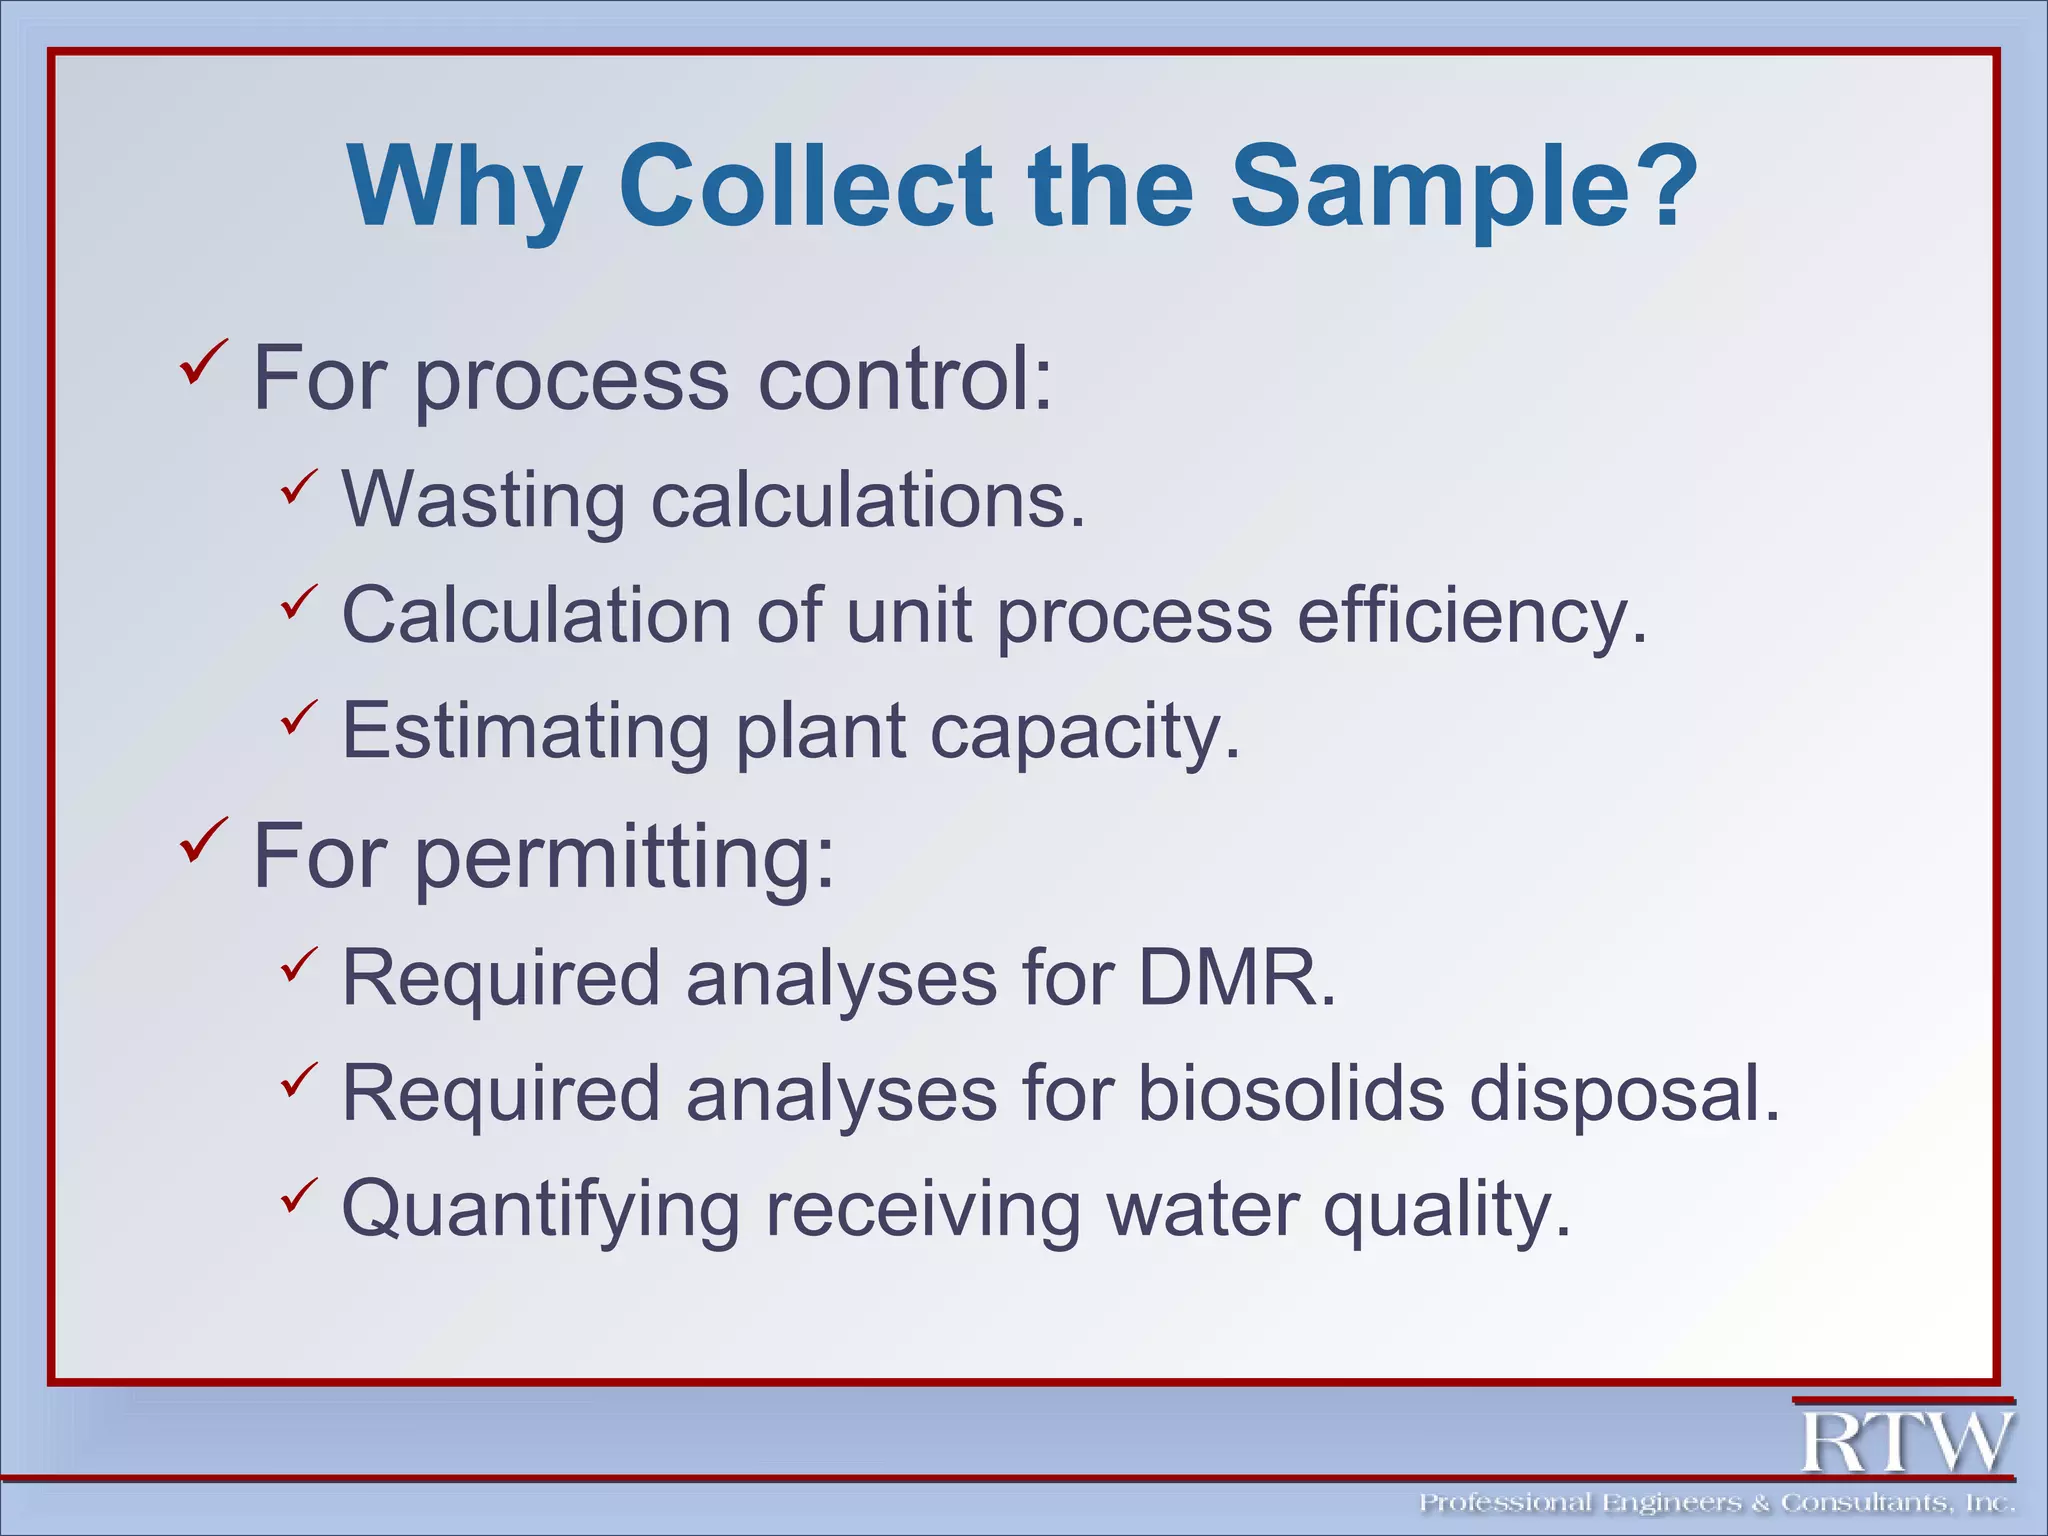
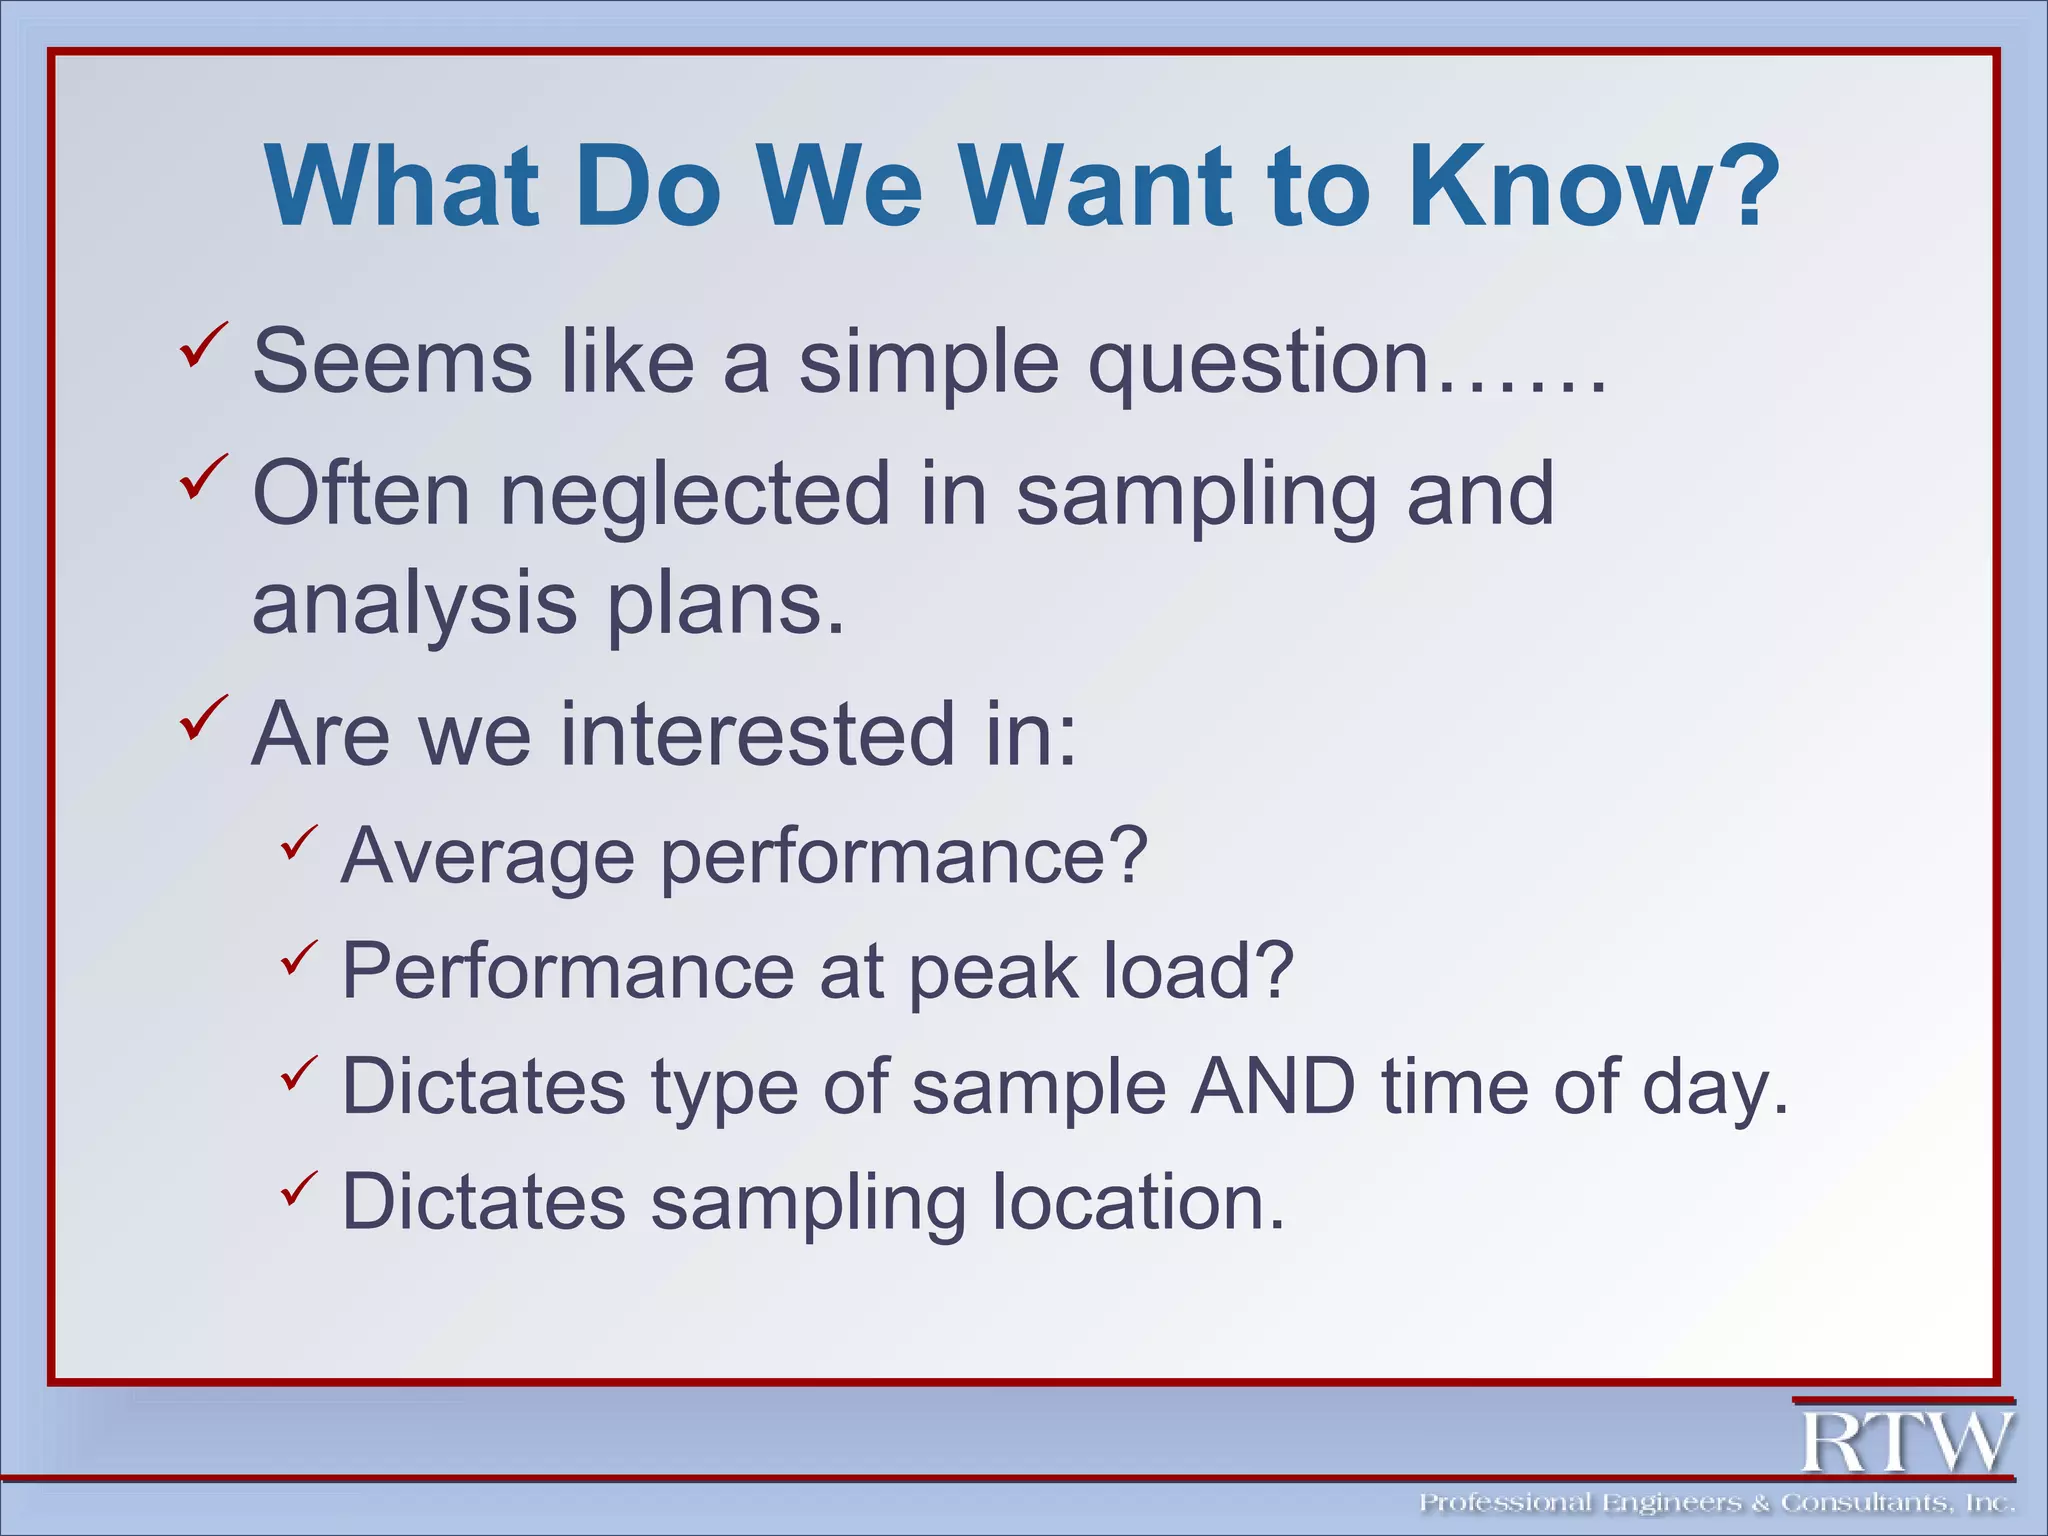
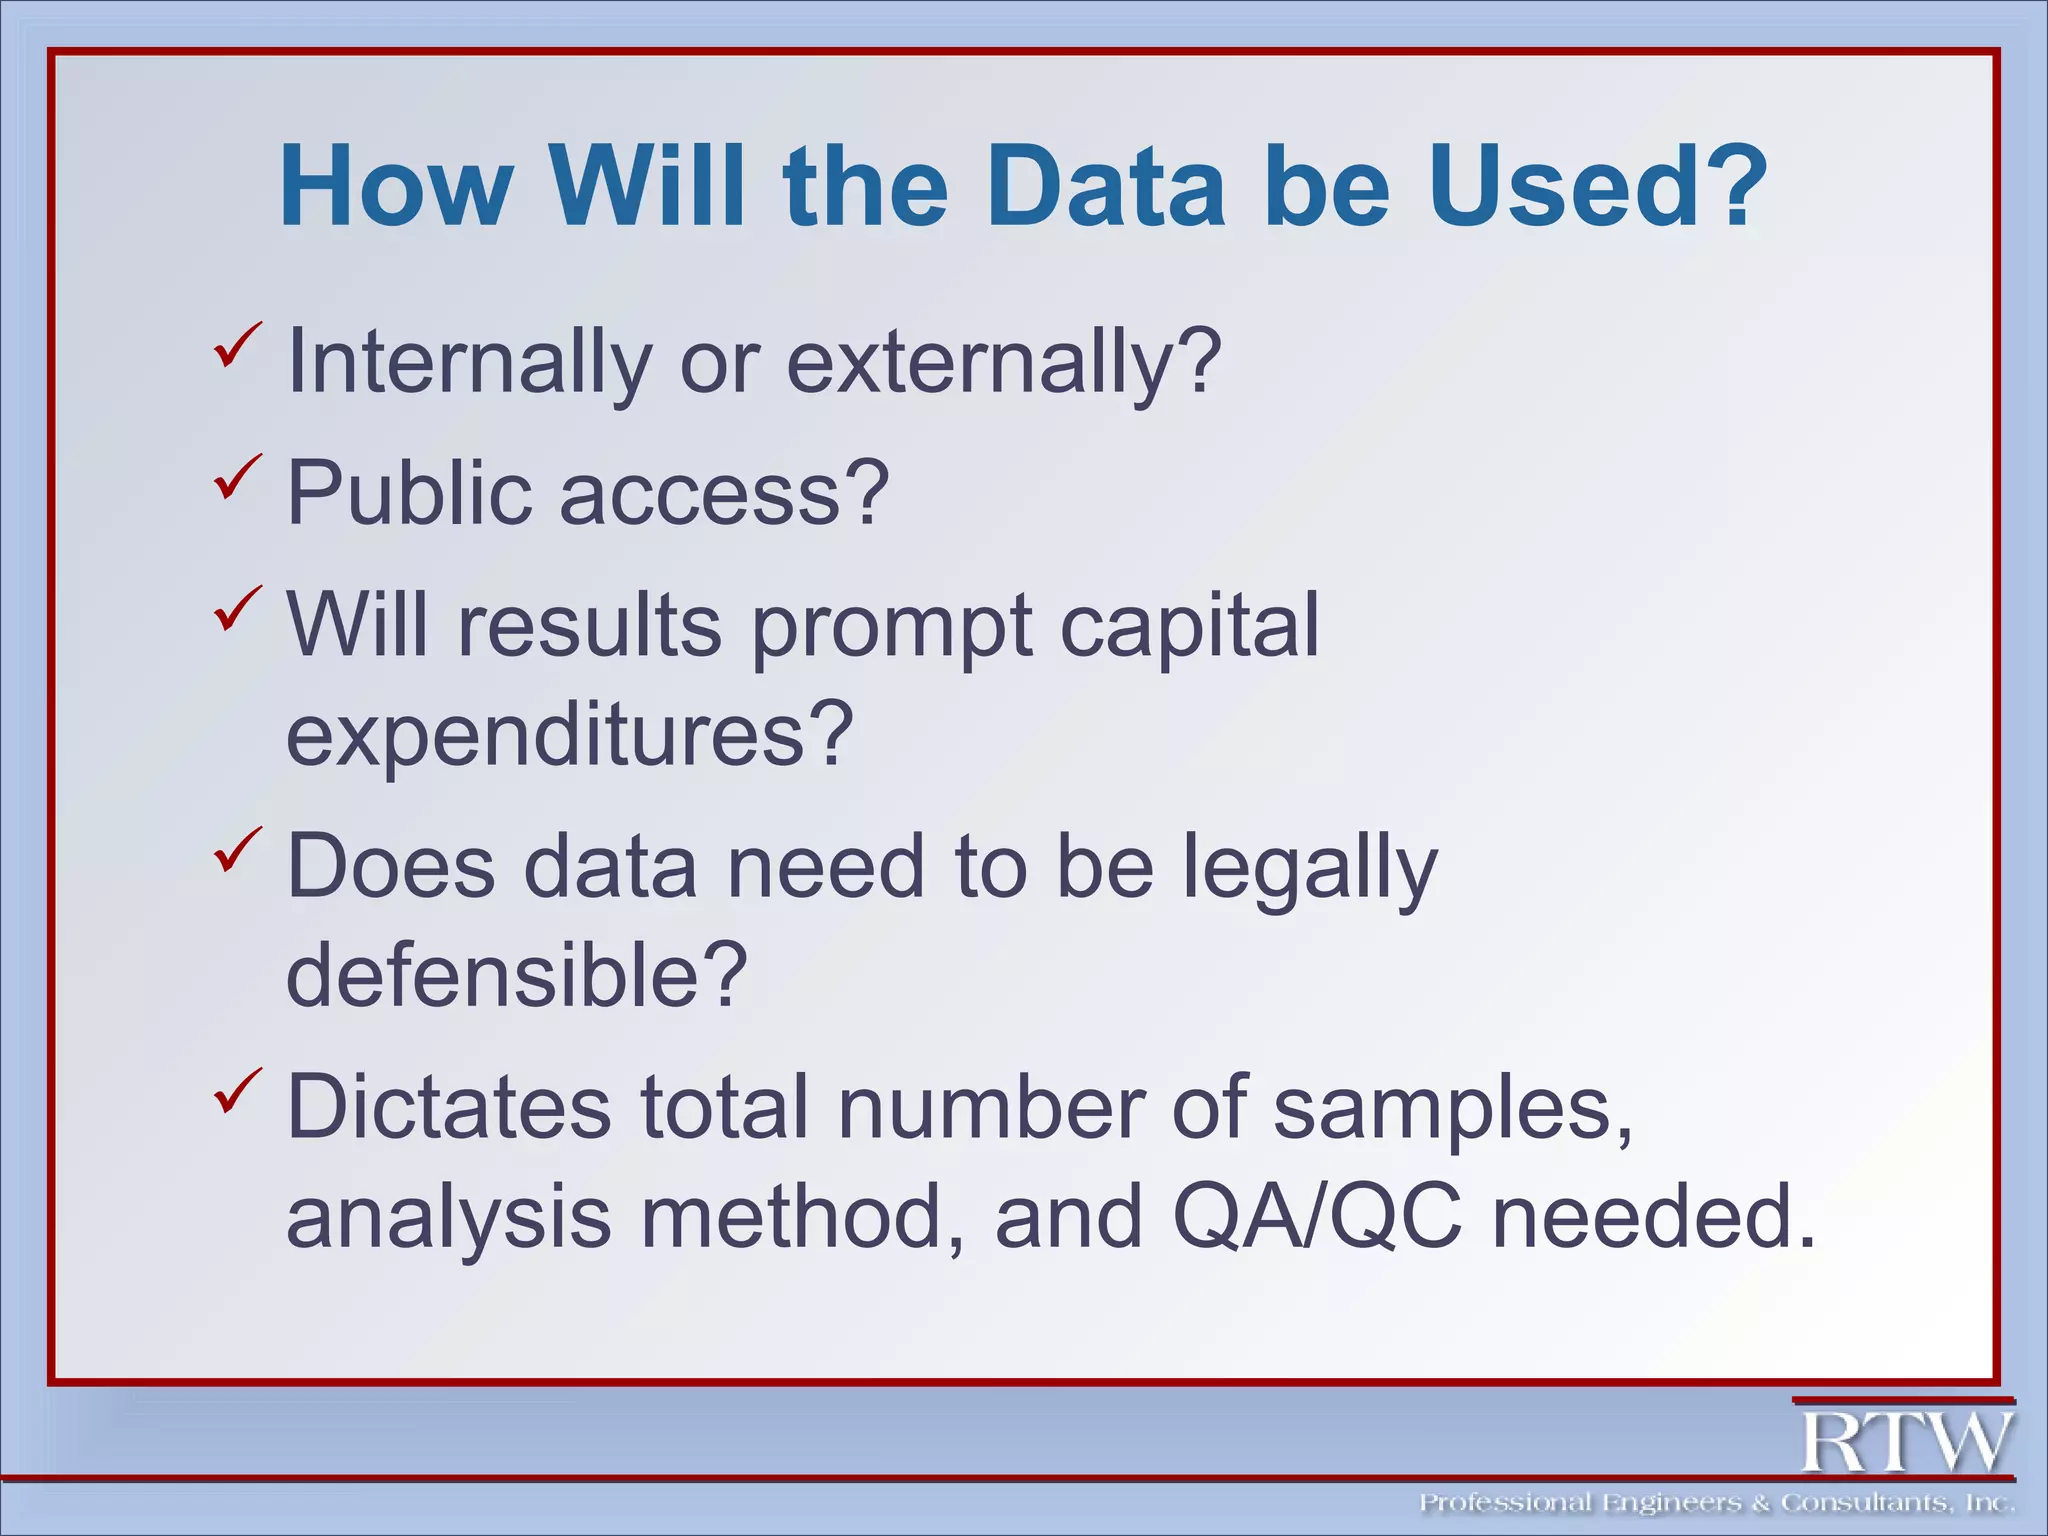
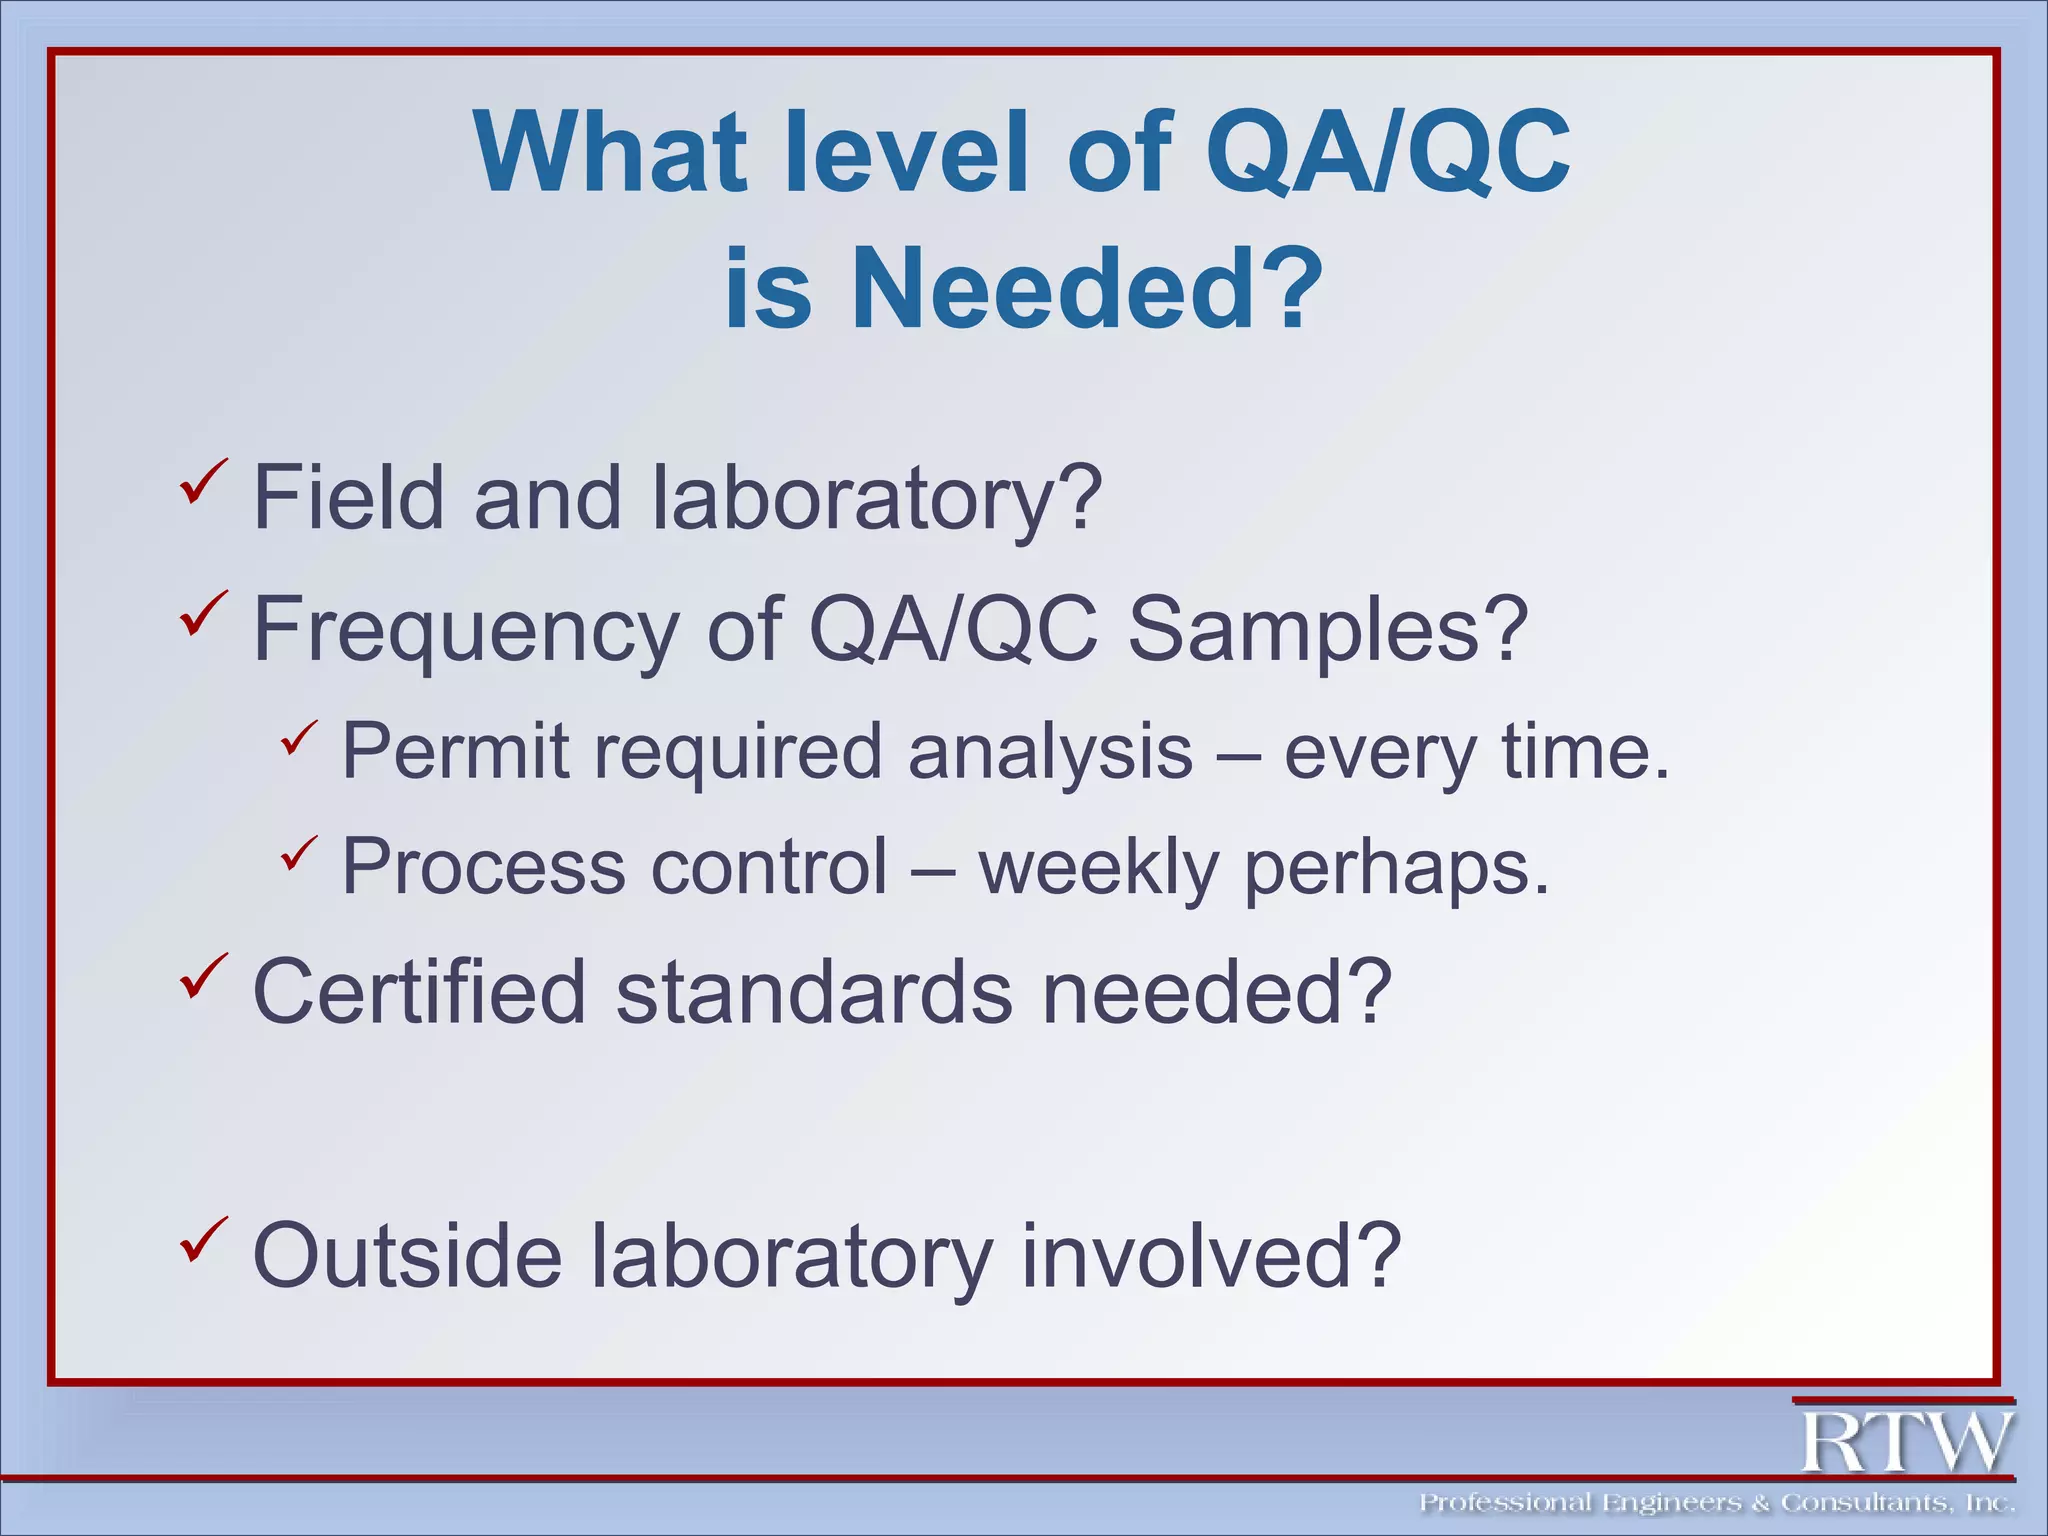
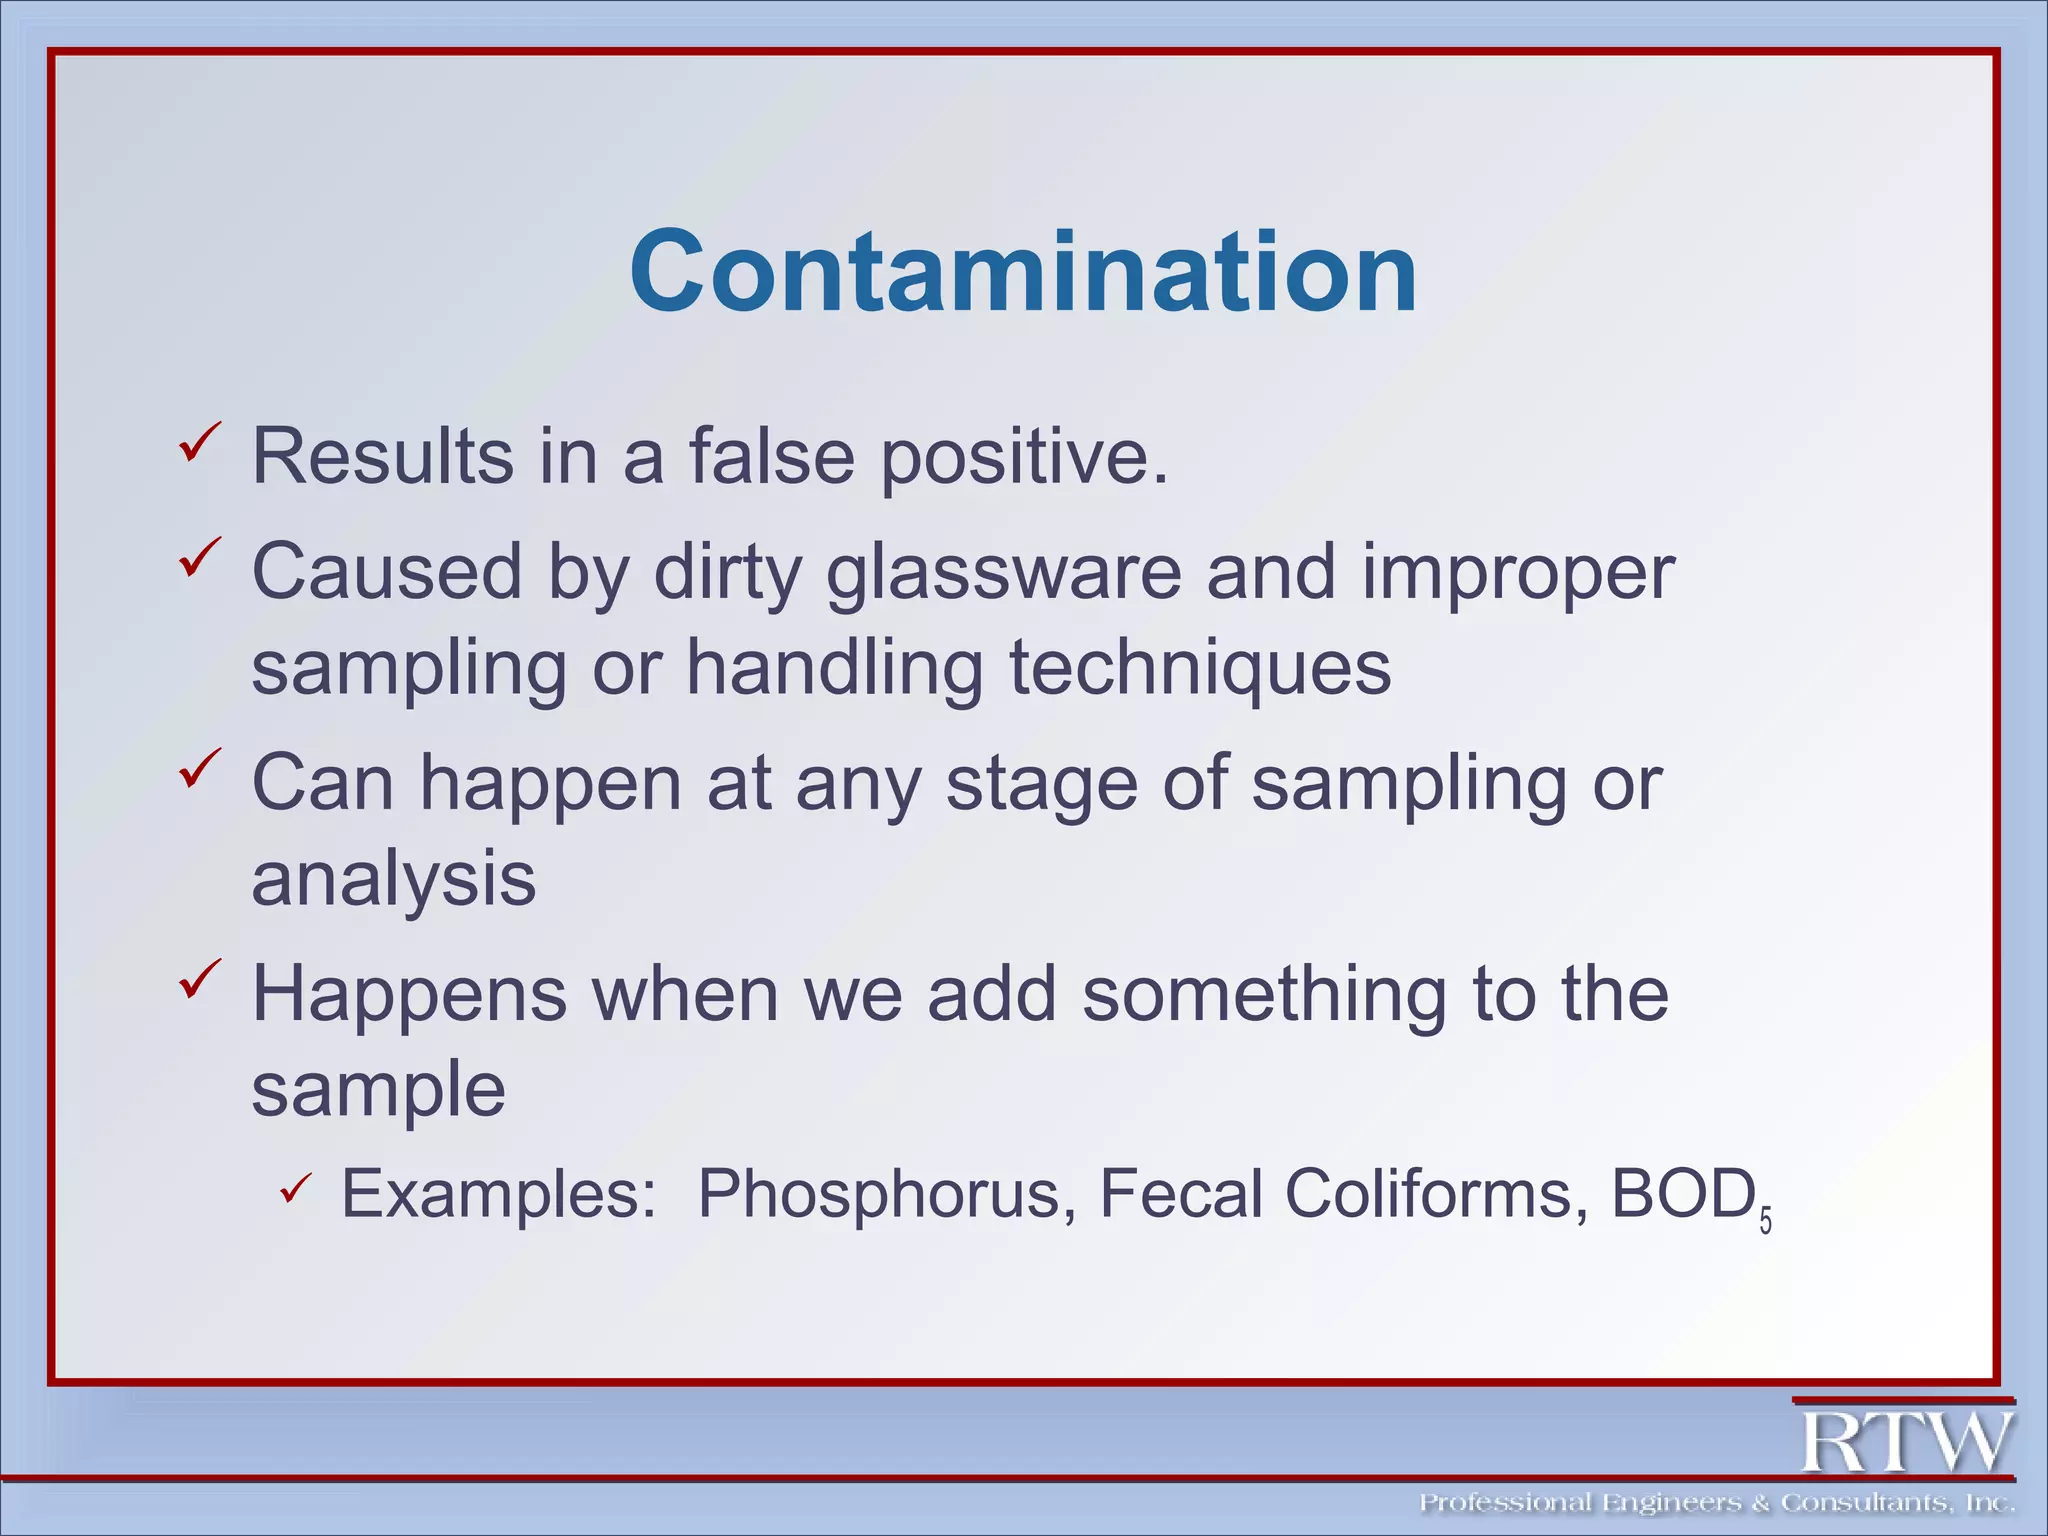
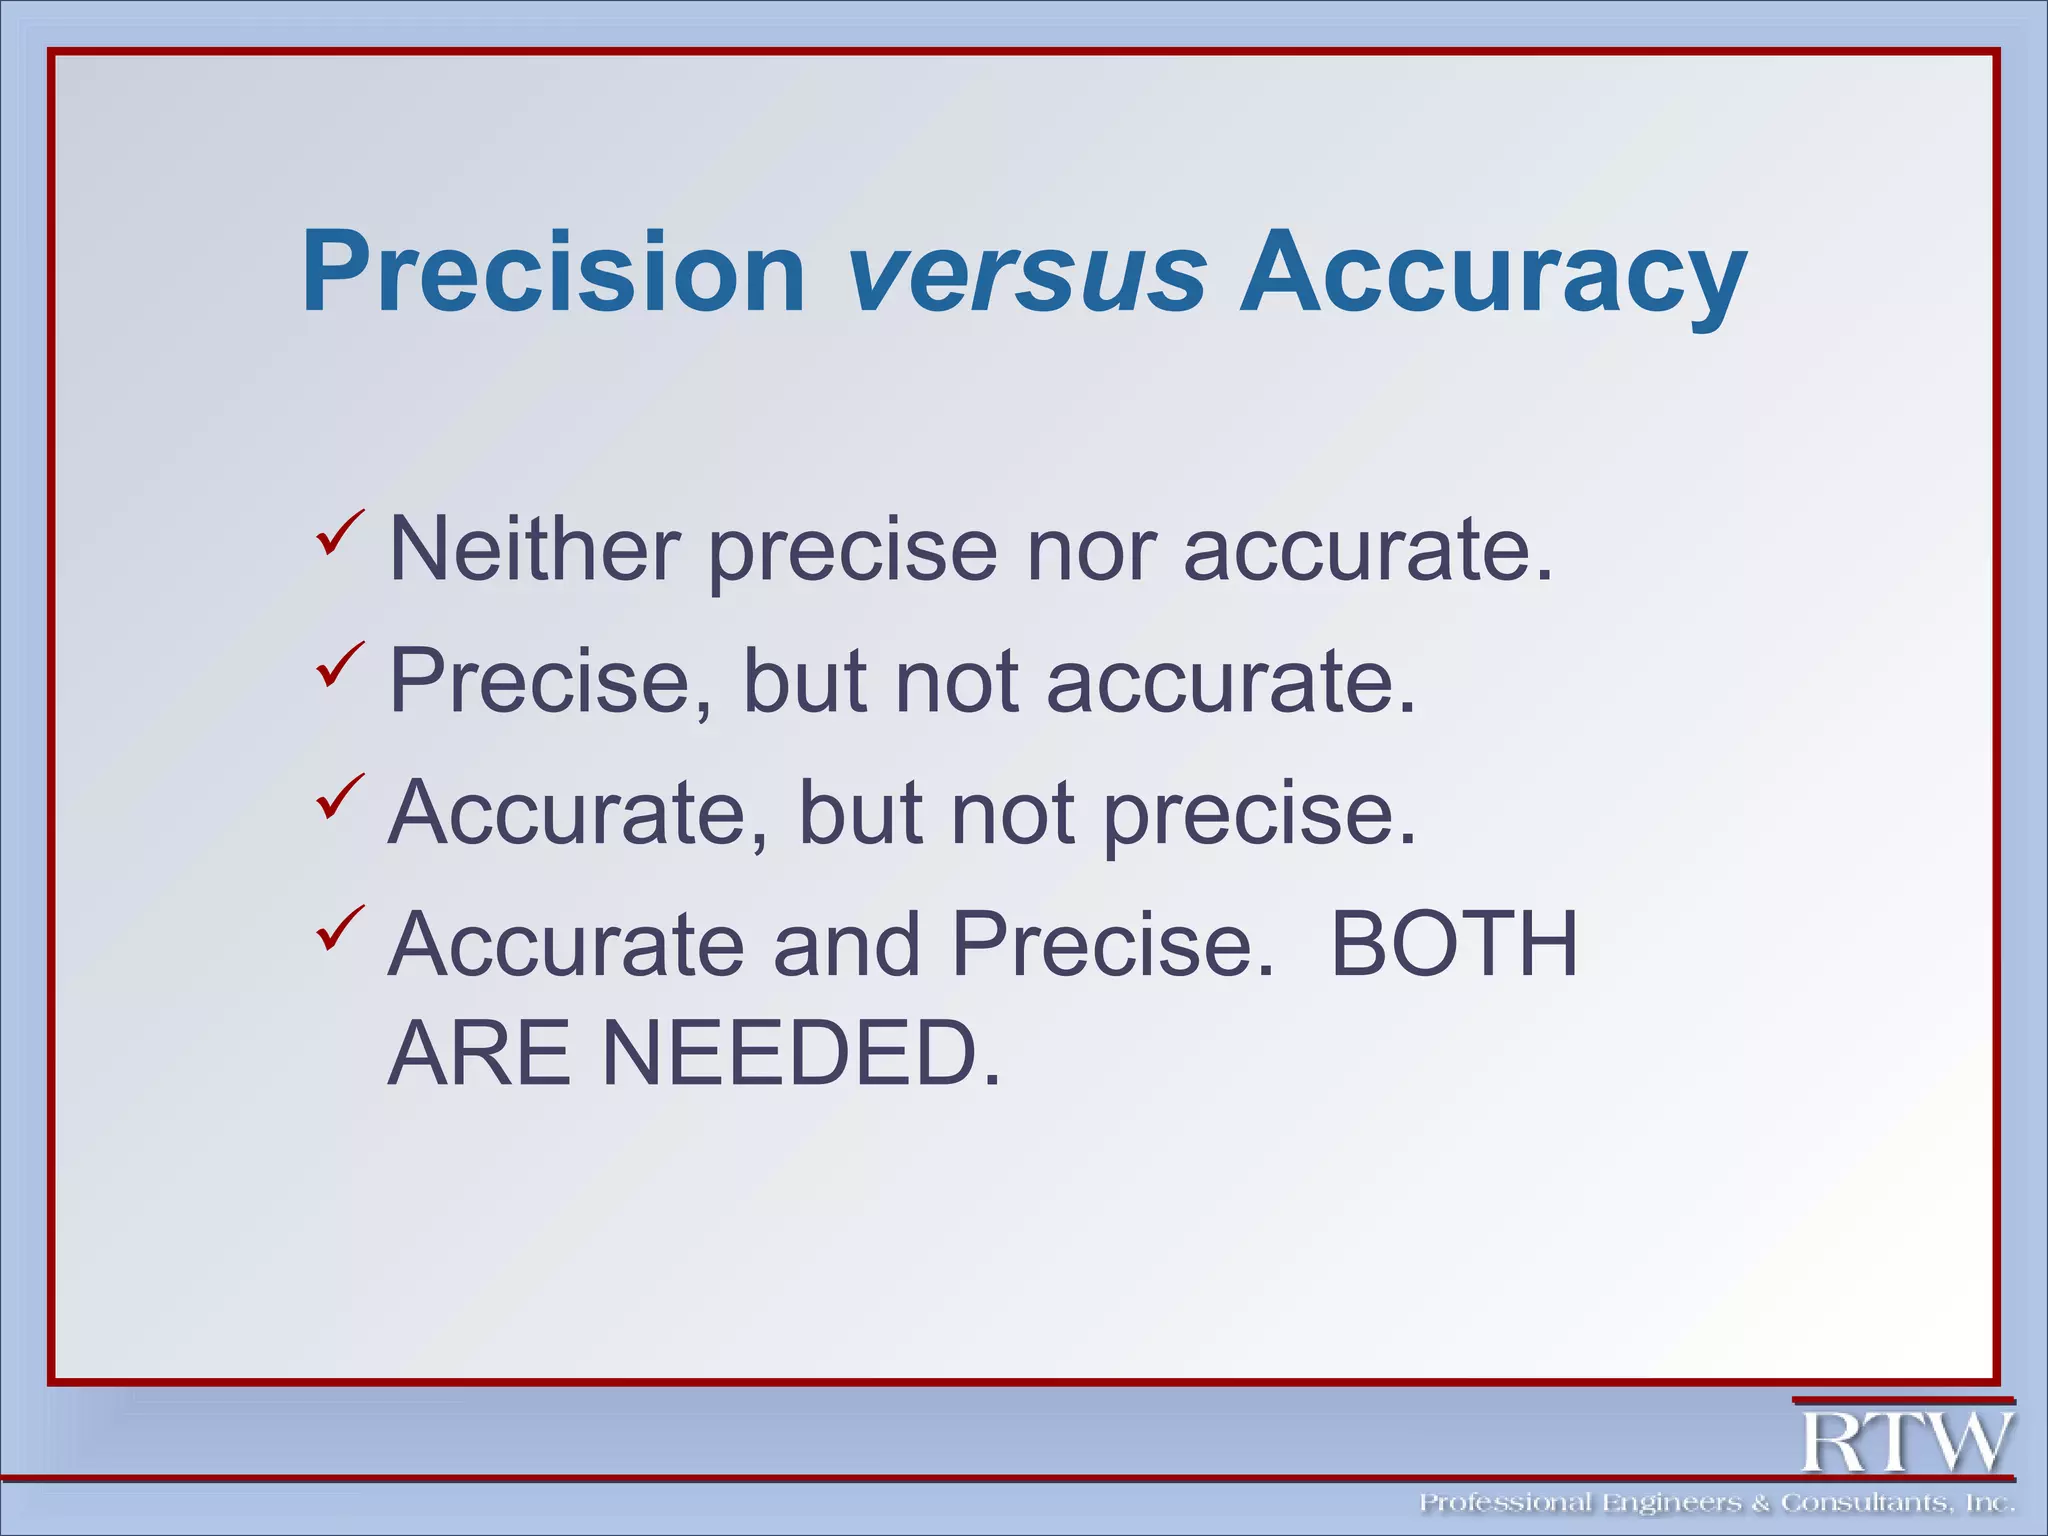
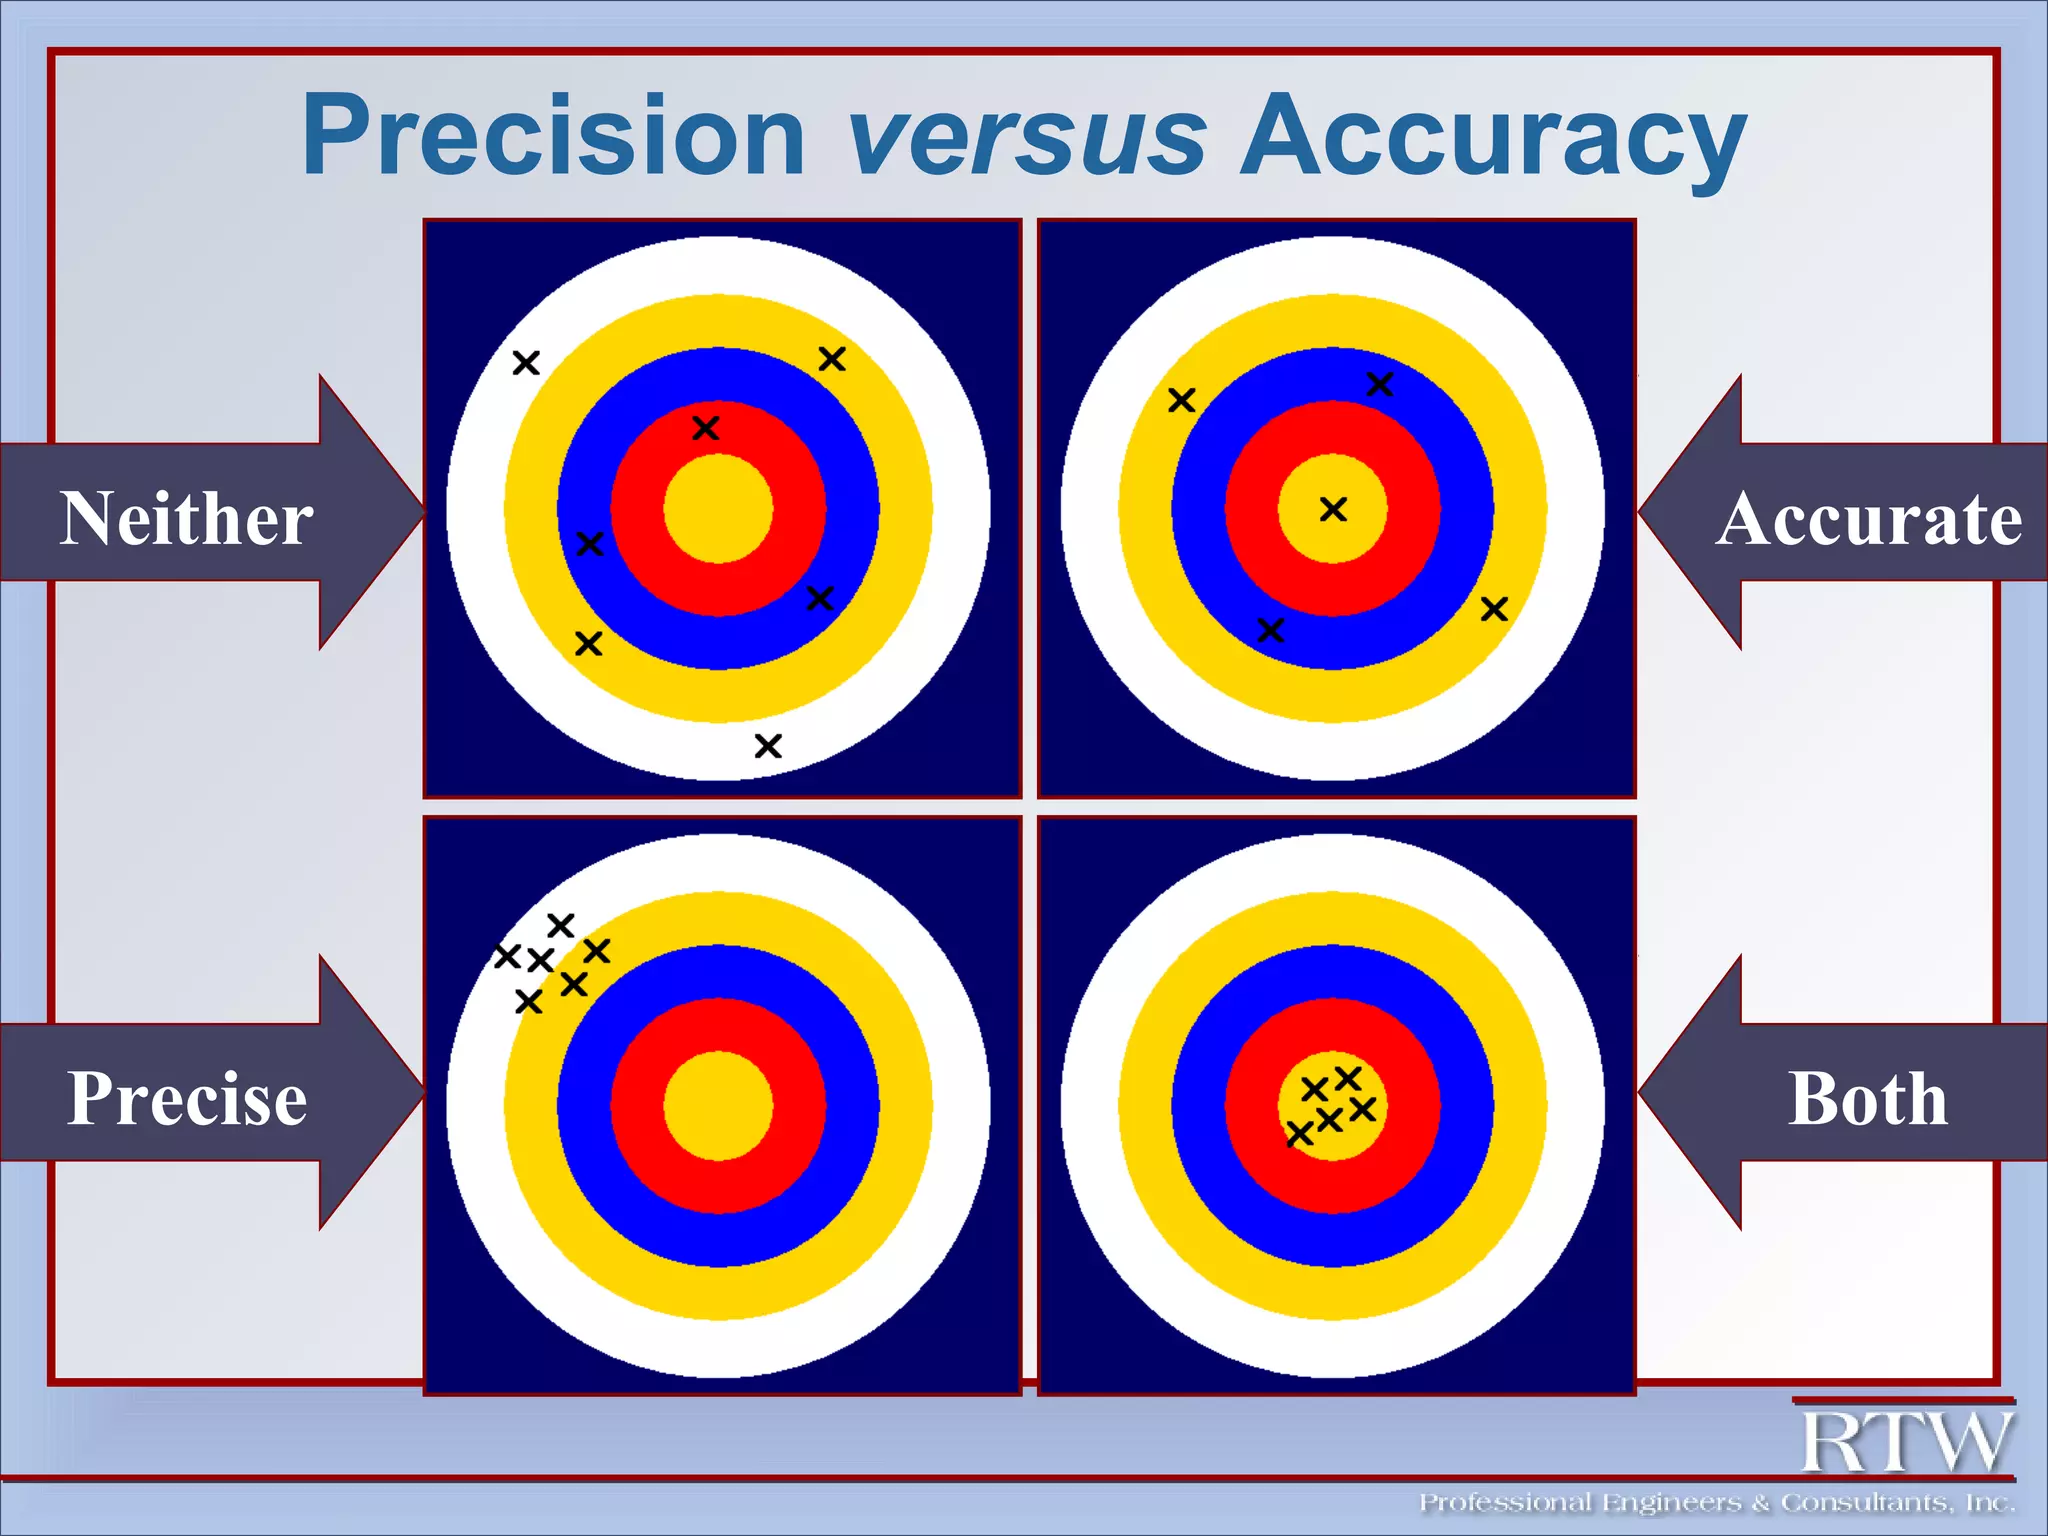
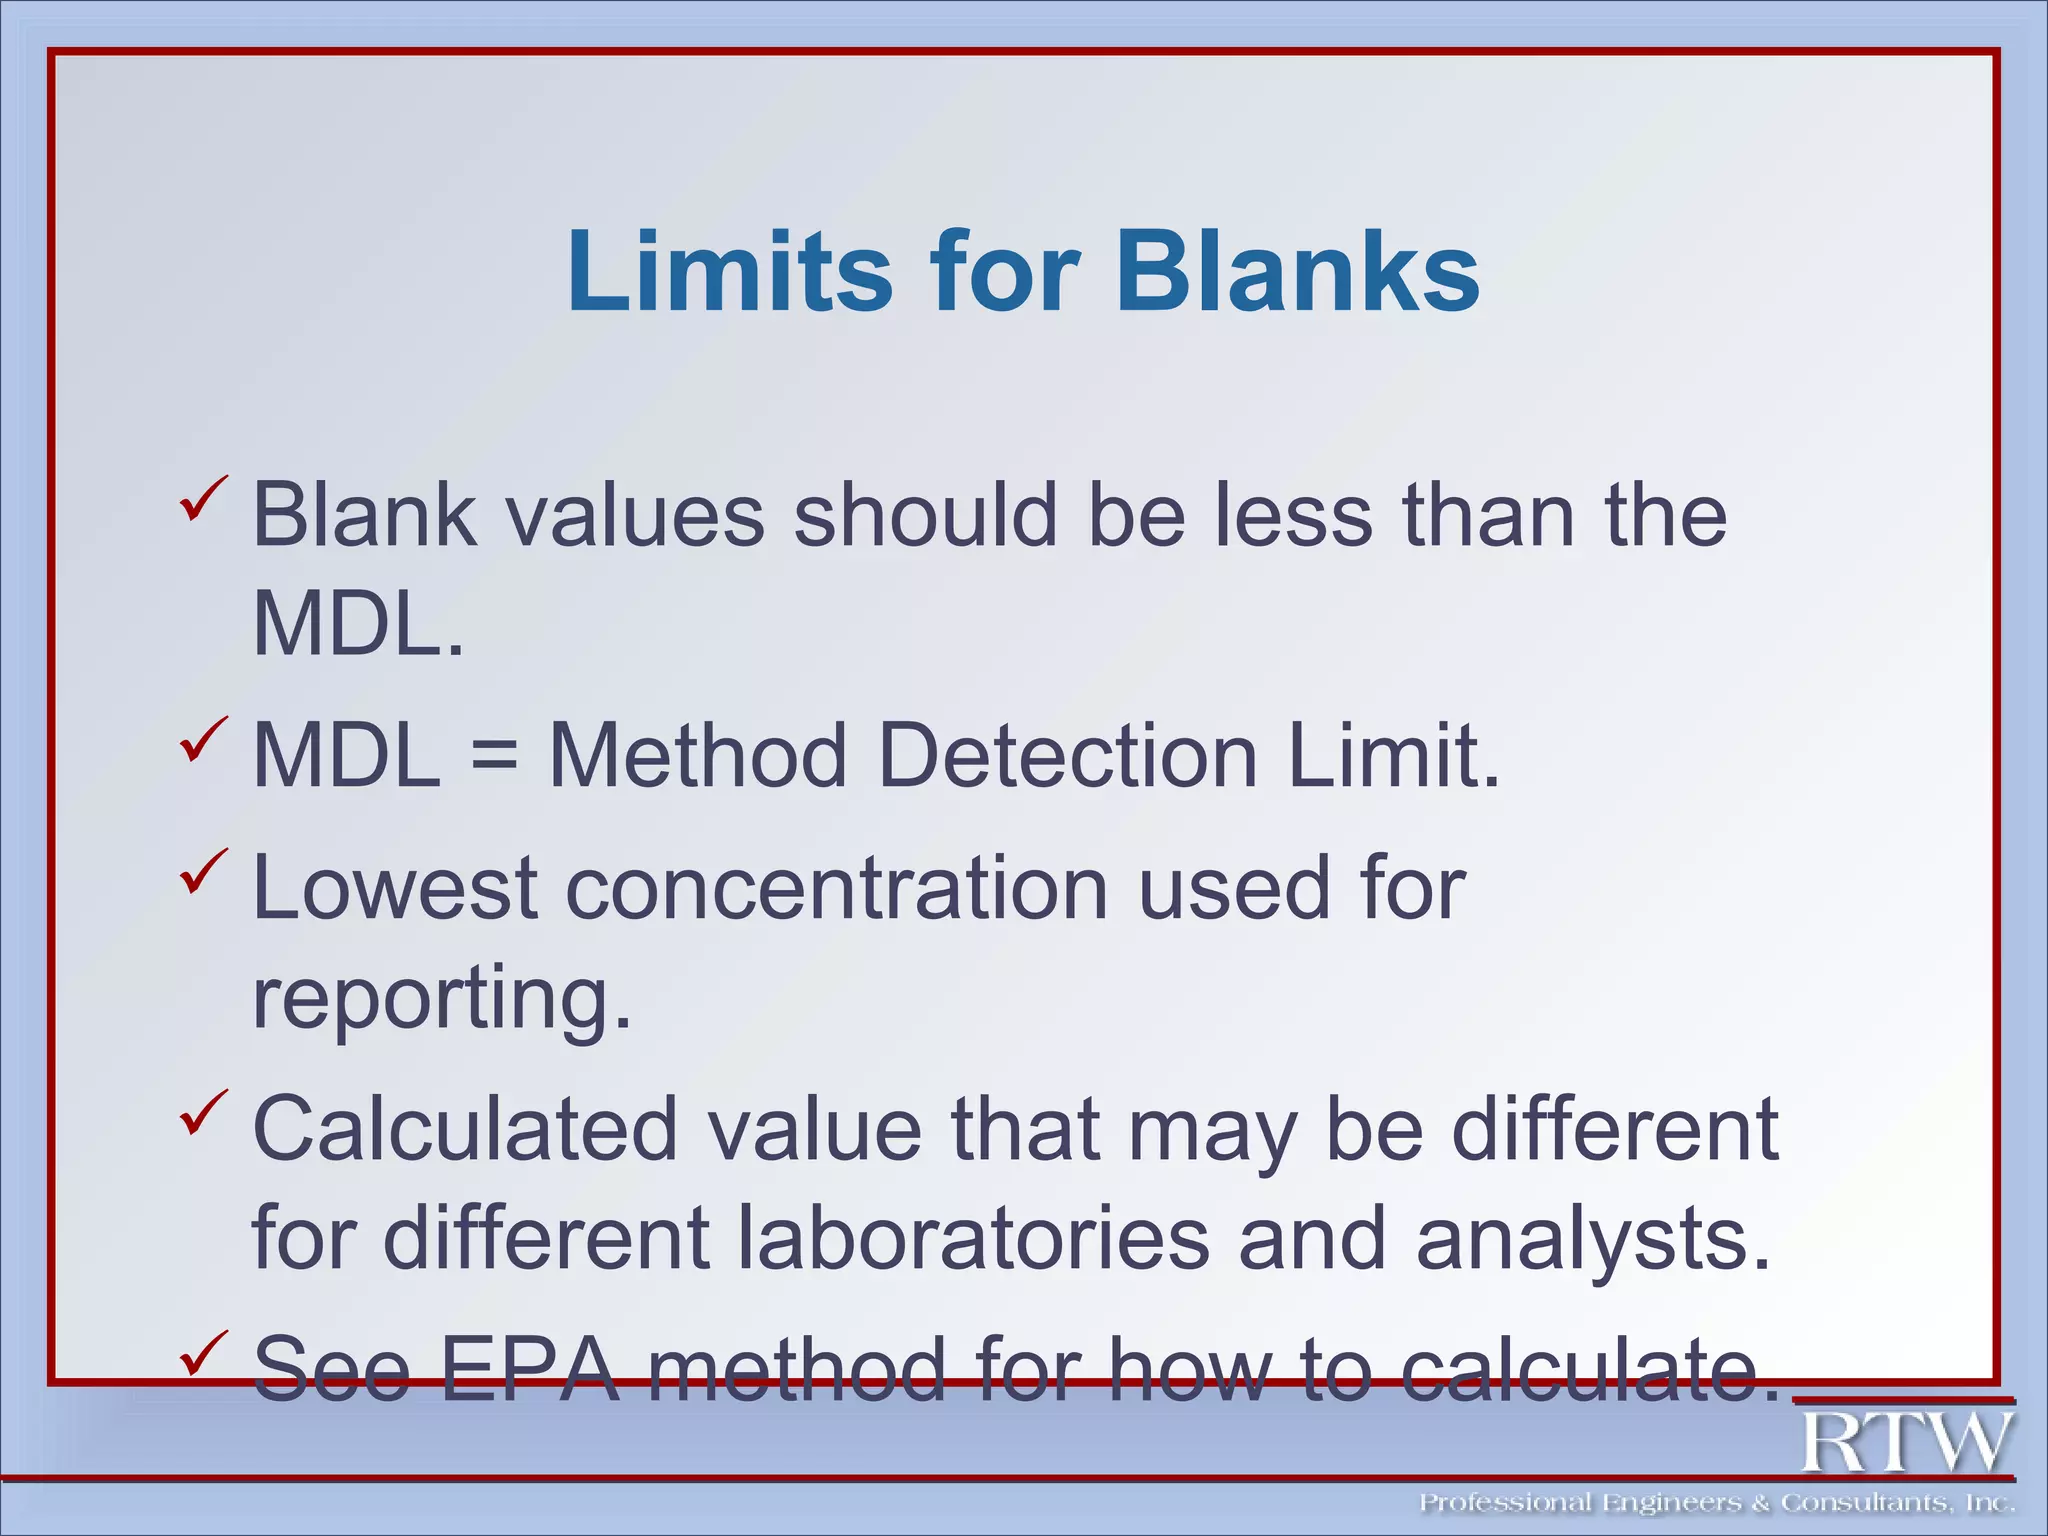
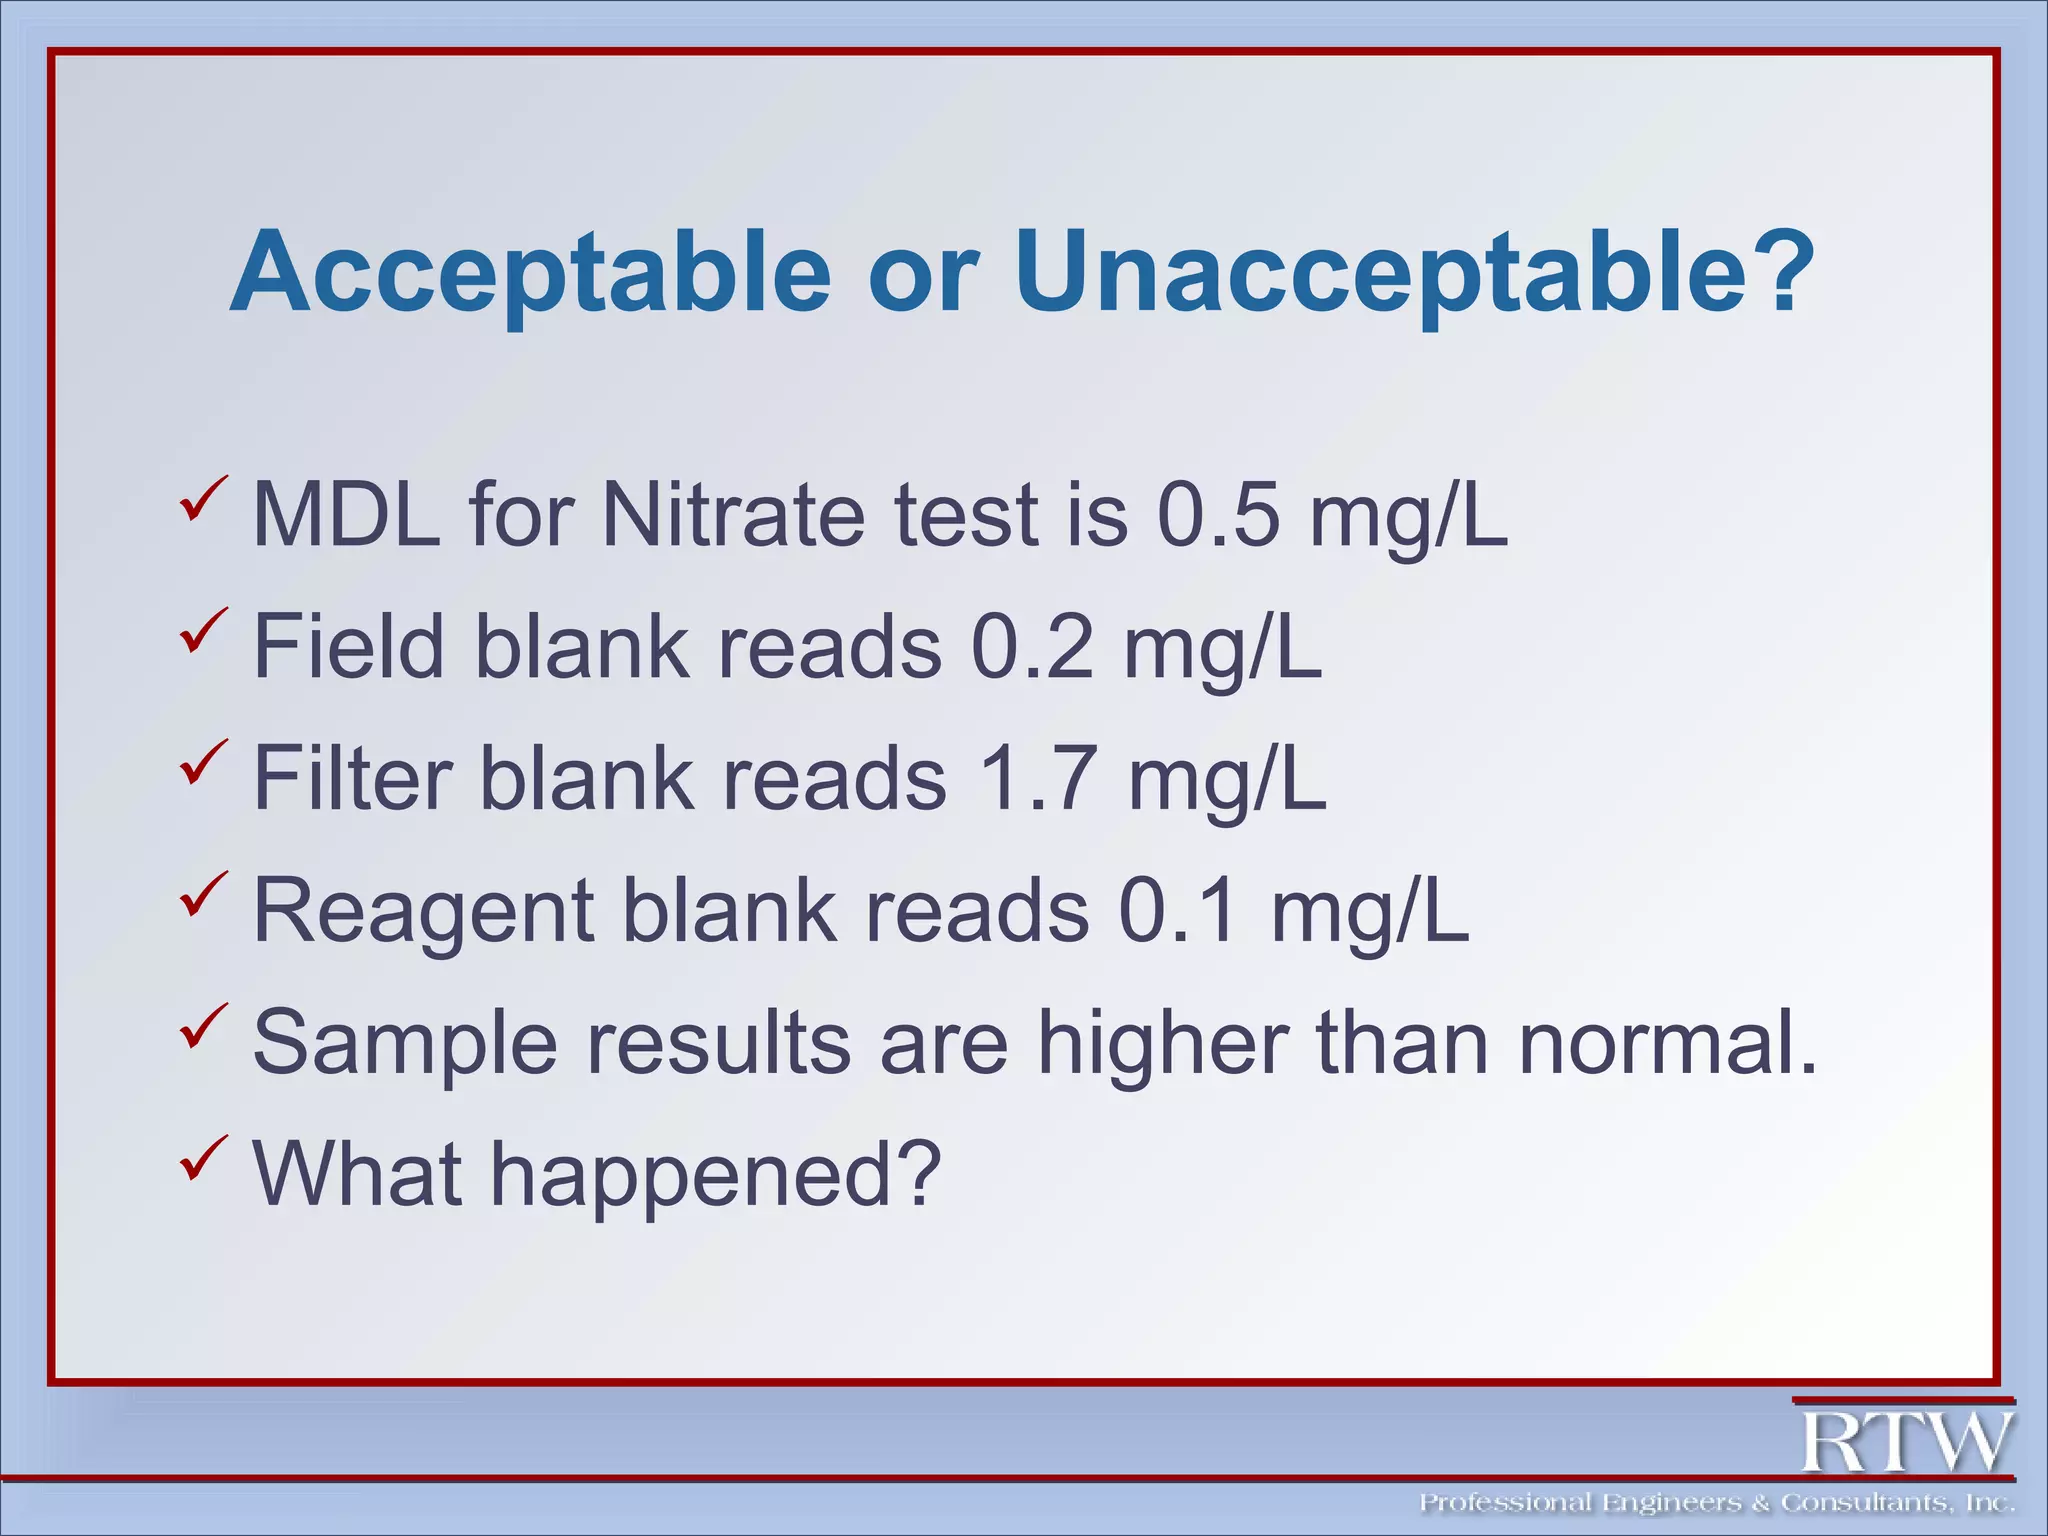
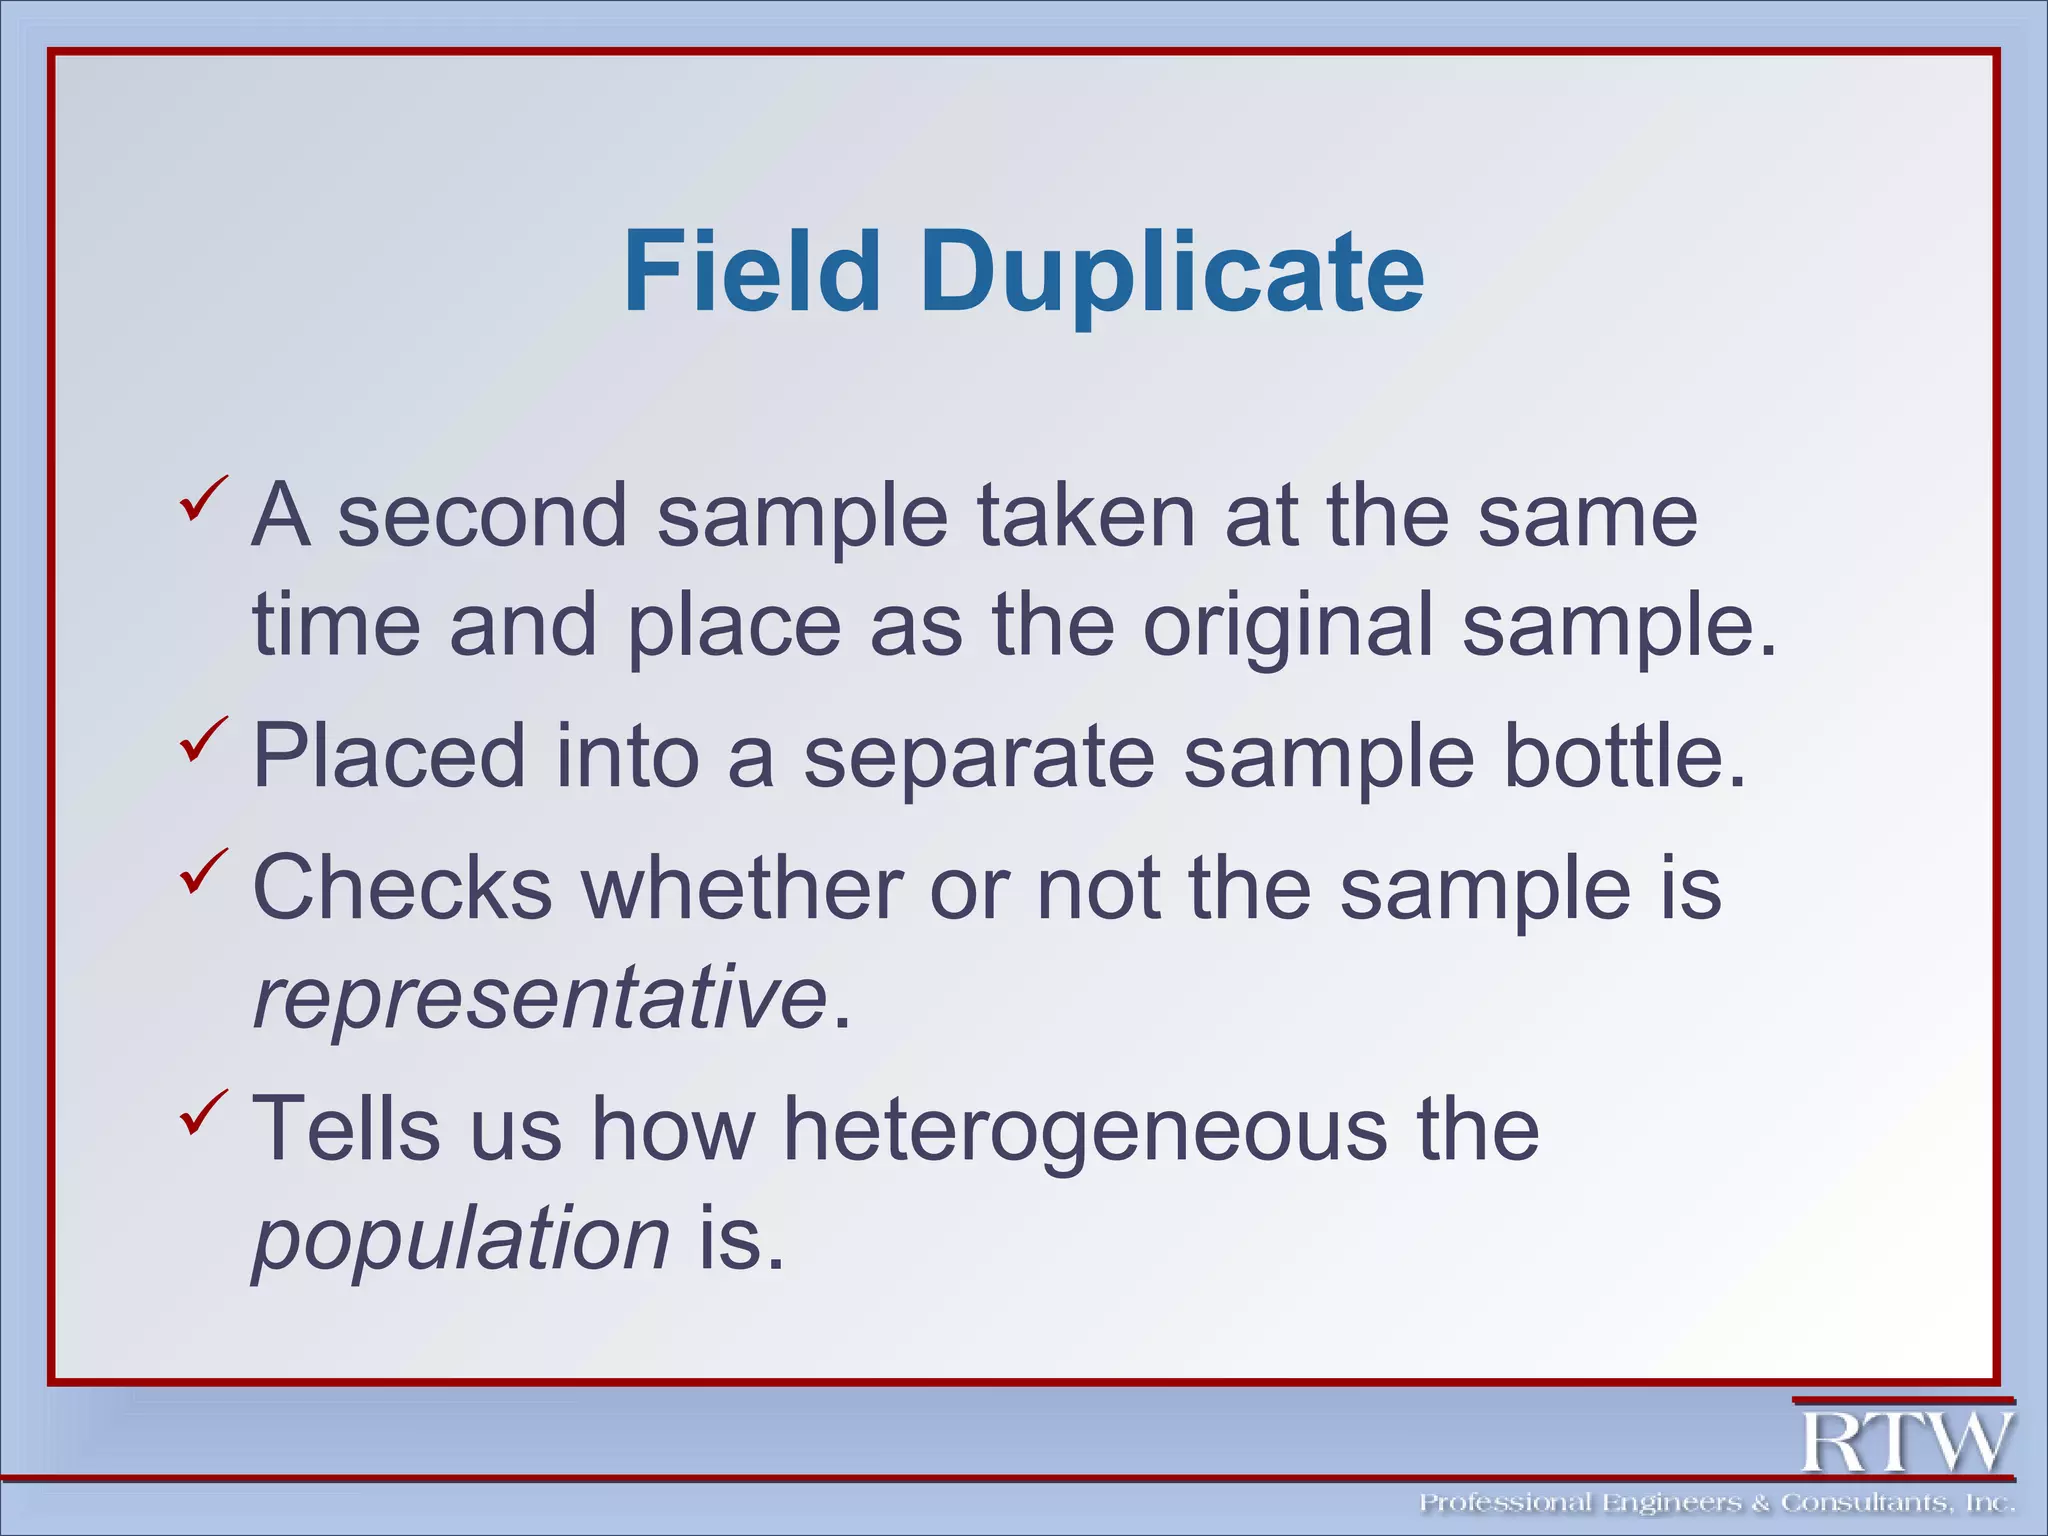
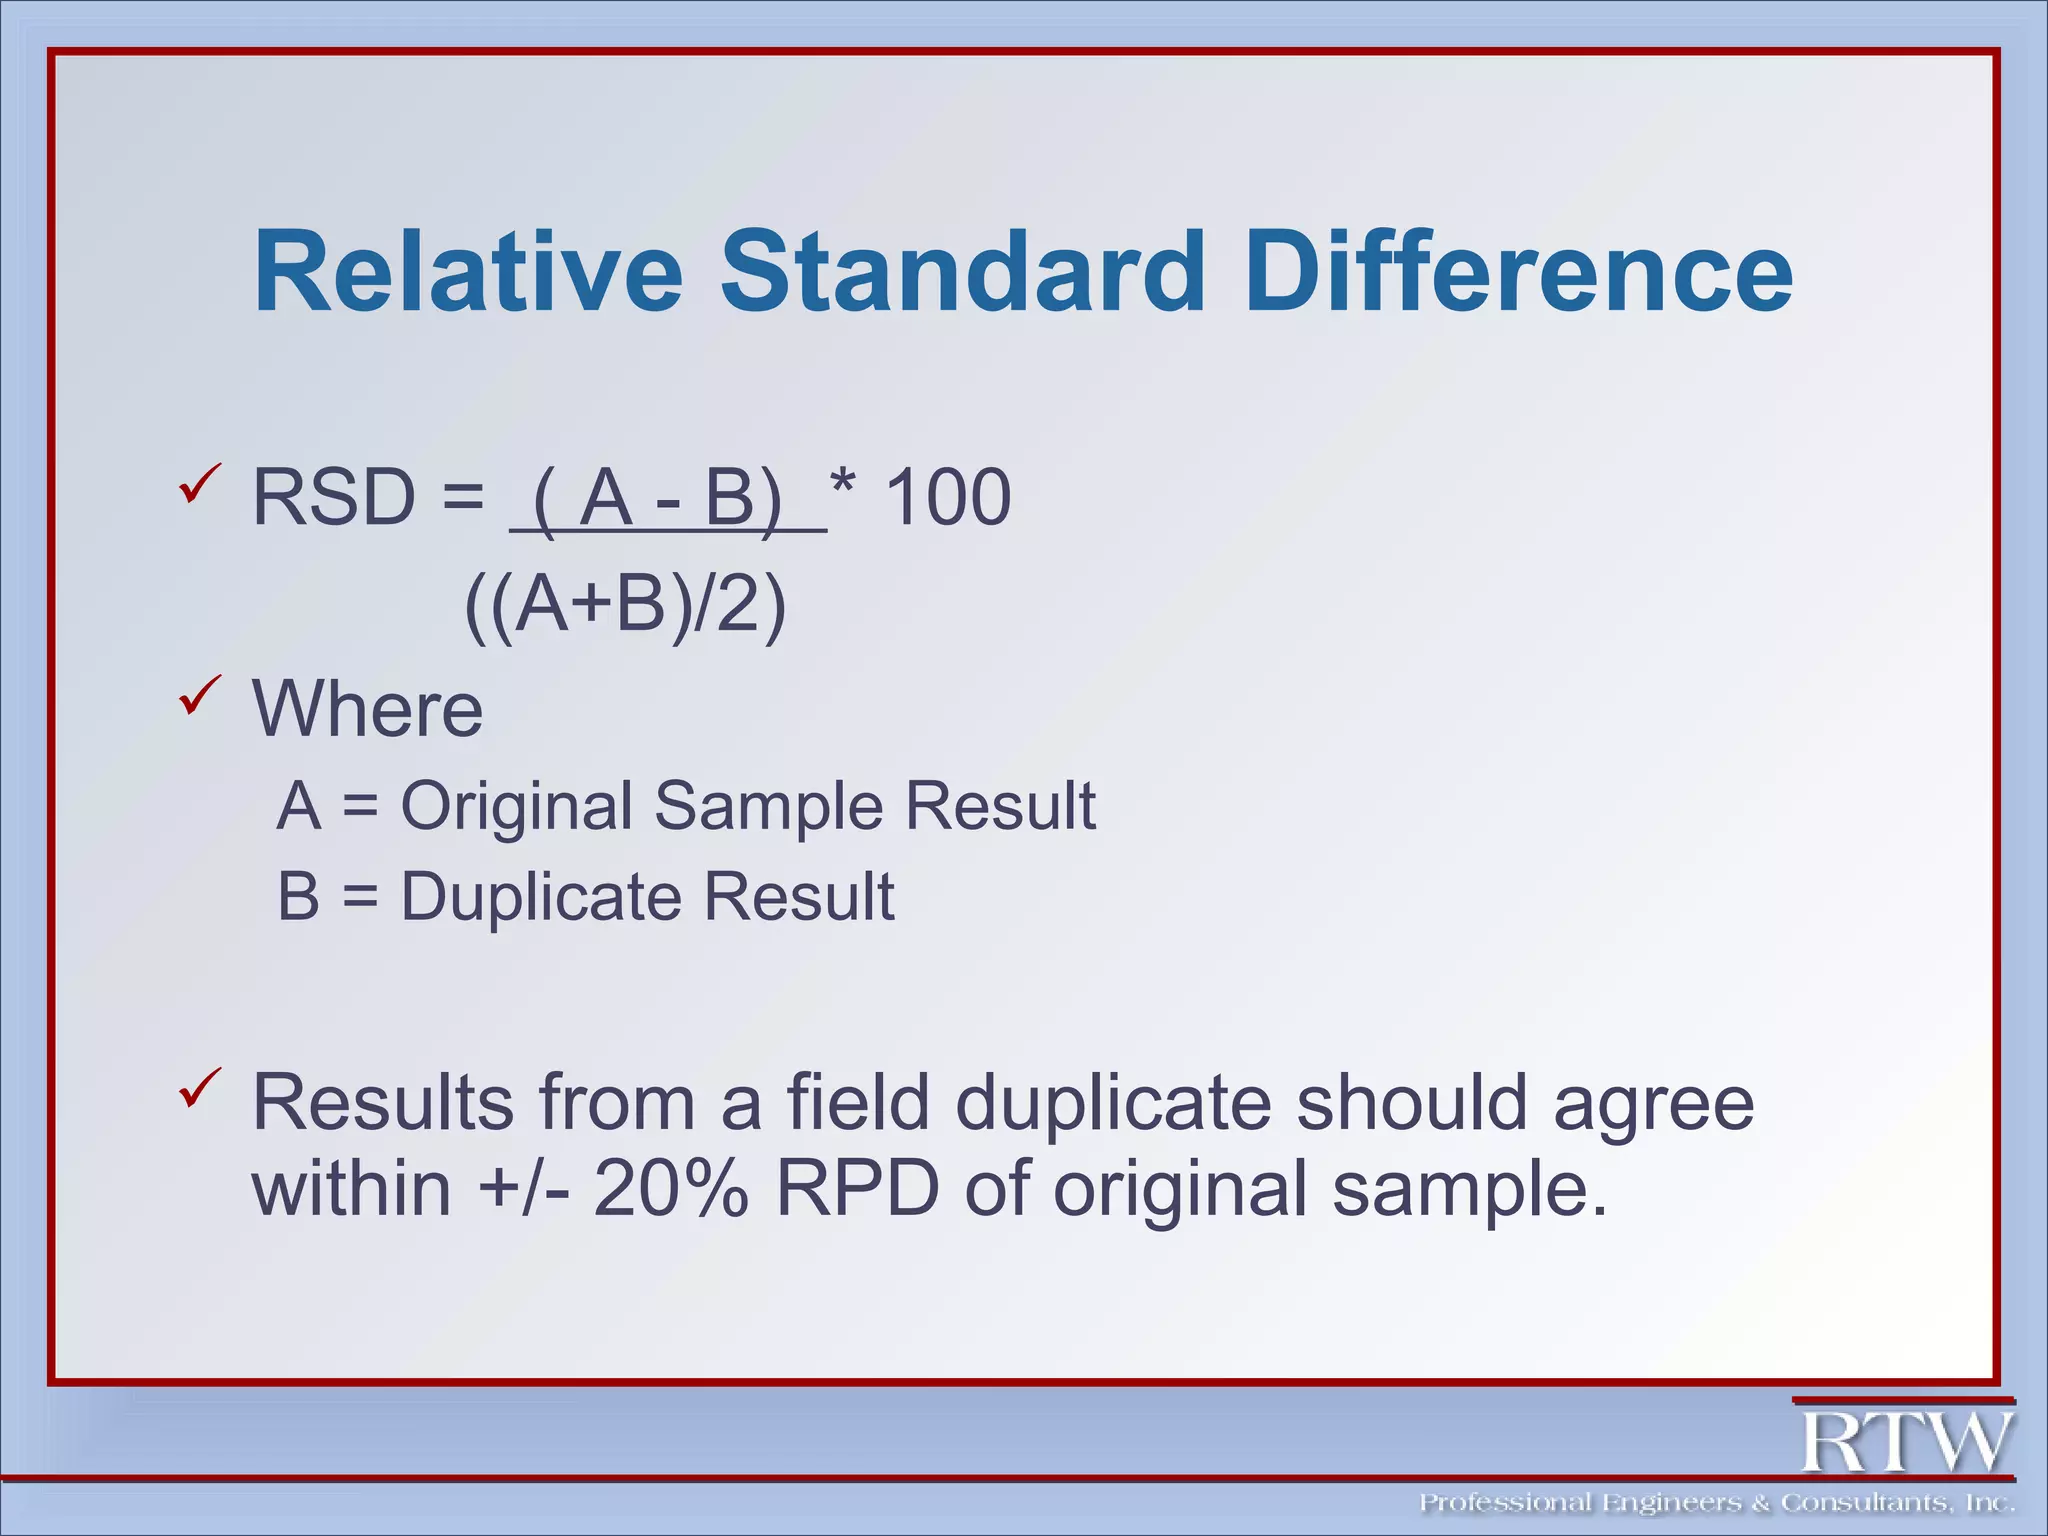
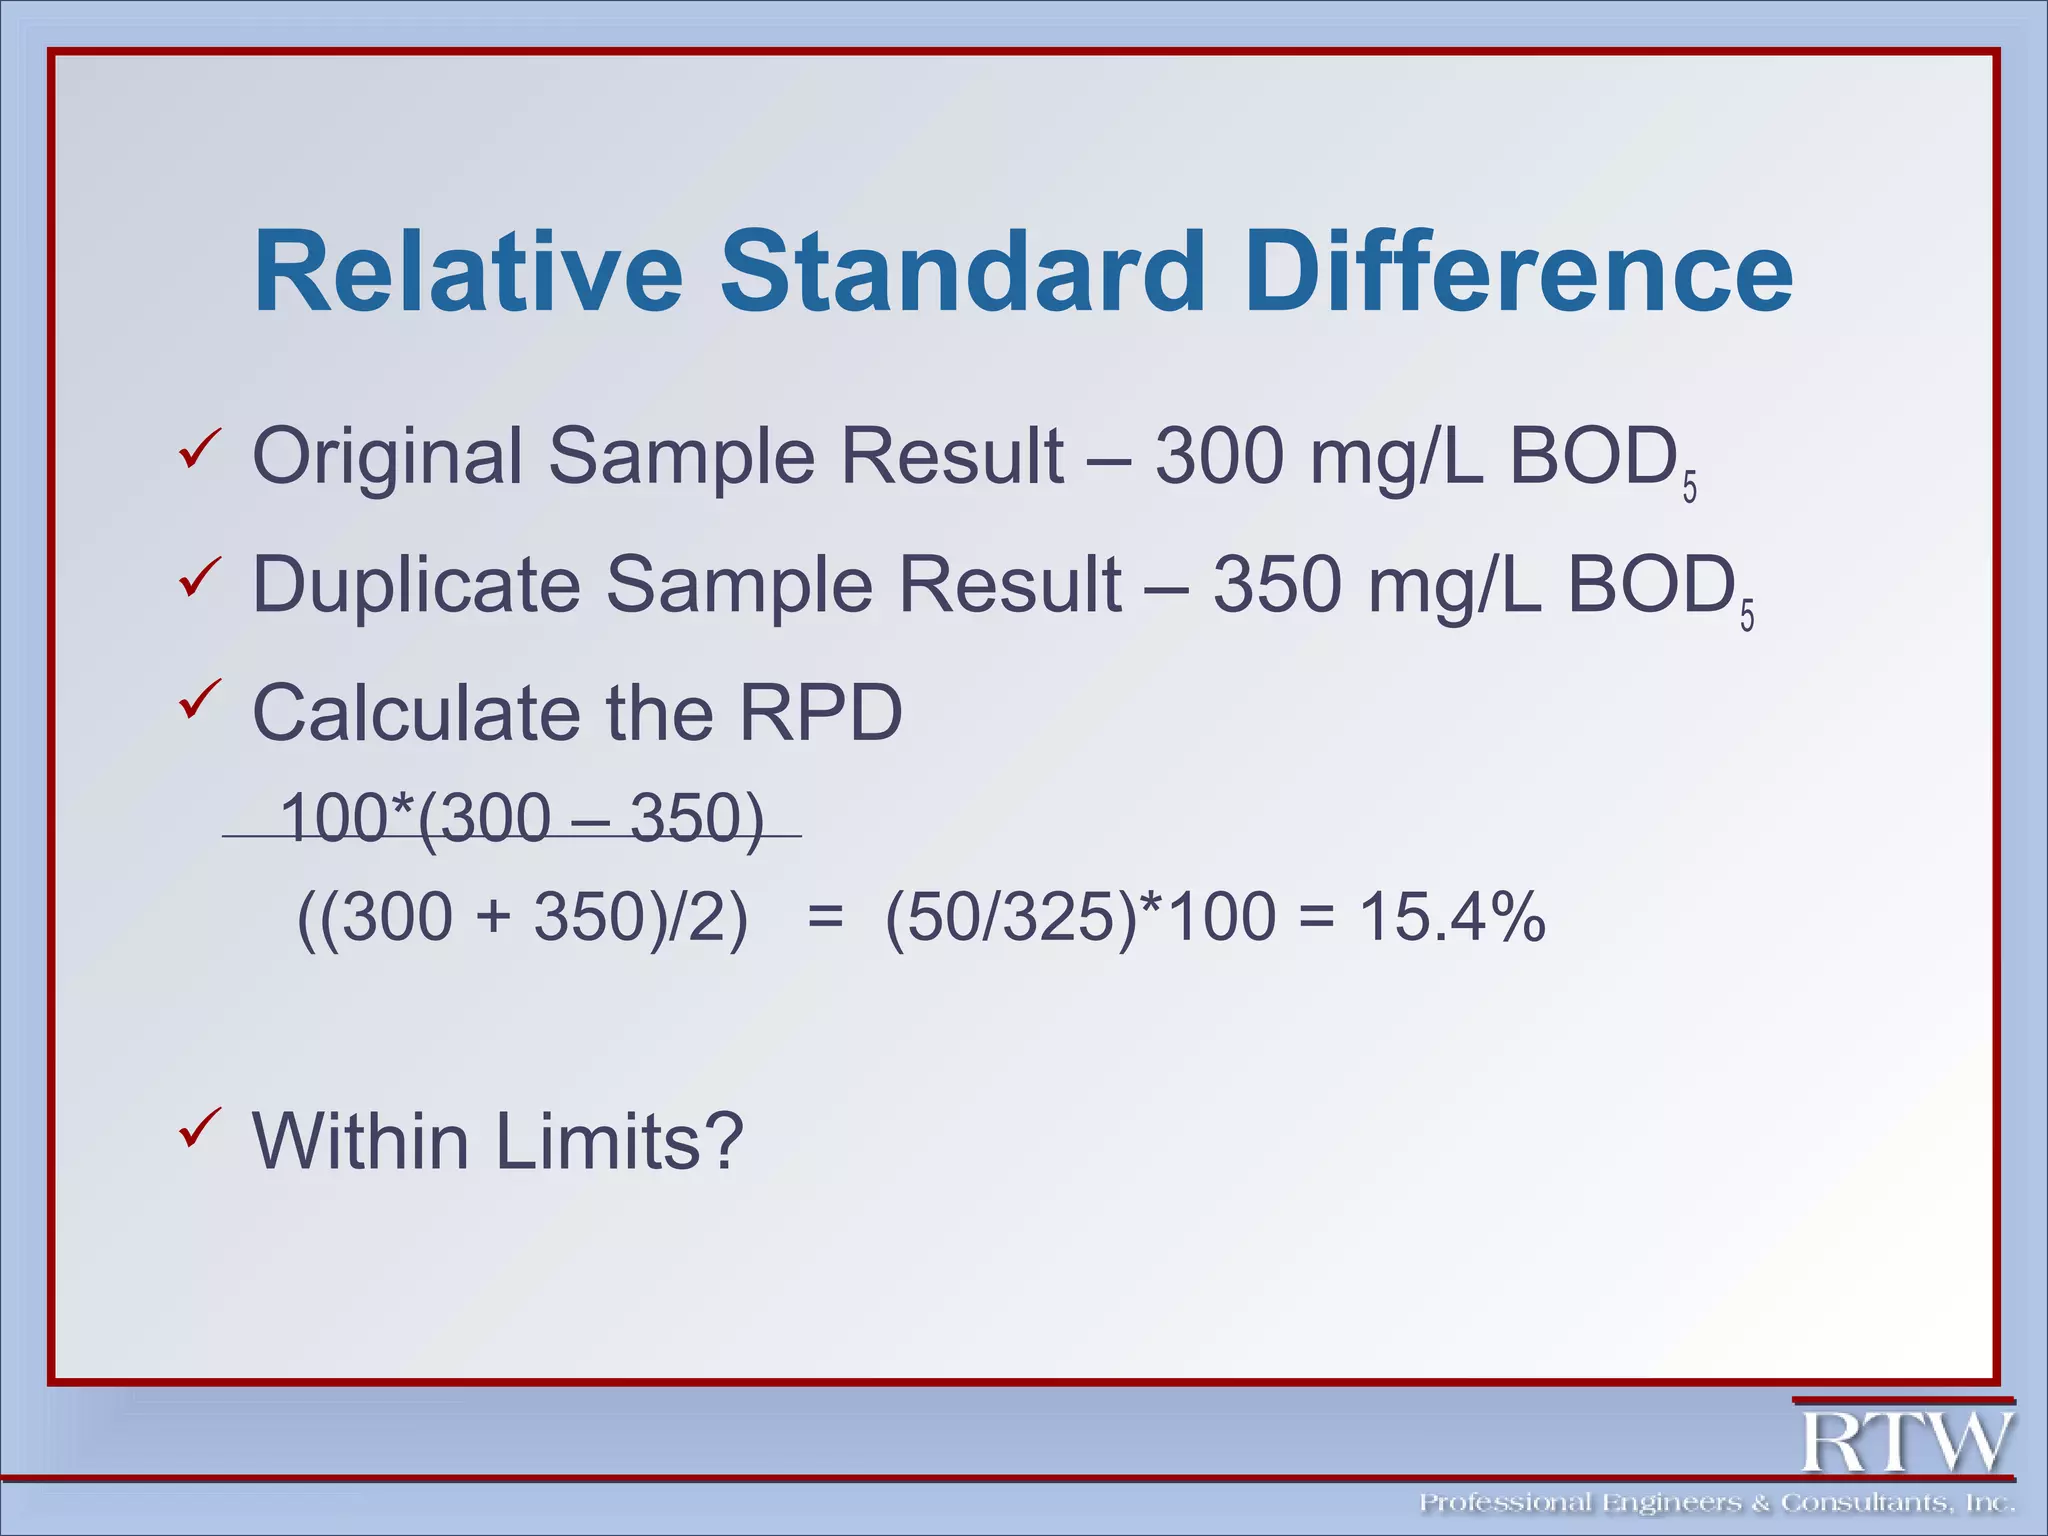
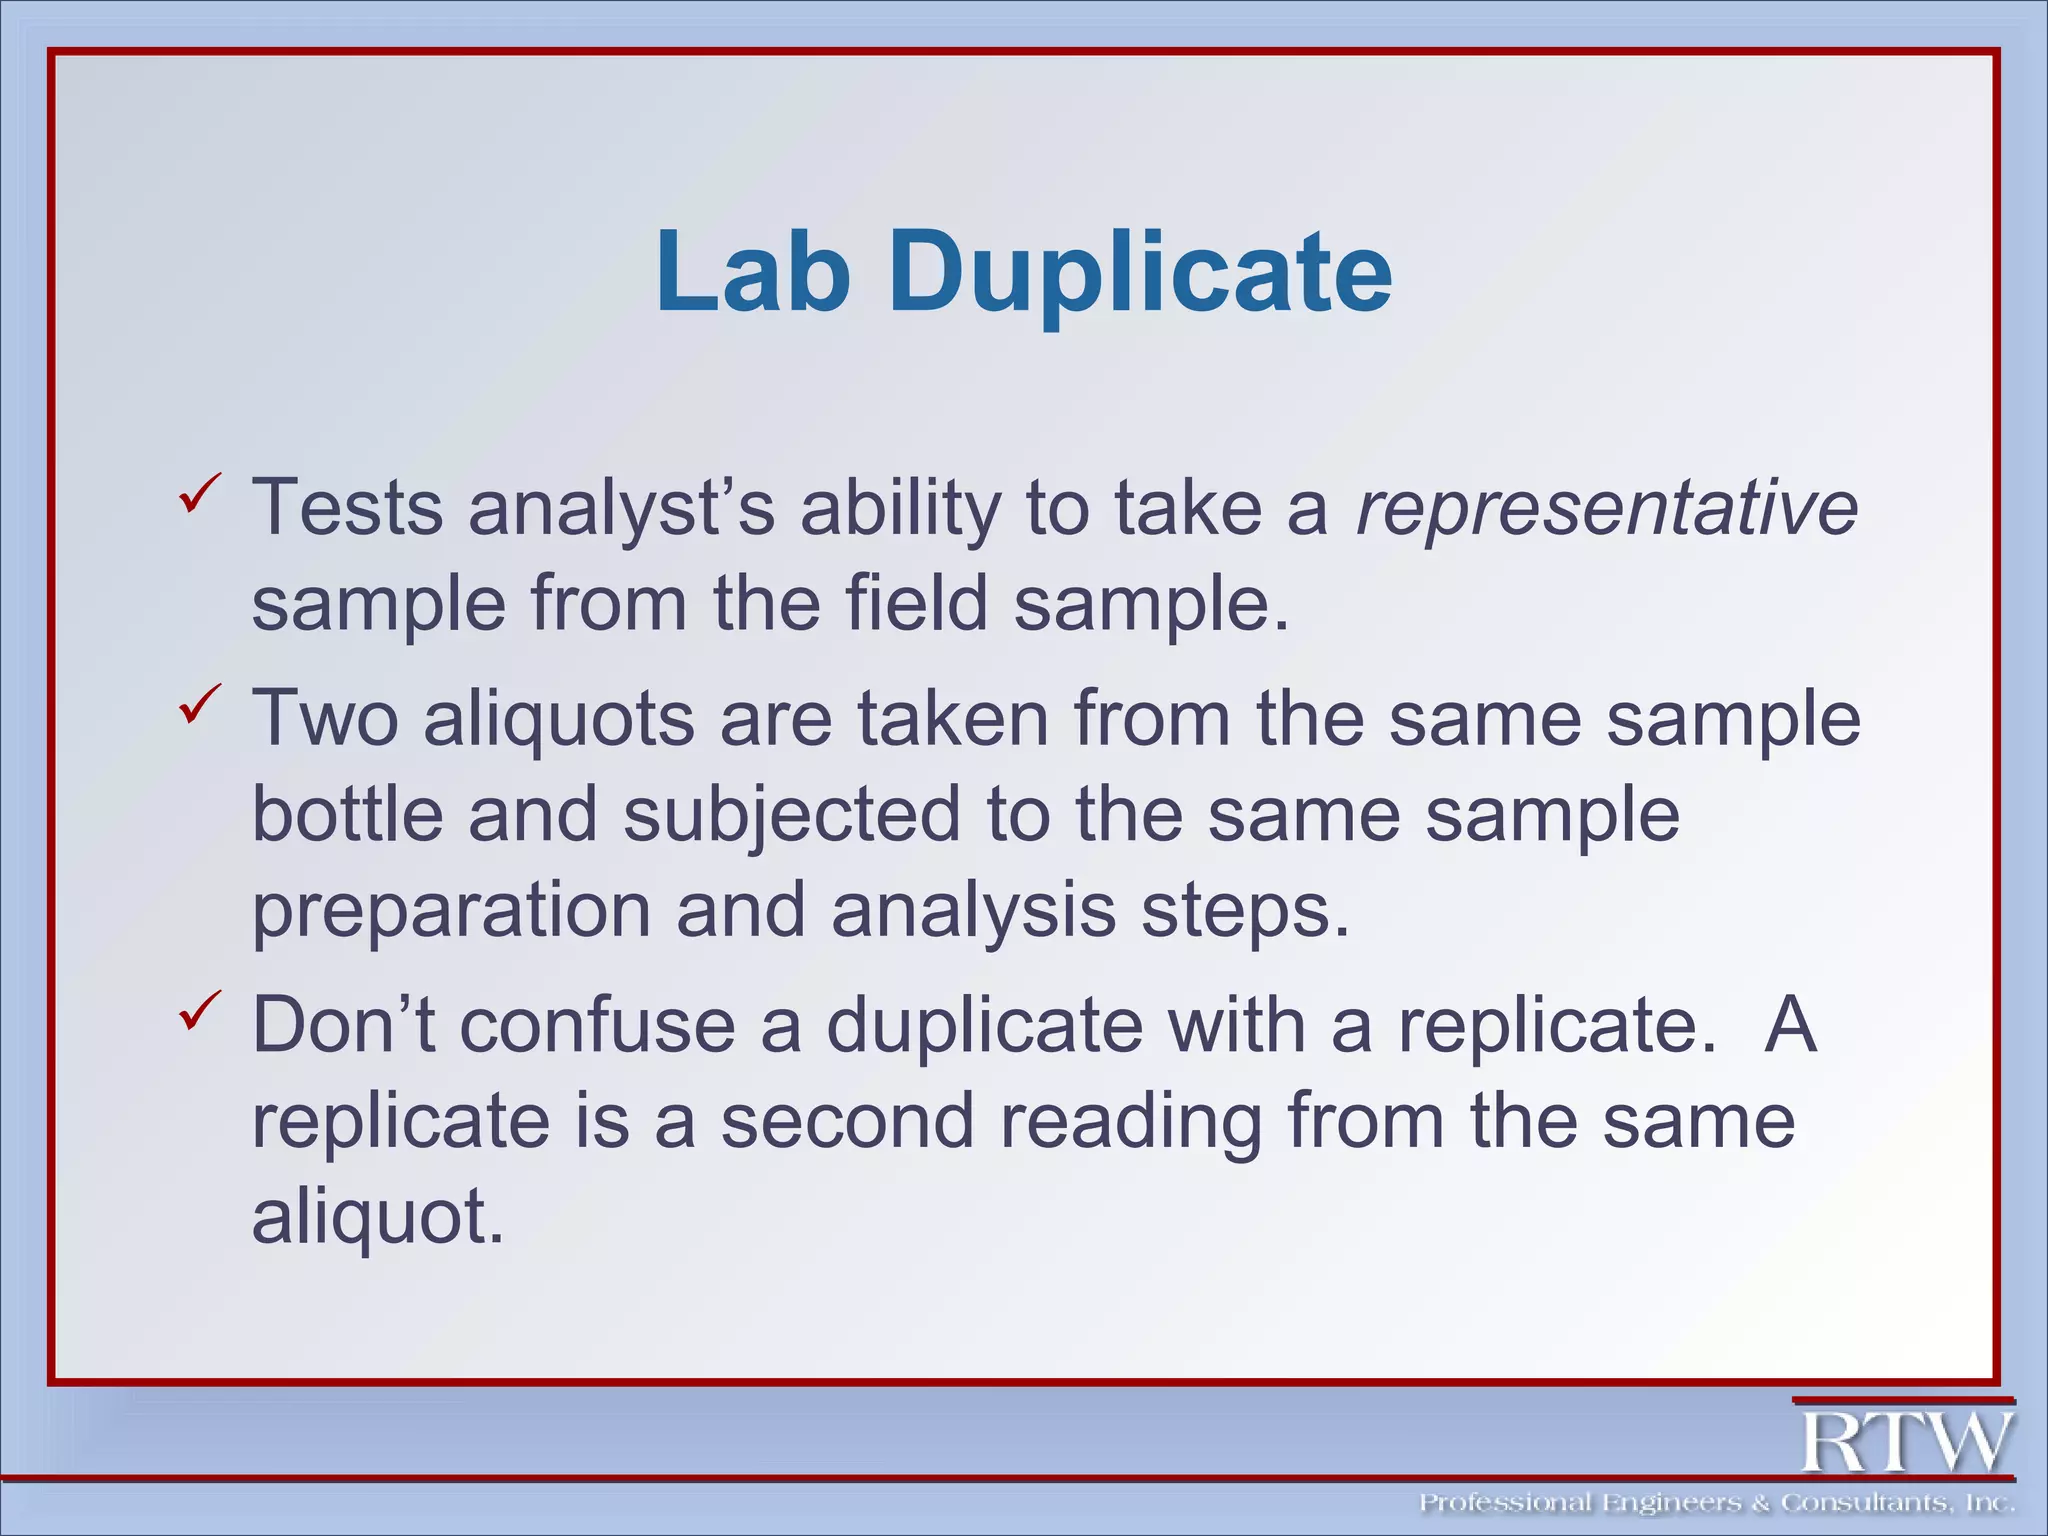
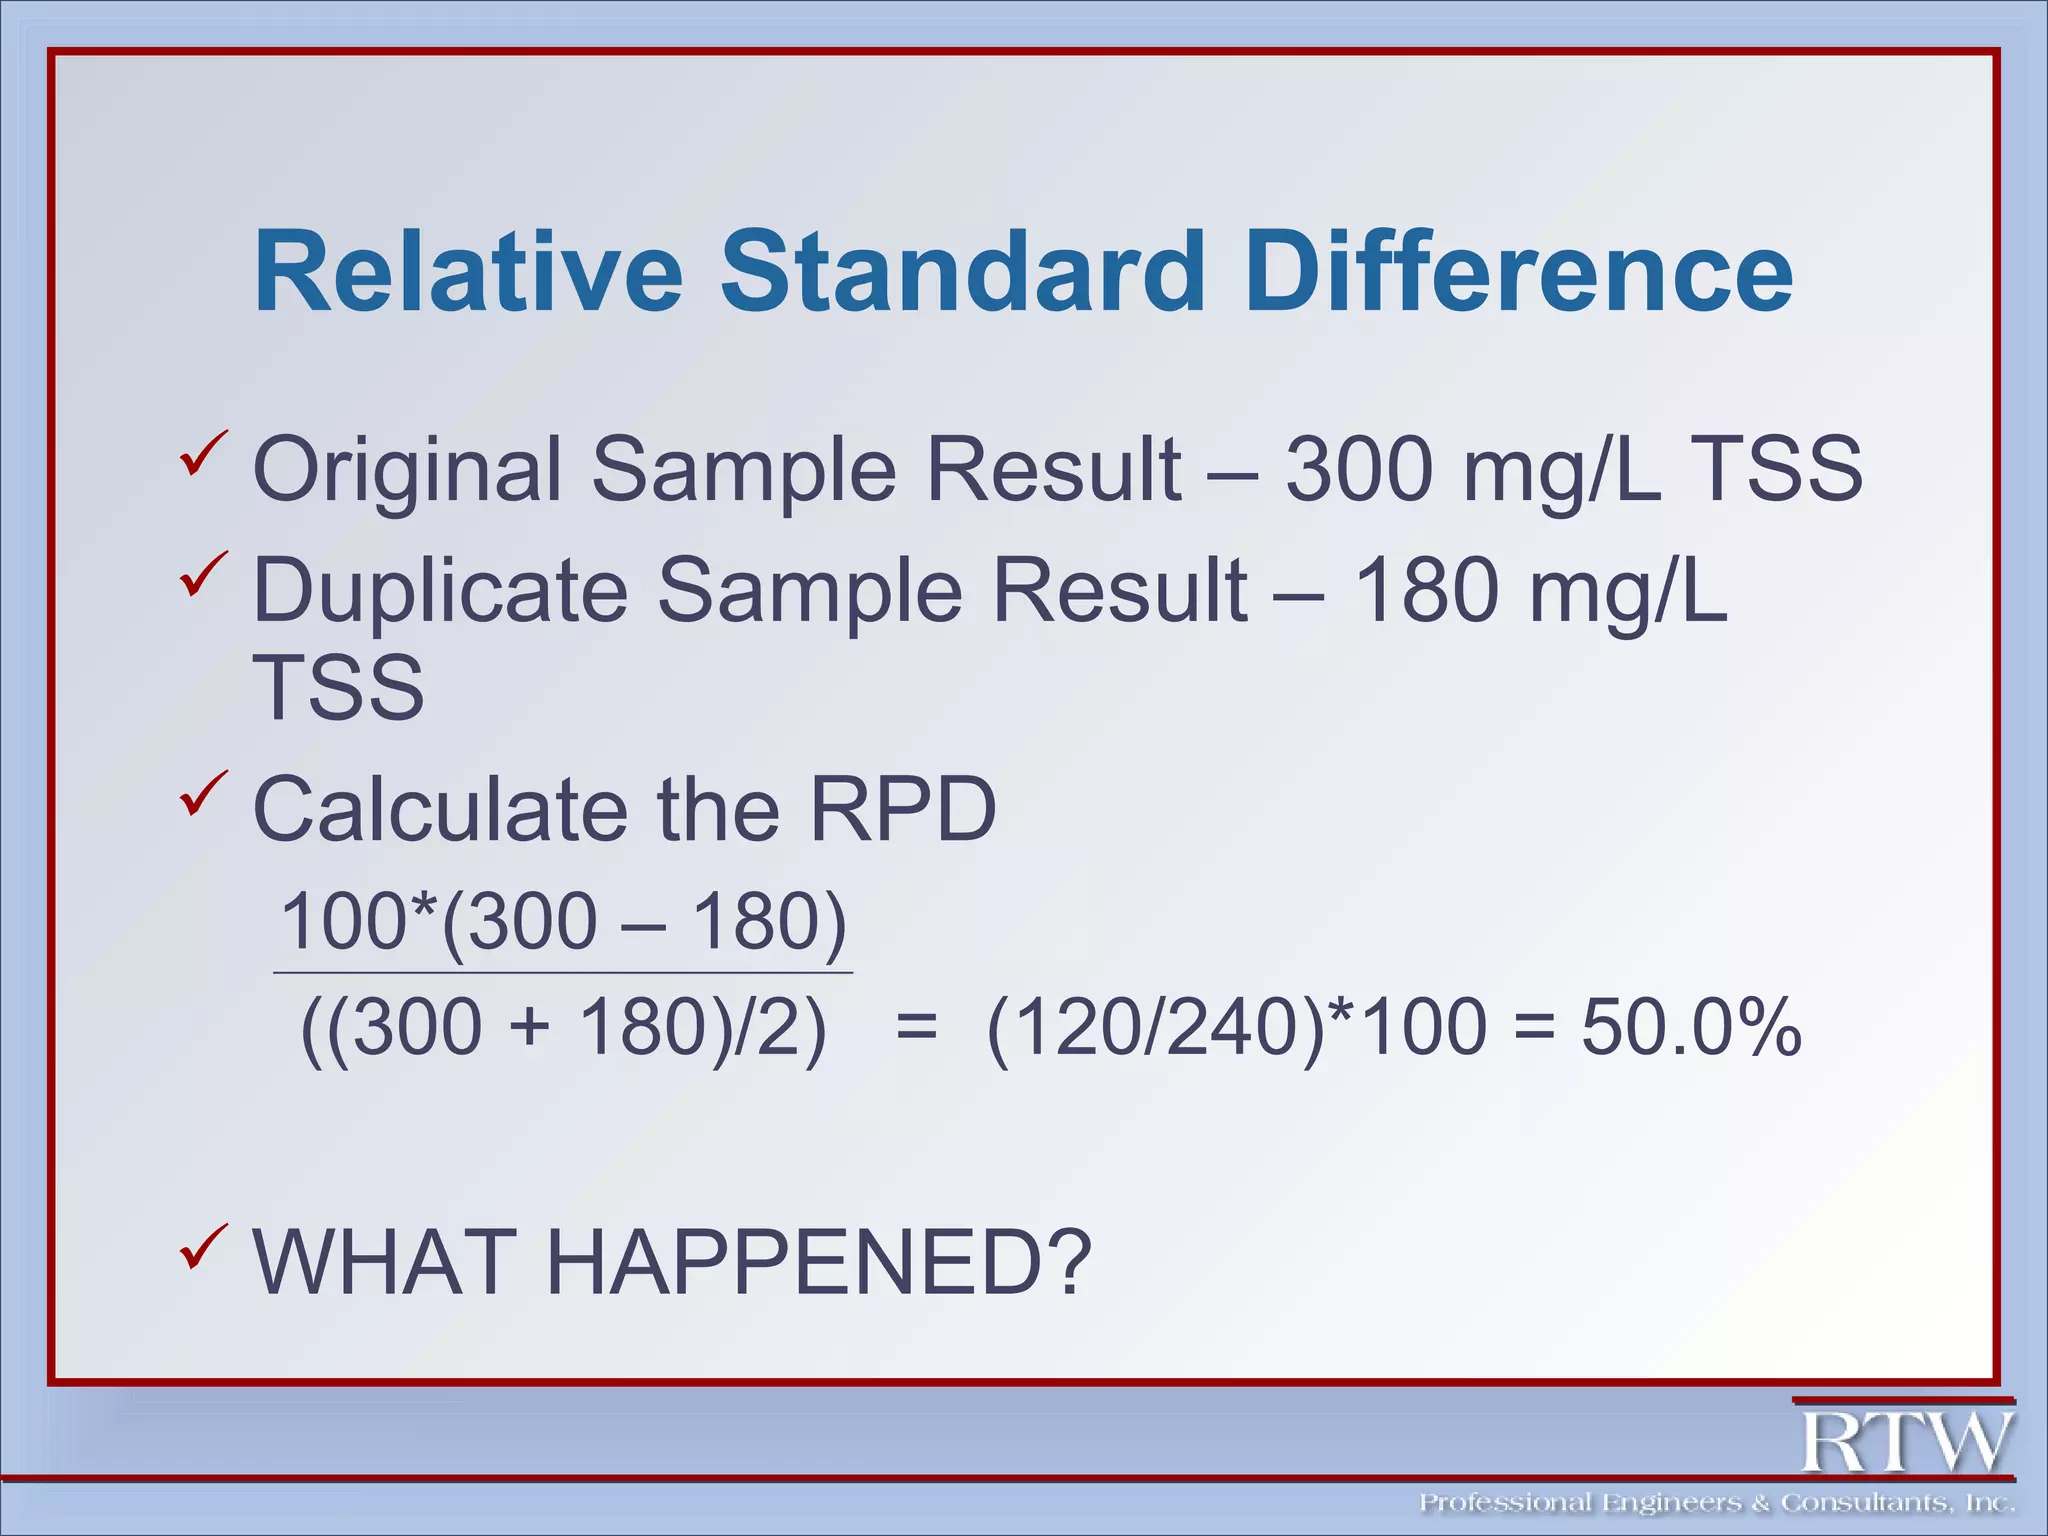
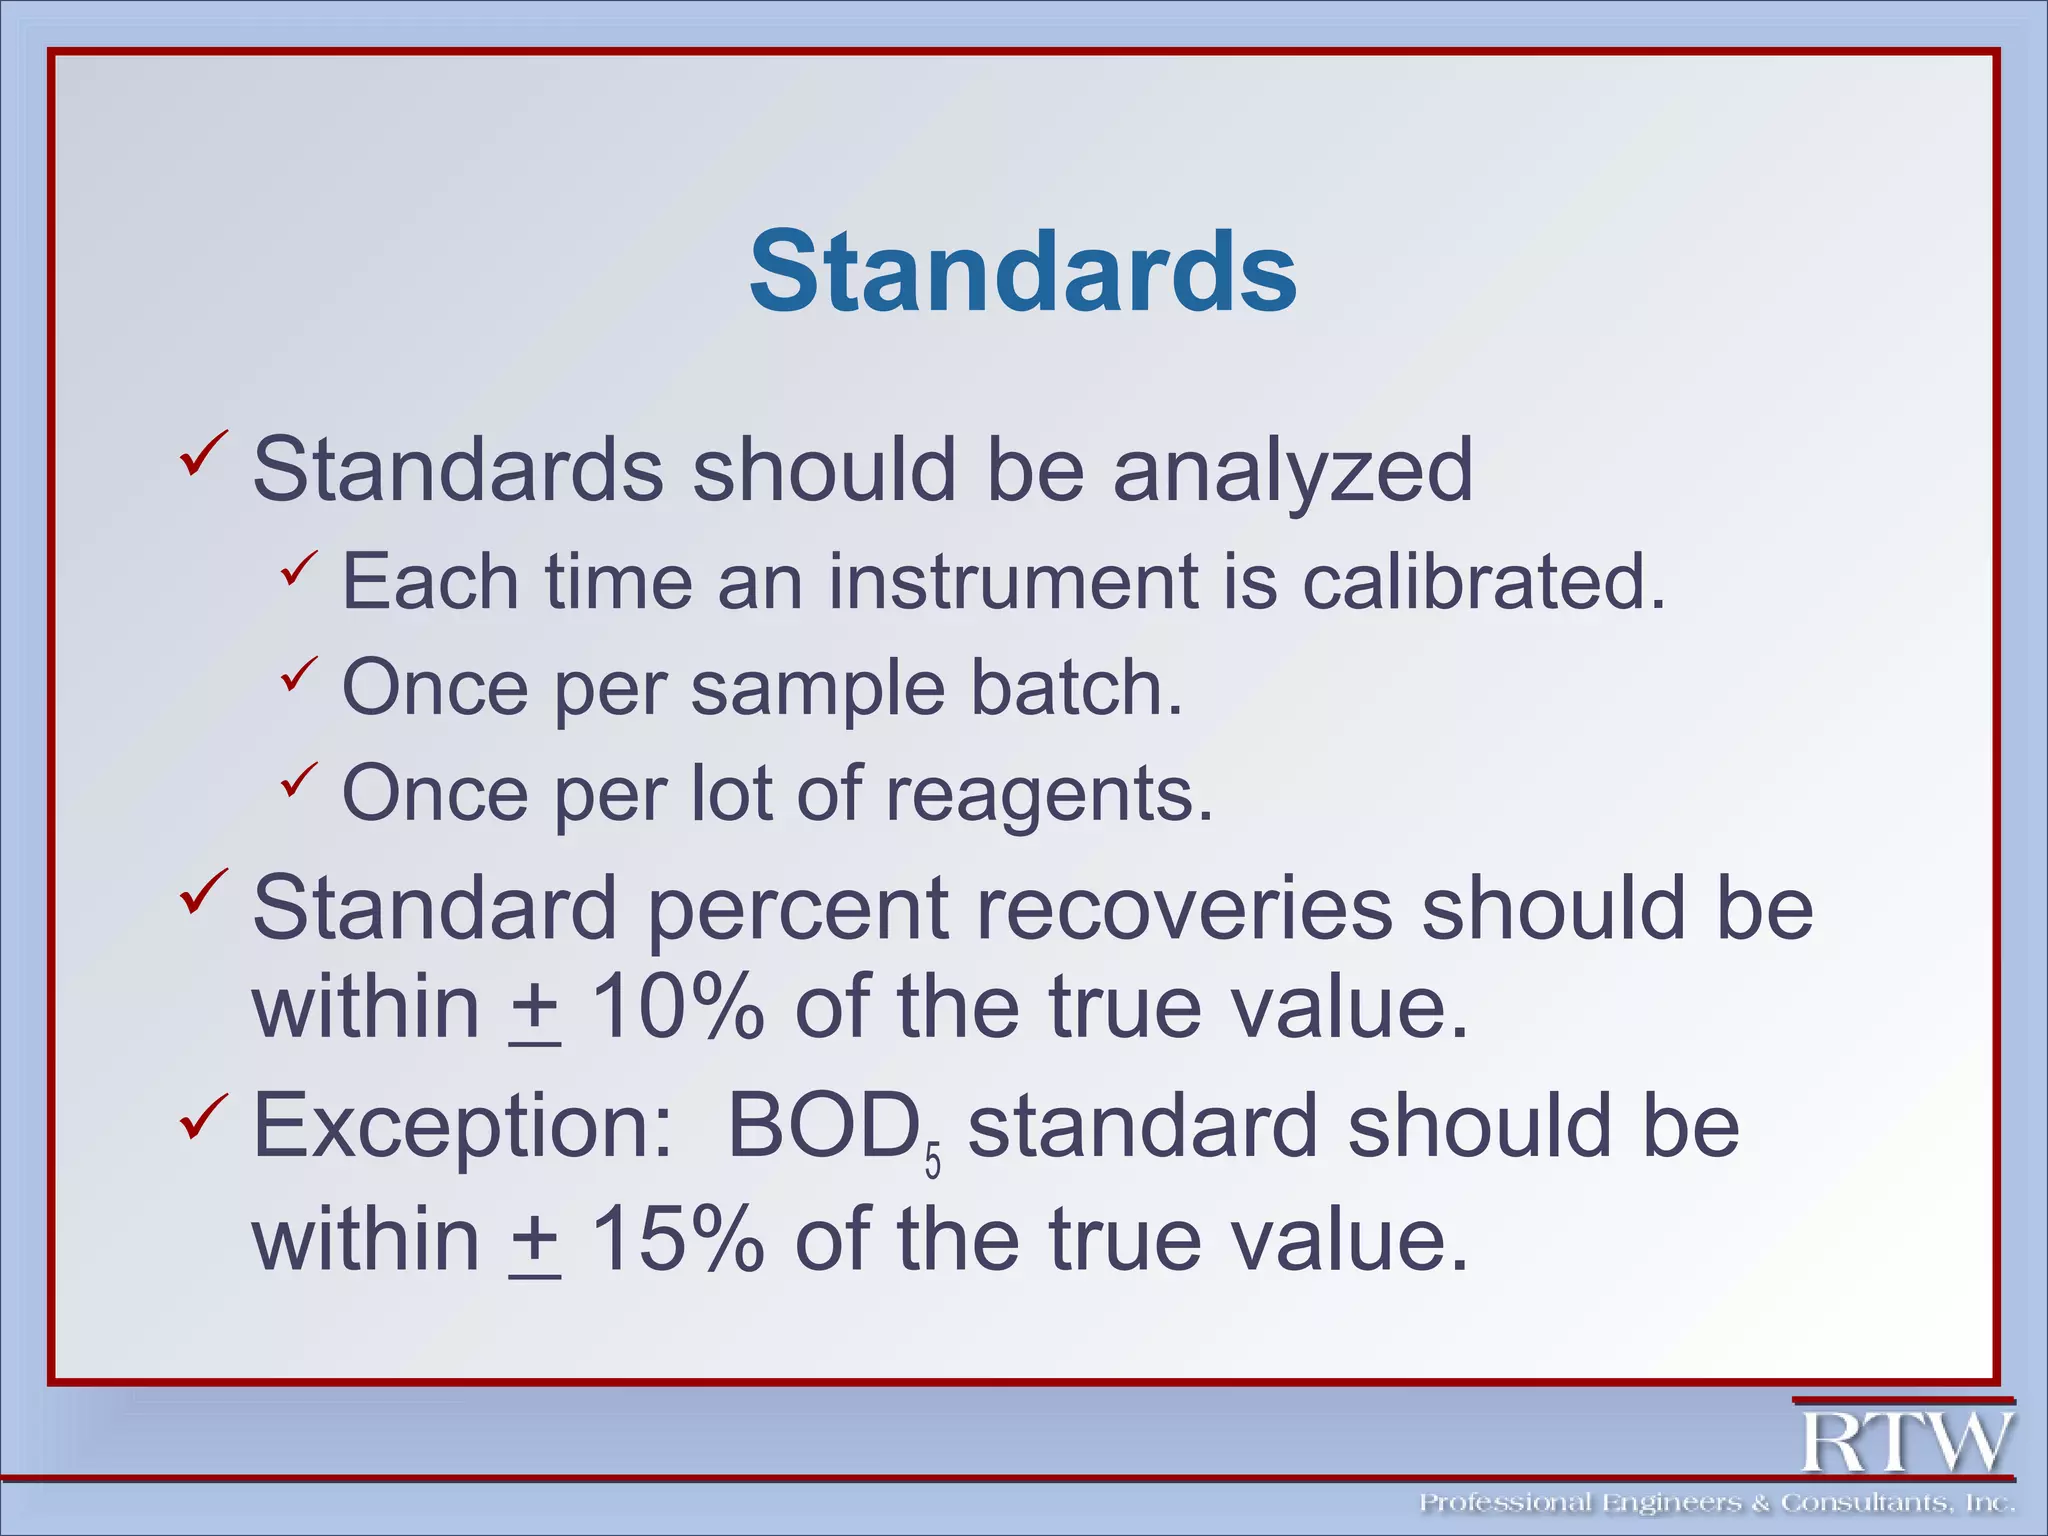
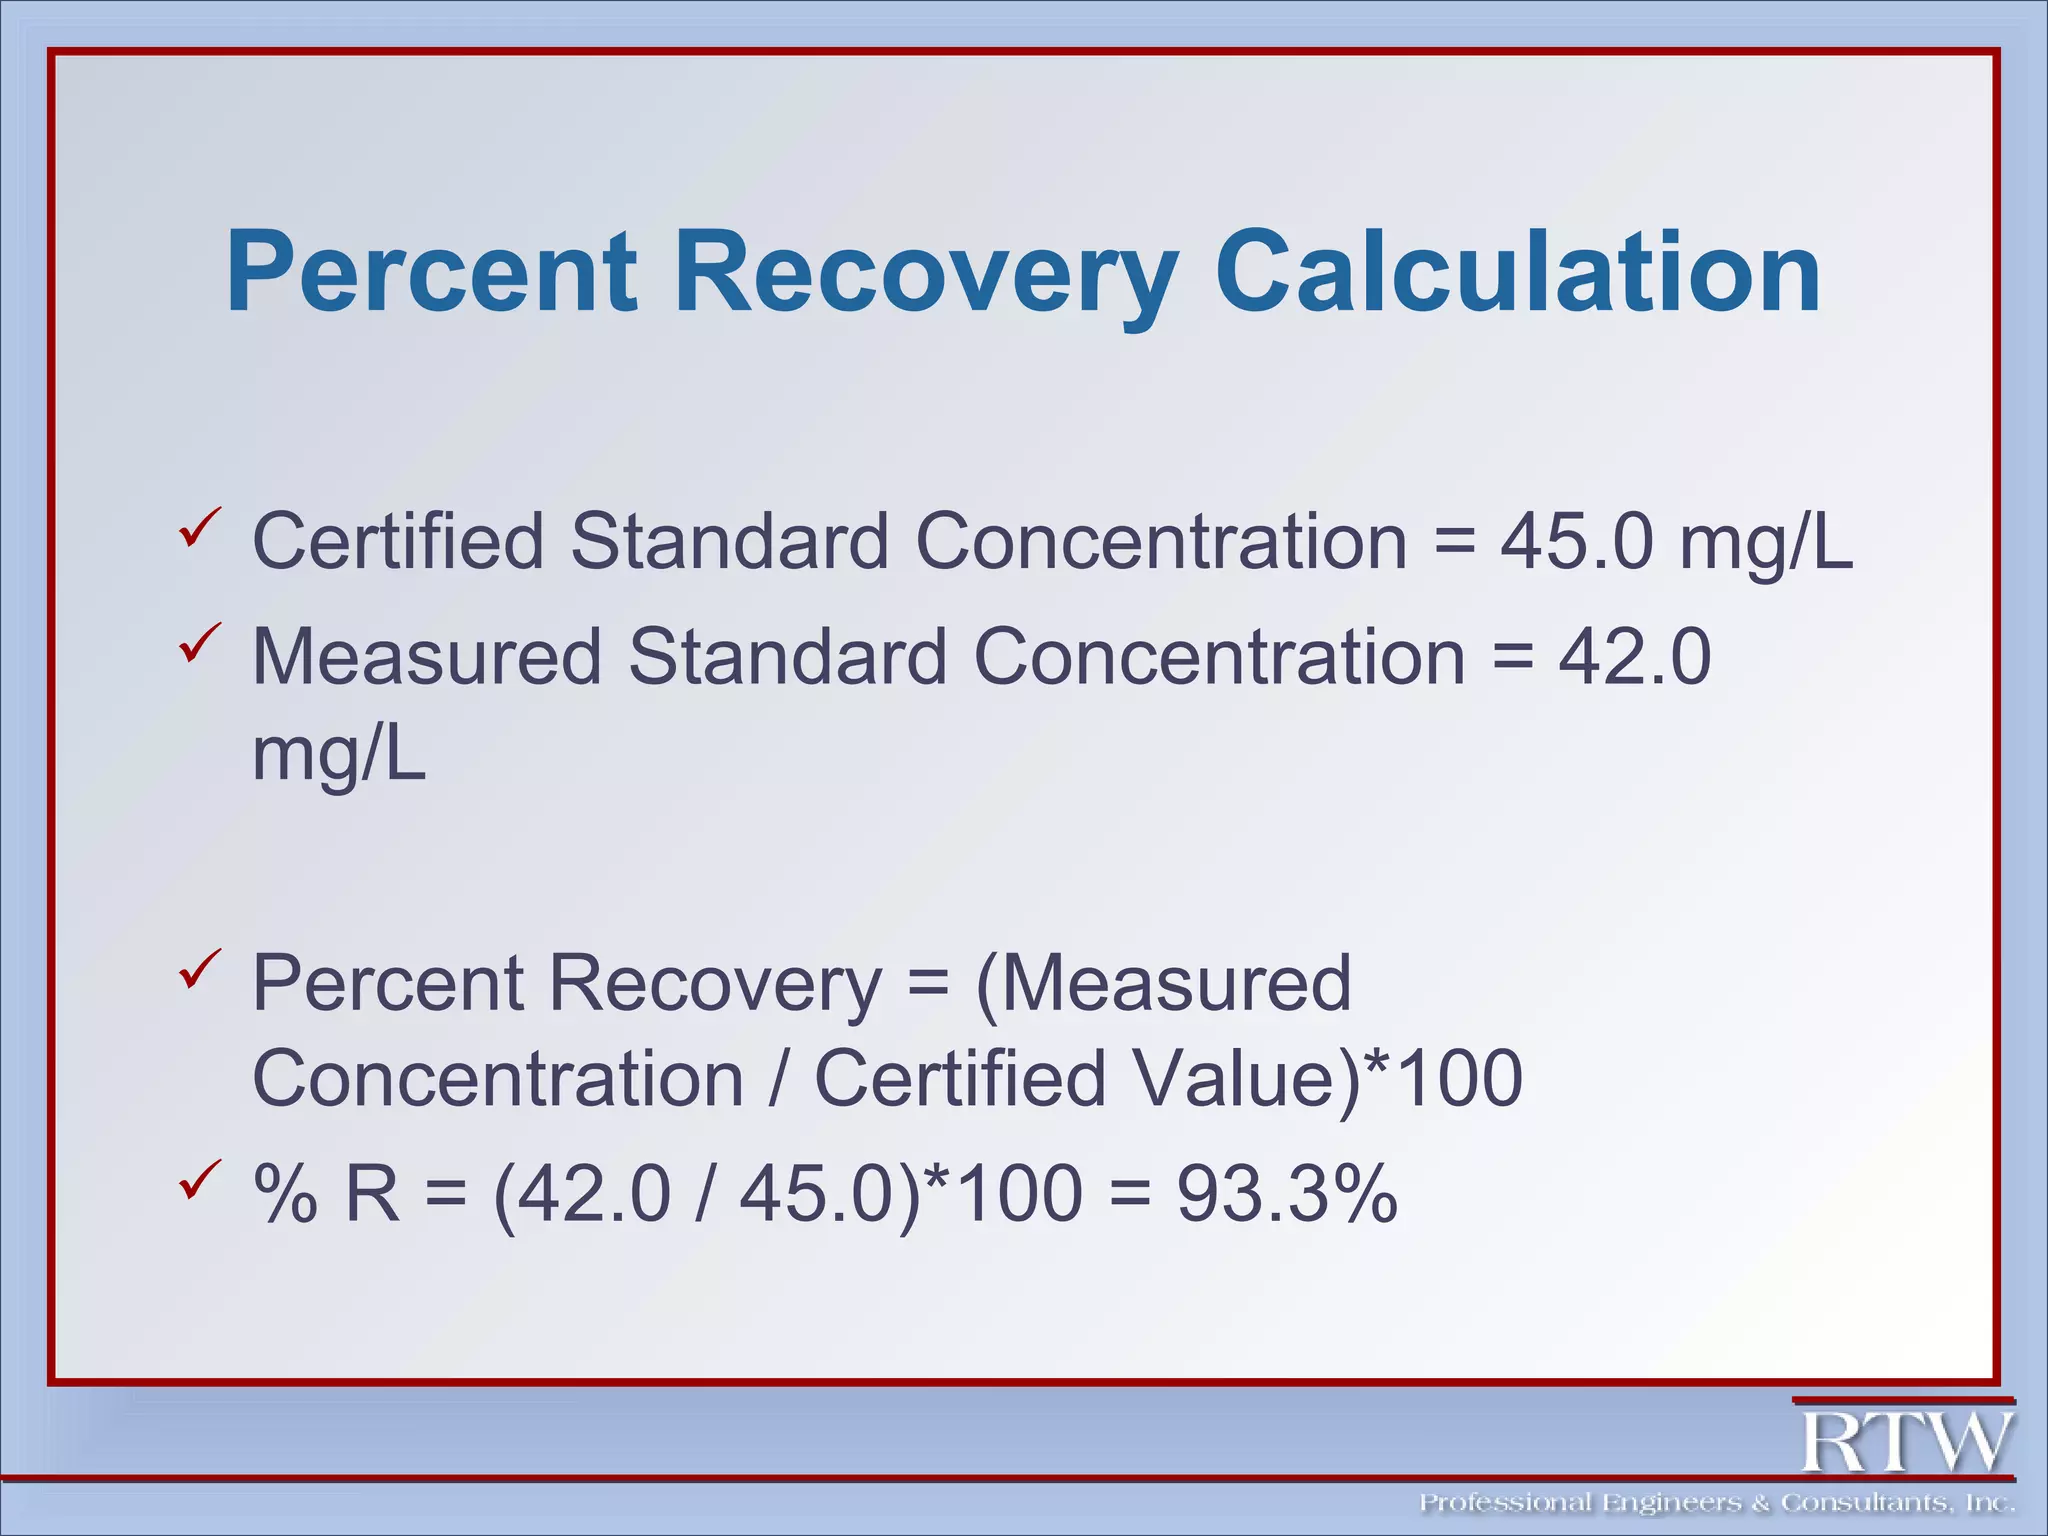
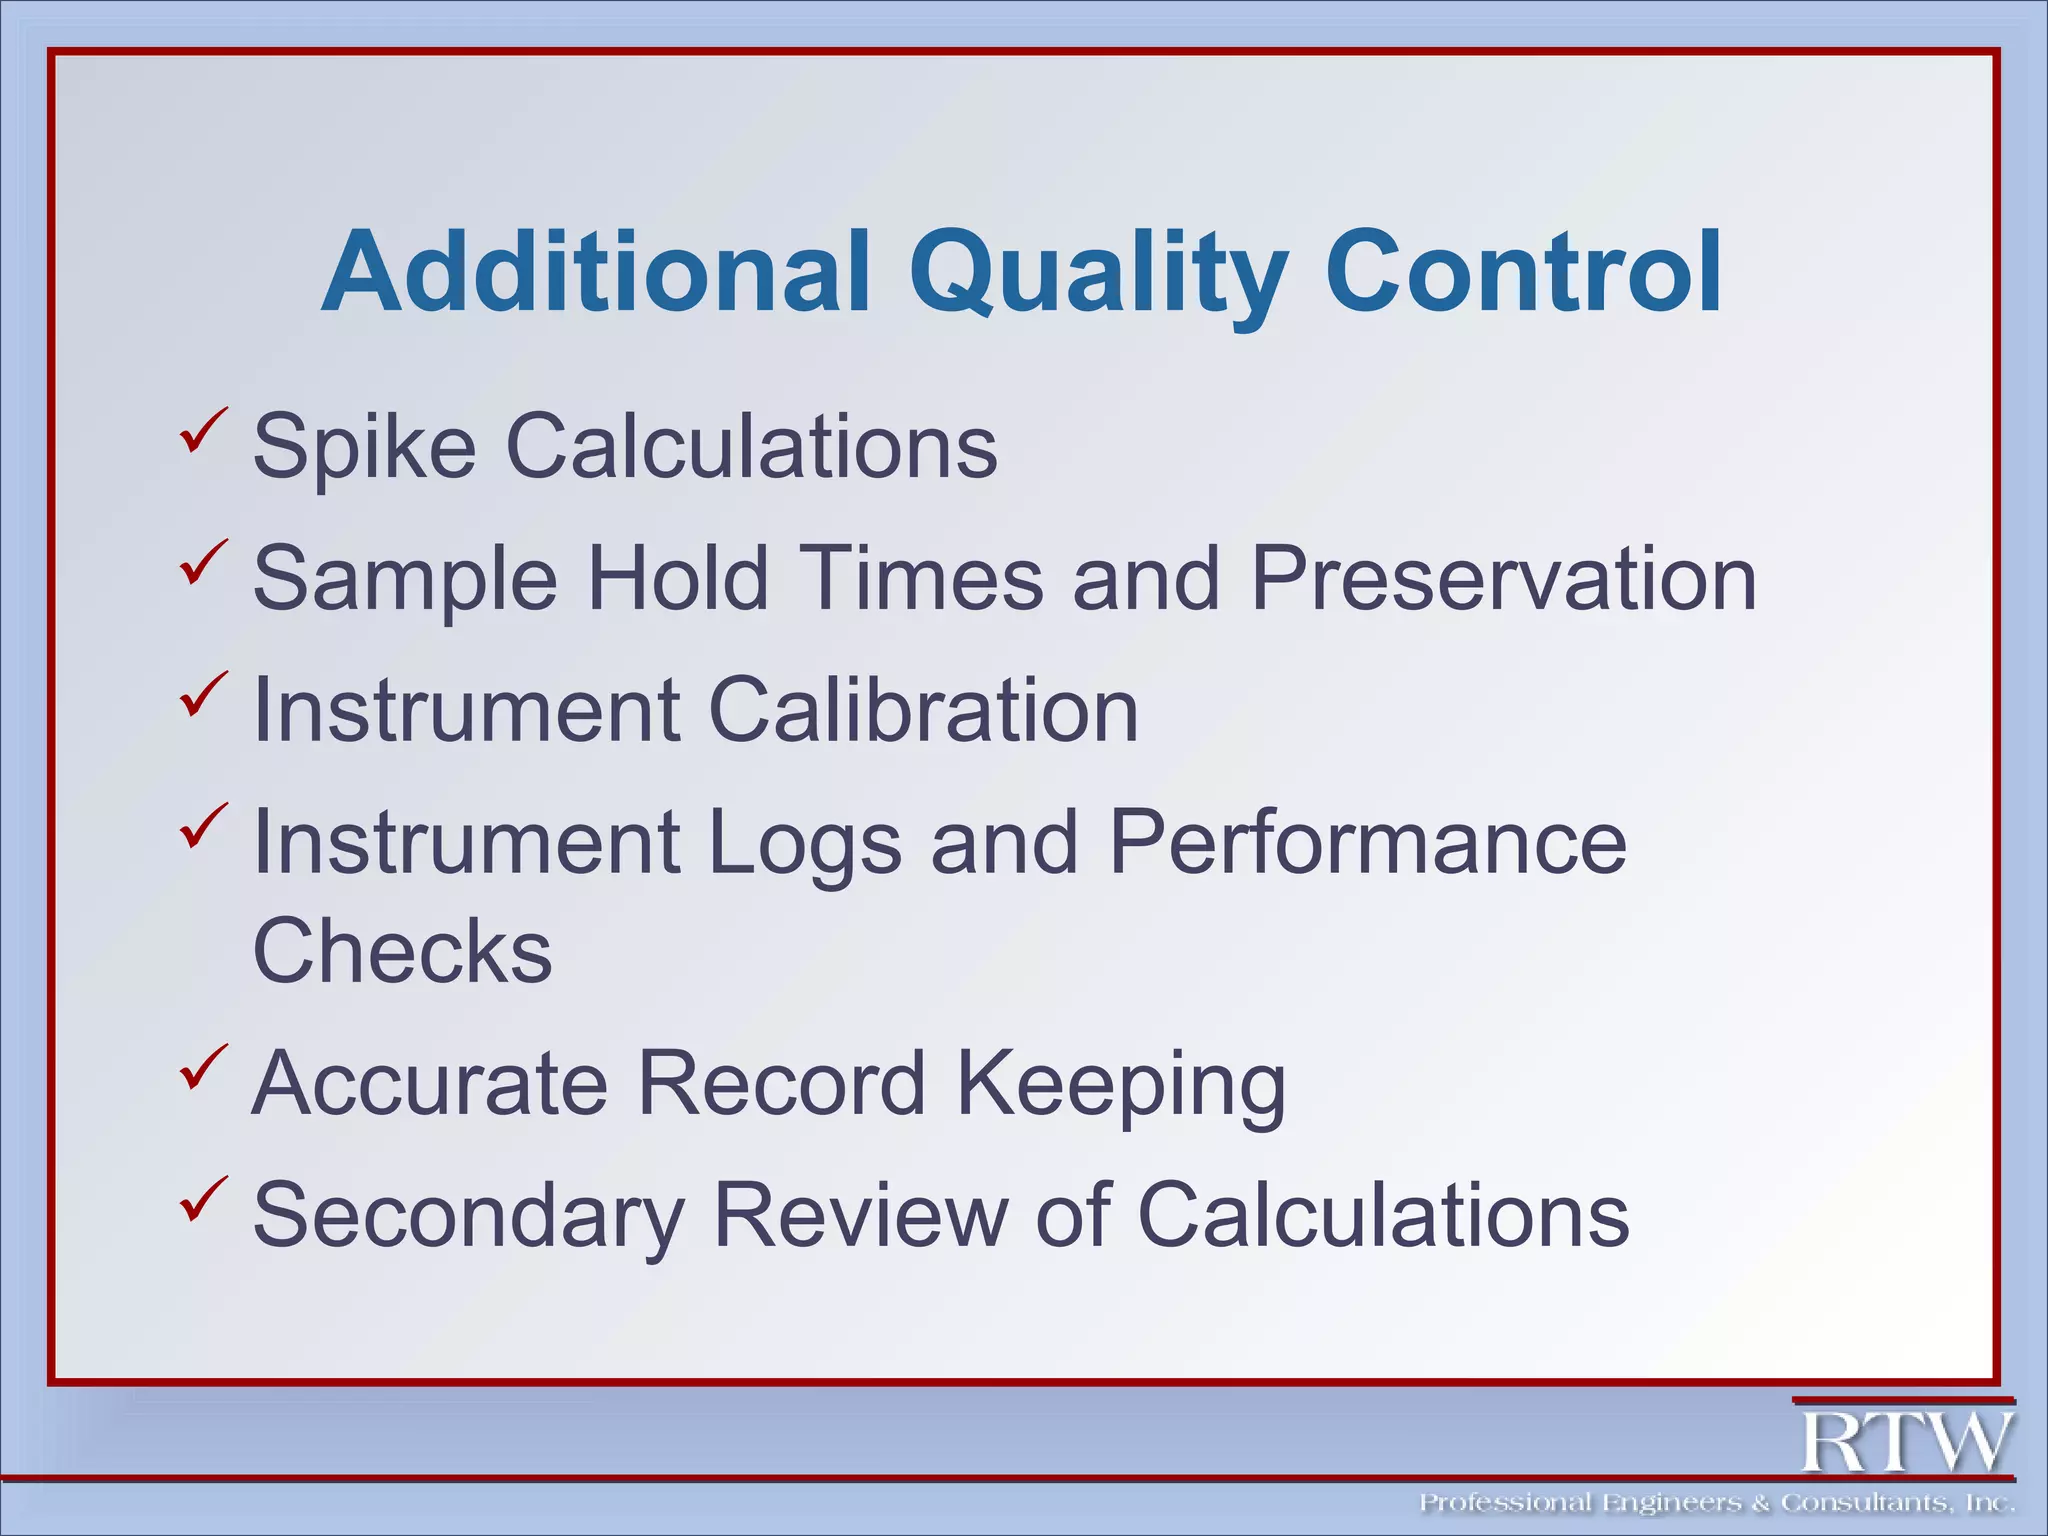
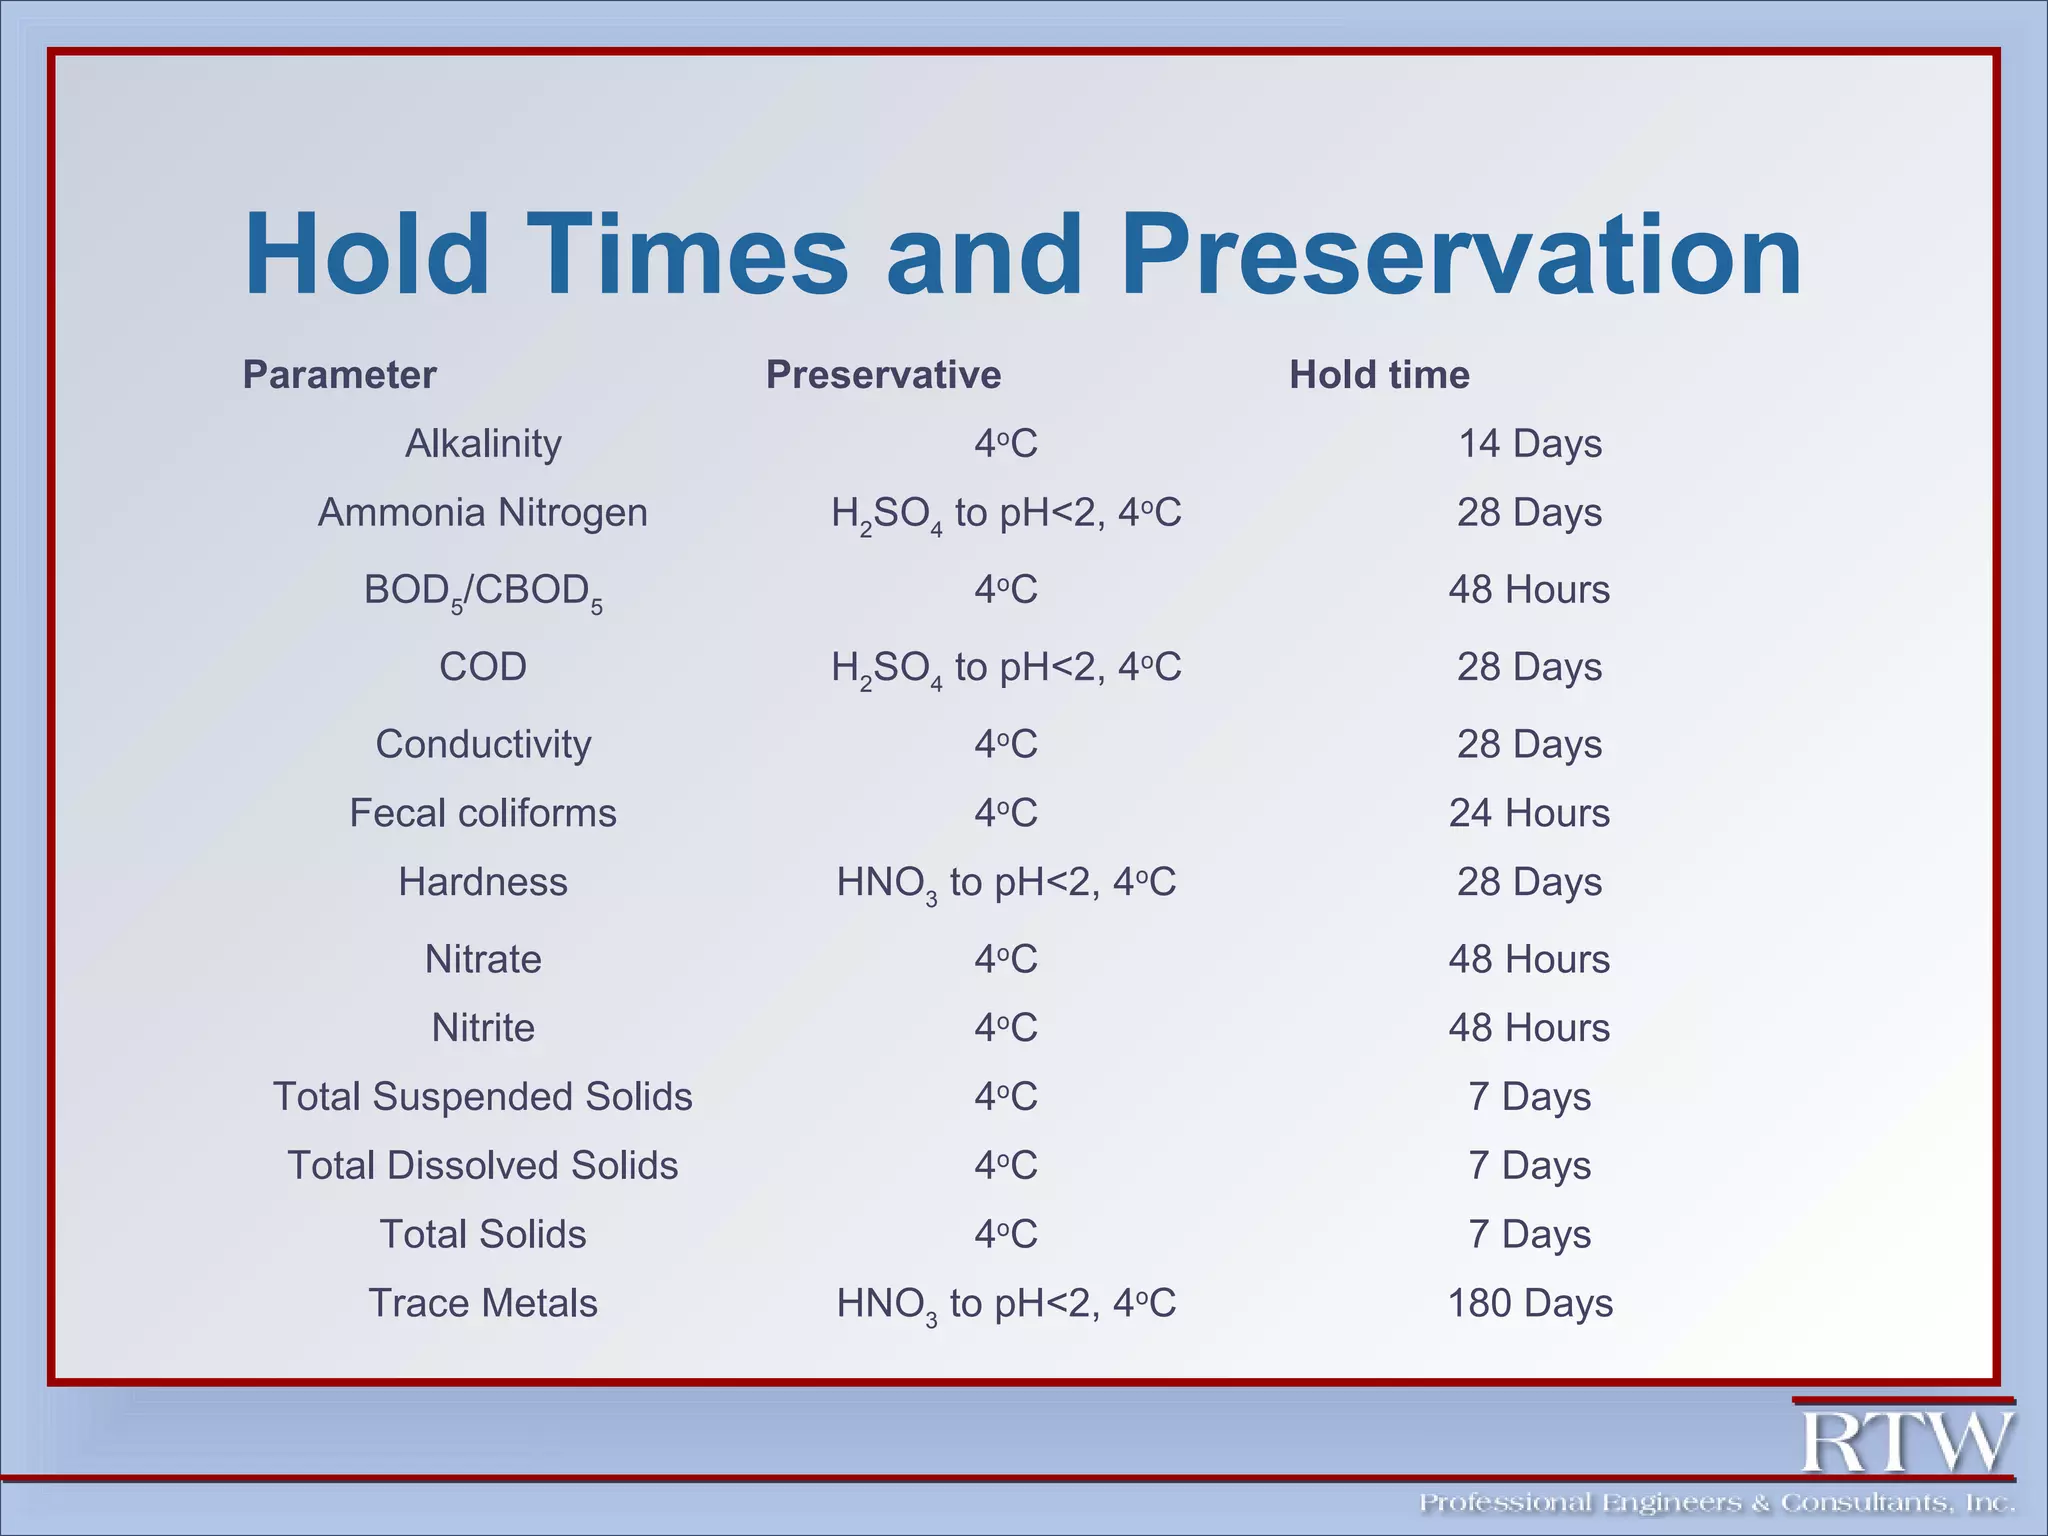
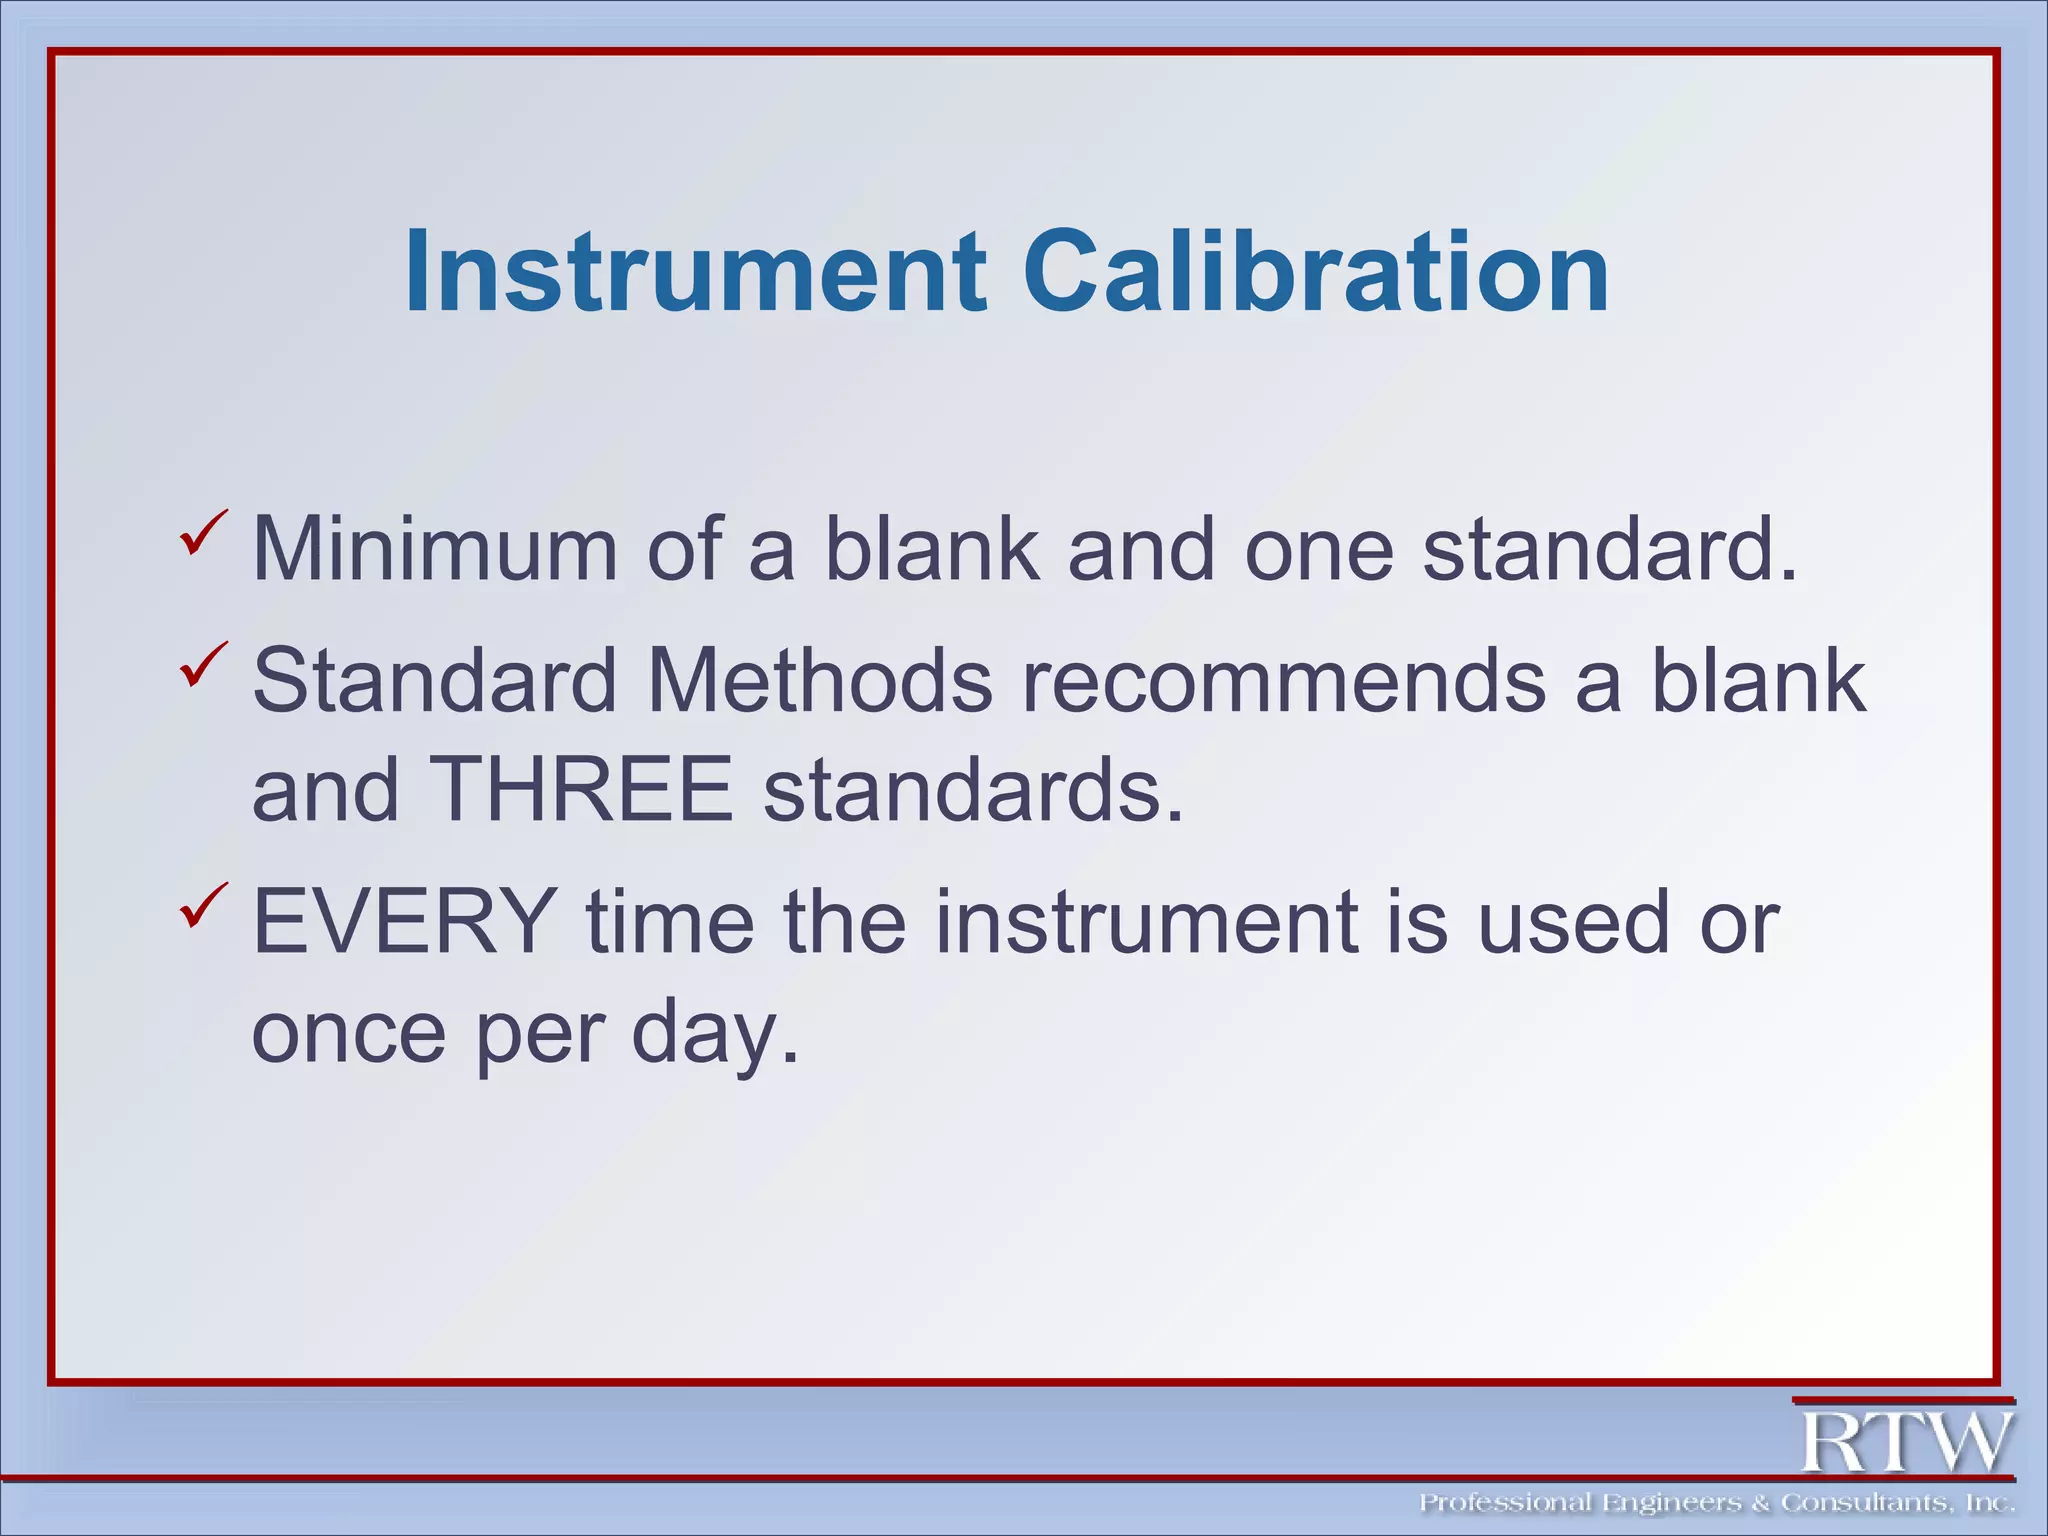
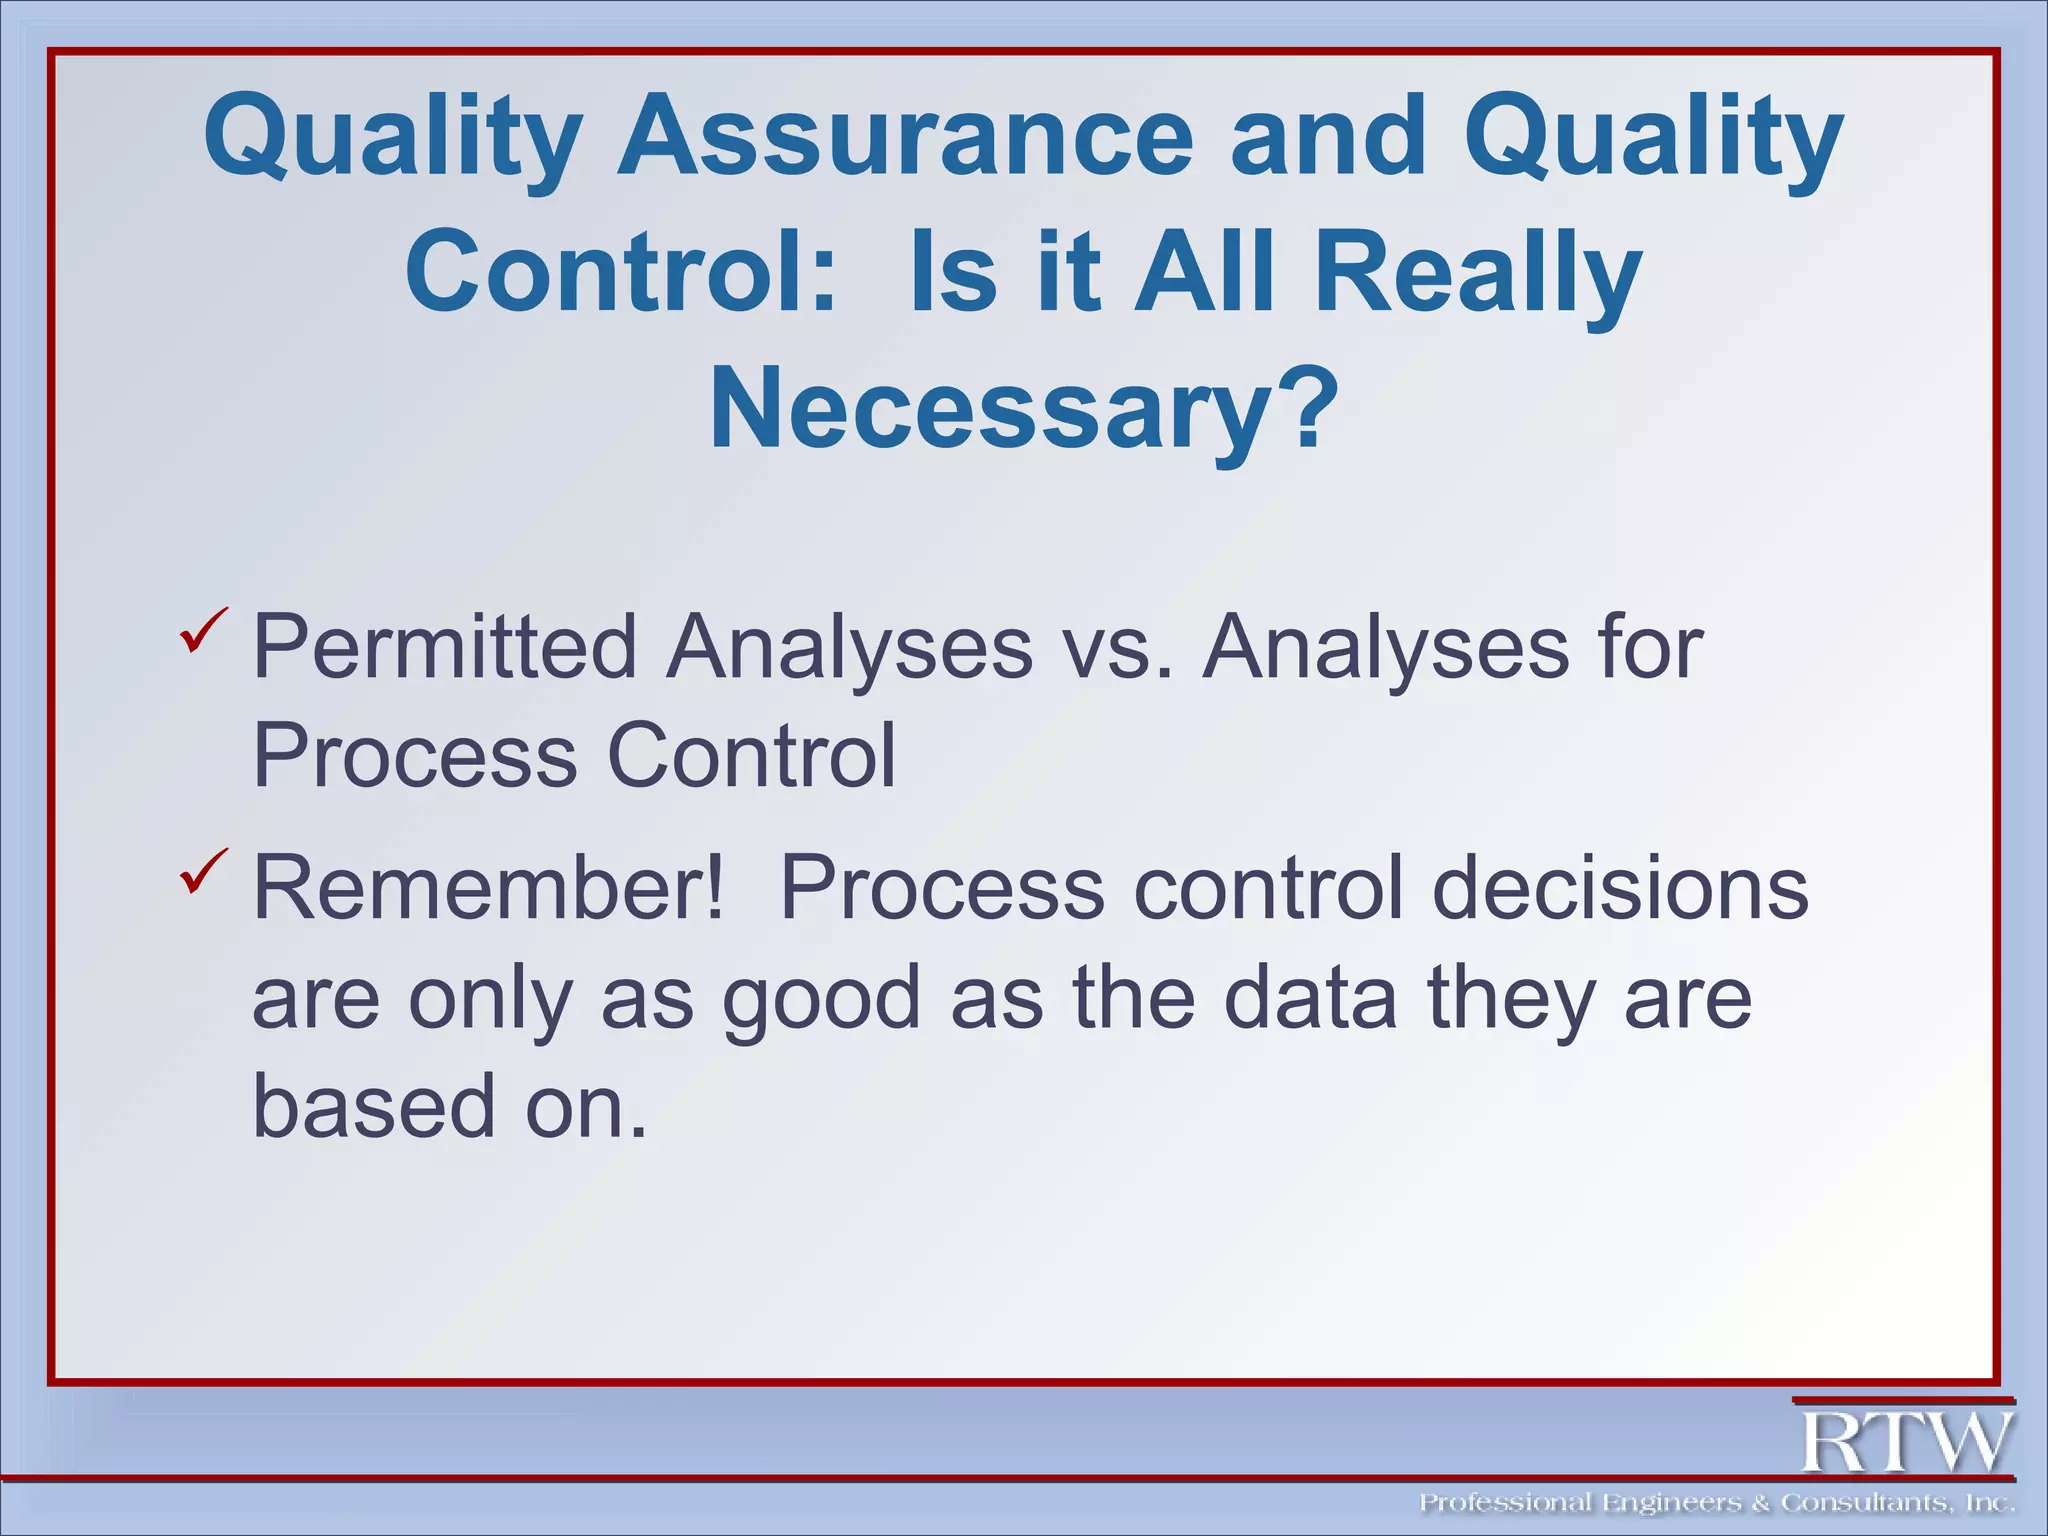
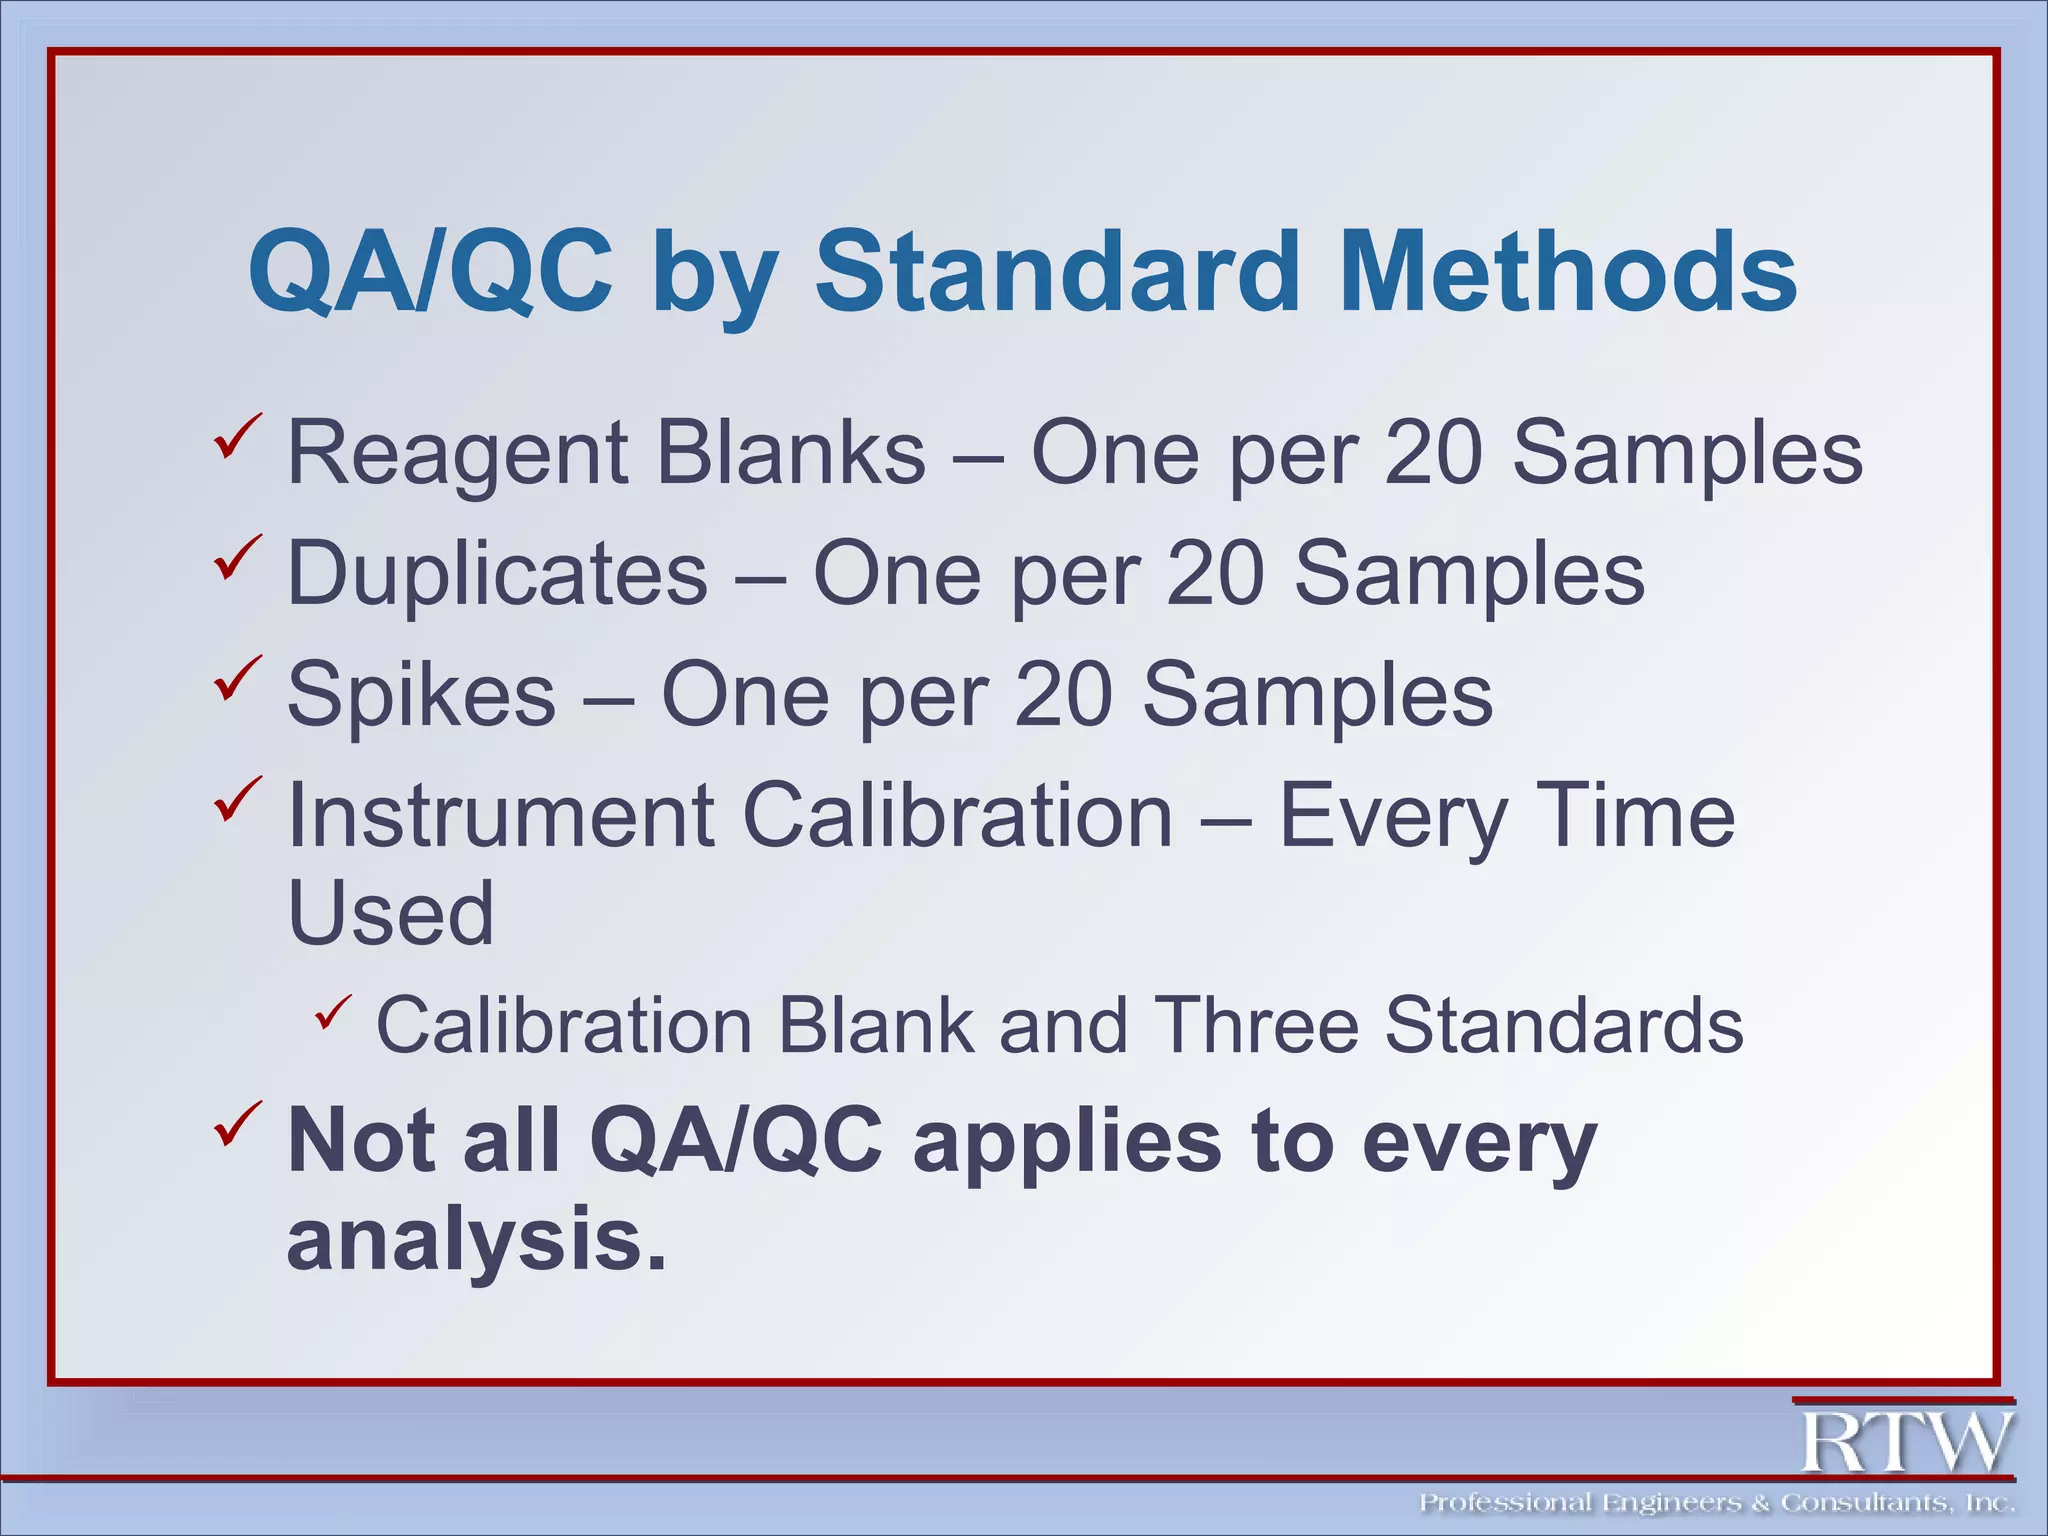
SlideShare a Scribd company logo
Representative Sampling 
and Laboratory QA/QC
Agenda 
 Language of Sampling 
 Types of Samples 
 The Unspoken Assumptions 
 Ideal Sampling Locations 
 Data Quality Objectives 
 Examples: 
The Good, The Bad, and The Ugly
Introduction 
 Sampling usually given little thought 
relative to analysis, even though critical. 
 Largest errors in results from sampling. 
 Samples are taken: 
 At the wrong place. 
 At the wrong time. 
 And of the wrong type. 
Result: Non-representative results.
Samples vs. Populations 
 The population is the 
total or all of the 
possible answers we 
might get by sampling. 
 All of the individuals in 
this room. 
 Every 100 mL aliquot in 2 
MG of influent. 
 We sample because we 
can’t count the whole 
population.
Representative Samples 
What is representative? 
 Sample should represent or be typical of 
the wastewater it is collected from. 
 If the true value of BOD5 in the wastewater 
is 280 mg/L, then the sample should be 
close to this value. 
 How do we know the sample is 
representative? 
 Answer: Statistics
Representative Samples 
 Representative 
samples should be 
very close to the 
mean value of the 
population. 
 How do we know we 
are close to the 
mean? 
 Look at the sample 
standard deviation.
Population Characteristics 
68% 
95% 
99% 
Mean or Average
Standard Deviation 
 The standard 
deviation tells us 
how spread out the 
data are. 
 If the mean is 20 
and stddev is 2, 
then 68% of all 
measurements are 
between 18 and 22.
Types of Samples 
 Grab Samples 
 Exactly what it sounds like. One sample 
collected at a particular point and time. 
 Composite Samples 
 Multiple samples collected and added 
together to make one sample. 
 Time Composite. 
 Space Composite. 
 Flow Proportional Composite. 
 Manual versus Automatic
Grab Samples 
 May be used where population is not 
changing suddenly or changing a great 
deal over time. 
 Must be used for particular analyses: 
 Residual chlorine. 
 Fecal coliform. 
 Also applicable for estimating 
performance under a given set of 
conditions.
Composite Samples 
 Frequently used to estimate average 
values over a 24-hour period. 
 BOD5 loading to aeration tanks. 
 TSS leaving the WWTP in the effluent. 
 Gives information over a longer period 
of time or space. 
 Permit samples are often flow 
proportional composites.
Composite Samples 
 Consideration must be given to 
sample handling and storage during 
compositing. 
We don’t want the sample 
characteristics to change while we 
are sampling. 
 Refrigeration often used to slow 
biological activity. 
 Chemicals may also be added as 
preservatives.
How to Composite 
 Simple Composite – Add equal volumes 
of samples collected from different 
times or locations. Mix thoroughly. 
 Flow Proportional Composite – Volume 
of each subsample based on flow. 
 Estimate total volume of sample required. 
 Estimate total flow over sampling period. 
 Calculate sample volume per flow.
Simple vs Flow Proportional 
Time Flow (MGD) NH3 -N Simple Flow Prop. 
Midnight 10 12 12 120 
4 a.m. 15 15 15 225 
8 a.m. 18 20 20 360 
Noon 28 40 40 1120 
4 p.m. 26 37 37 962 
8 p.m. 14 14 14 196 
NH3-N Conc, (mg/L) in Sample = 23.0 26.9 
Avg Daily Flow 18.5 MGD 
Total Lbs - Simple 3549 
Total Lbs - Proportional 4146 
Difference of 15%
Manual vs. Automatic 
 Manual samples are collected by hand. 
 Automatic samples are collected by 
machine. 
 Cautions for automatic samplers: 
 Not necessarily better. 
 Not accurate when collecting <20 mL. 
 Clean frequently; clogging. 
 Variable flows and intake location.
Examples of Autosampler Misuse 
 The BOD5 Producing Equalization 
Basin. 
 The No-Flow at Low-Flow Problem. 
 The 1 Day MCRT Nitrifying Basin.
Unstated Assumptions 
 For simplicity, we ASSUME that the 
population we are sampling from is: 
 Normally distributed. 
 Completely mixed. 
We also ASSUME that our sample 
value approximates the population 
mean. 
 These assumptions are not always true.
Guidelines for 
Representative Sampling 
 Samples should be collected: 
 Only where wastewater is well-mixed. 
 In the center of the flow channel. 
 Horizontally and Vertically. 
 Avoids floating scum and settled solids. 
 Ensure that samplers and sample 
containers are clean, uncontaminated, 
and suitable for the planned analysis.
Guidelines for 
Representative Sampling 
 Recommended Sample Containers: 
 HDPE appropriate for most analyses. 
 Trace metals, oil and grease, volatiles 
should be sampled in glass containers. 
 Pre-cleaned or sterilized containers for 
phosphorus testing and fecal coliforms. 
When compositing or aliquoting, mix 
samples well before pouring.
Guidelines for 
Representative Sampling 
Wiers are not good sampling points. 
 Solids settle upstream of weirs. 
 Oils and greases build-up downstream. 
 Materials tend to collect on the sides 
and bottoms of channels. Avoid edges. 
 Before collecting the sample, rinse the 
sampler and sample container several 
times.
Agenda 
 Language of Sampling 
 Types of Samples 
 The Unspoken Assumptions 
 Ideal Sampling Locations 
 Data Quality Objectives 
 Examples: 
The Good, The Bad, and The Ugly
DQOs 
 There are a lot of choices in sampling. 
What type of sample to take. 
Where to collect the sample. 
What time of day to collect the sample. 
 How do we know what we need? 
What data quality objectives (DQOs) 
are all about.
DQOs 
 A sampling and analysis plan of attack. 
 Plan of attack is determined by 
answering these questions: 
 Why are we taking the sample? 
 What do we want to know? 
 How will the data be used? 
 What level of QA/QC is needed? 
 Who will take the samples?
Why Collect the Sample? 
 For process control: 
 Wasting calculations. 
 Calculation of unit process efficiency. 
 Estimating plant capacity. 
 For permitting: 
 Required analyses for DMR. 
 Required analyses for biosolids disposal. 
 Quantifying receiving water quality.
What Do We Want to Know? 
 Seems like a simple question…… 
 Often neglected in sampling and 
analysis plans. 
 Are we interested in: 
 Average performance? 
 Performance at peak load? 
 Dictates type of sample AND time of day. 
 Dictates sampling location.
How Will the Data be Used? 
 Internally or externally? 
 Public access? 
Will results prompt capital 
expenditures? 
 Does data need to be legally 
defensible? 
 Dictates total number of samples, 
analysis method, and QA/QC needed.
What level of QA/QC 
is Needed? 
 Field and laboratory? 
 Frequency of QA/QC Samples? 
 Permit required analysis – every time. 
 Process control – weekly perhaps. 
 Certified standards needed? 
 Outside laboratory involved?
Who Will Take the Samples? 
 Daytime sampling and analysis not 
usually a problem, but…. 
 Nights and graveyards? 
Week-ends? 
 May limit types of sampling to be done. 
 Autosamplers eliminate this problem, 
but still need to be checked.
Example Problems
Plan of Attack 
 Why are we taking 
the sample? 
 What do we want to 
know? 
 How will the data be 
used? 
 What level of 
QA/QC is needed? 
 Who will take the 
samples? 
 Sampling location. 
 Grab or composite. 
 Frequency of 
sampling. 
 Analytes needed. 
 QA/QC required.
Calculate MCRT 
 Where to collect 
samples? 
 Type of samples to 
collect? 
 If multiple basins are 
in use? 
 If basins are 
independent?
Estimate TF Performance 
 For average 
performance. 
 For peak 
performance. 
 Develop DQOs. 
 What if there is 
recycle?
Quality 
Assurance/Control
Why Do We Do It? 
 To Check for Contamination 
 To Verify 
 Precision 
 Accuracy 
 To Determine if Interferences are 
Present 
 ENSURES DATA QUALITY and 
GIVES CONFIDENCE!
Contamination 
 Results in a false positive. 
 Caused by dirty glassware and improper 
sampling or handling techniques 
 Can happen at any stage of sampling or 
analysis 
 Happens when we add something to the 
sample 
 Examples: Phosphorus, Fecal Coliforms, BOD5
Precision versus Accuracy 
 Neither precise nor accurate. 
 Precise, but not accurate. 
 Accurate, but not precise. 
 Accurate and Precise. BOTH 
ARE NEEDED.
Precision versus Accuracy 
Neither 
Precise 
Accurate 
Both
Interferences 
 Substances in a sample that 
cause 
 False Positives 
 False Negatives 
 Look for Interferences at the time 
of analysis.
How do we know if we are: 
Free of contamination? 
Accurate and precise? 
Lacking Interferences?
Checking for 
Contamination 
BLANKS
Filter Blank 
Only needed when analyzing for 
dissolved substances. 
 Total Suspended Solids (TSS) 
Ortho-phosphorus
Filter Blank 
 Checks for contamination during filtering. 
 Set up and clean filtration apparatus. Special 
cleaning should not be done for blanks. 
 Filter a volume of ultra-pure water. 
 The filtrate is the filter blank. 
 The filter blank should be treated like any 
other sample.
Reagent Blank 
 Ultra-pure water analyzed as a sample. 
 Accounts for differences in reagents 
between lot numbers or batches. 
Often used to “auto-zero” and 
instrument. 
 Subtracts out background. 
 Can be a check for contamination.
Limits for Blanks 
 Blank values should be less than the 
MDL. 
MDL = Method Detection Limit. 
 Lowest concentration used for 
reporting. 
 Calculated value that may be different 
for different laboratories and analysts. 
 See EPA method for how to calculate.
Acceptable or Unacceptable? 
MDL for Nitrate test is 0.5 mg/L 
 Field blank reads 0.2 mg/L 
 Filter blank reads 1.7 mg/L 
 Reagent blank reads 0.1 mg/L 
 Sample results are higher than normal. 
What happened?
Checking for Precision 
DUPLICATES
Field Duplicate 
 A second sample taken at the same 
time and place as the original sample. 
 Placed into a separate sample bottle. 
 Checks whether or not the sample is 
representative. 
 Tells us how heterogeneous the 
population is.
Relative Standard Difference 
 RSD = ( A - B) * 100 
((A+B)/2) 
 Where 
A = Original Sample Result 
B = Duplicate Result 
 Results from a field duplicate should agree 
within +/- 20% RPD of original sample.
Relative Standard Difference 
 Original Sample Result – 300 mg/L BOD5 
 Duplicate Sample Result – 350 mg/L BOD5 
 Calculate the RPD 
100*(300 – 350) 
((300 + 350)/2) = (50/325)*100 = 15.4% 
 Within Limits?
Lab Duplicate 
 Tests analyst’s ability to take a representative 
sample from the field sample. 
 Two aliquots are taken from the same sample 
bottle and subjected to the same sample 
preparation and analysis steps. 
 Don’t confuse a duplicate with a replicate. A 
replicate is a second reading from the same 
aliquot.
Relative Standard Difference 
 Original Sample Result – 300 mg/L TSS 
 Duplicate Sample Result – 180 mg/L 
TSS 
 Calculate the RPD 
100*(300 – 180) 
((300 + 180)/2) = (120/240)*100 = 50.0% 
WHAT HAPPENED?
Checking for Accuracy 
STANDARDS
Standards 
 Contain a known concentration of analyte. 
 Should be within the same range as the 
sample concentrations. 
 Standard Methods recommends 5 to 50 times 
the MDL. 
 May be purchased “certified” from outside 
vendors. 
 Environmental Resource Associates 
 Hach, SPEX, VWR Scientific Products, and others
Standards 
 Standards should be analyzed 
 Each time an instrument is calibrated. 
 Once per sample batch. 
 Once per lot of reagents. 
 Standard percent recoveries should be 
within + 10% of the true value. 
 Exception: BOD5 standard should be 
within + 15% of the true value.
Percent Recovery Calculation 
 Certified Standard Concentration = 45.0 mg/L 
 Measured Standard Concentration = 42.0 
mg/L 
 Percent Recovery = (Measured 
Concentration / Certified Value)*100 
 % R = (42.0 / 45.0)*100 = 93.3%
Additional Quality Control 
 Spike Calculations 
 Sample Hold Times and Preservation 
 Instrument Calibration 
 Instrument Logs and Performance 
Checks 
 Accurate Record Keeping 
 Secondary Review of Calculations
Hold Times and Preservation 
Parameter Preservative Hold time 
Alkalinity 4oC 14 Days 
Ammonia Nitrogen H2SO4 to pH<2, 4oC 28 Days 
BOD5/CBOD5 4oC 48 Hours 
COD H2SO4 to pH<2, 4oC 28 Days 
Conductivity 4oC 28 Days 
Fecal coliforms 4oC 24 Hours 
Hardness HNO3 to pH<2, 4oC 28 Days 
Nitrate 4oC 48 Hours 
Nitrite 4oC 48 Hours 
Total Suspended Solids 4oC 7 Days 
Total Dissolved Solids 4oC 7 Days 
Total Solids 4oC 7 Days 
Trace Metals HNO3 to pH<2, 4oC 180 Days
Instrument Calibration 
 Minimum of a blank and one standard. 
 Standard Methods recommends a blank 
and THREE standards. 
 EVERY time the instrument is used or 
once per day.
Quality Assurance and Quality 
Control: Is it All Really 
Necessary? 
 Permitted Analyses vs. Analyses for 
Process Control 
 Remember! Process control decisions 
are only as good as the data they are 
based on.
We Do Analytical Work 
GOOD 
FAST 
and CHEAP 
Pick Any Two.
QA/QC by Standard Methods 
 Reagent Blanks – One per 20 Samples 
 Duplicates – One per 20 Samples 
 Spikes – One per 20 Samples 
 Instrument Calibration – Every Time 
Used 
 Calibration Blank and Three Standards 
 Not all QA/QC applies to every 
analysis.
Questions?

More Related Content

What's hot

WATER ANALYSIS /Water quality testing p.k.k
WATER ANALYSIS /Water quality testing p.k.kWATER ANALYSIS /Water quality testing p.k.k
WATER ANALYSIS /Water quality testing p.k.k
PUSHPA KHOLA
 
Water quality testing
Water quality testingWater quality testing
Water quality testing
Tarun kumar
 
ICP Presentation
ICP PresentationICP Presentation
ICP Presentation
K Thambi durai
 
Electrical conductivity
Electrical conductivityElectrical conductivity
Electrical conductivity
Vishal Chaudhari
 
Ashing techniques
Ashing techniques Ashing techniques
Ashing techniques
Selvaprakashnavaneethan
 
Water Sampling and analysis instruments
Water Sampling and analysis instruments Water Sampling and analysis instruments
Water Sampling and analysis instruments
Muhammad Abdullah
 
Water sampling ppt
Water sampling pptWater sampling ppt
Water sampling ppt
mohamoudjibrilahmed
 
Lab instruments & techniques (Water Treatment Plant)
Lab instruments & techniques (Water Treatment Plant) Lab instruments & techniques (Water Treatment Plant)
Lab instruments & techniques (Water Treatment Plant)
Phool Singh Kumpawat
 
TOC Workshop-1
TOC Workshop-1TOC Workshop-1
TOC Workshop-1
nvasoya
 
chemical oxygen demand -analysis using APHA manual
chemical oxygen demand -analysis using APHA manualchemical oxygen demand -analysis using APHA manual
chemical oxygen demand -analysis using APHA manual
SHERIN RAHMAN
 
Air quality sampling and monitoring m5
Air quality sampling and monitoring m5Air quality sampling and monitoring m5
Air quality sampling and monitoring m5
Bibhabasu Mohanty
 
Graphite furnace atomic absorption spectroscopy
Graphite furnace atomic absorption spectroscopyGraphite furnace atomic absorption spectroscopy
Graphite furnace atomic absorption spectroscopyAnuradha Verma
 
High volume air sampler
High volume air samplerHigh volume air sampler
sedimentation and its types
sedimentation and its typessedimentation and its types
sedimentation and its types
Mir Zafarullah
 
EQUIPMENTS TO CONTROL AIR POLLUTION
EQUIPMENTS TO CONTROL AIR POLLUTIONEQUIPMENTS TO CONTROL AIR POLLUTION
EQUIPMENTS TO CONTROL AIR POLLUTIONArun Sarasan
 
Gc ms
Gc msGc ms
CE8512- WATER & WASTE WATER ANALYSIS LAB MANUVAL
CE8512- WATER & WASTE WATER ANALYSIS LAB MANUVALCE8512- WATER & WASTE WATER ANALYSIS LAB MANUVAL
CE8512- WATER & WASTE WATER ANALYSIS LAB MANUVAL
Lokesh Kalliz
 
ICP / AAS Comparison
ICP / AAS ComparisonICP / AAS Comparison
ICP / AAS Comparison
Gamal Abdel Hamid
 
Solvent Extraction
Solvent ExtractionSolvent Extraction
Solvent Extraction
Suman Roy
 
Ion exchange process
Ion exchange processIon exchange process
Ion exchange process
sourabhrana21
 

What's hot (20)

WATER ANALYSIS /Water quality testing p.k.k
WATER ANALYSIS /Water quality testing p.k.kWATER ANALYSIS /Water quality testing p.k.k
WATER ANALYSIS /Water quality testing p.k.k
 
Water quality testing
Water quality testingWater quality testing
Water quality testing
 
ICP Presentation
ICP PresentationICP Presentation
ICP Presentation
 
Electrical conductivity
Electrical conductivityElectrical conductivity
Electrical conductivity
 
Ashing techniques
Ashing techniques Ashing techniques
Ashing techniques
 
Water Sampling and analysis instruments
Water Sampling and analysis instruments Water Sampling and analysis instruments
Water Sampling and analysis instruments
 
Water sampling ppt
Water sampling pptWater sampling ppt
Water sampling ppt
 
Lab instruments & techniques (Water Treatment Plant)
Lab instruments & techniques (Water Treatment Plant) Lab instruments & techniques (Water Treatment Plant)
Lab instruments & techniques (Water Treatment Plant)
 
TOC Workshop-1
TOC Workshop-1TOC Workshop-1
TOC Workshop-1
 
chemical oxygen demand -analysis using APHA manual
chemical oxygen demand -analysis using APHA manualchemical oxygen demand -analysis using APHA manual
chemical oxygen demand -analysis using APHA manual
 
Air quality sampling and monitoring m5
Air quality sampling and monitoring m5Air quality sampling and monitoring m5
Air quality sampling and monitoring m5
 
Graphite furnace atomic absorption spectroscopy
Graphite furnace atomic absorption spectroscopyGraphite furnace atomic absorption spectroscopy
Graphite furnace atomic absorption spectroscopy
 
High volume air sampler
High volume air samplerHigh volume air sampler
High volume air sampler
 
sedimentation and its types
sedimentation and its typessedimentation and its types
sedimentation and its types
 
EQUIPMENTS TO CONTROL AIR POLLUTION
EQUIPMENTS TO CONTROL AIR POLLUTIONEQUIPMENTS TO CONTROL AIR POLLUTION
EQUIPMENTS TO CONTROL AIR POLLUTION
 
Gc ms
Gc msGc ms
Gc ms
 
CE8512- WATER & WASTE WATER ANALYSIS LAB MANUVAL
CE8512- WATER & WASTE WATER ANALYSIS LAB MANUVALCE8512- WATER & WASTE WATER ANALYSIS LAB MANUVAL
CE8512- WATER & WASTE WATER ANALYSIS LAB MANUVAL
 
ICP / AAS Comparison
ICP / AAS ComparisonICP / AAS Comparison
ICP / AAS Comparison
 
Solvent Extraction
Solvent ExtractionSolvent Extraction
Solvent Extraction
 
Ion exchange process
Ion exchange processIon exchange process
Ion exchange process
 

Viewers also liked

The role of spatial models in applied ecological research
The role of spatial models in applied ecological researchThe role of spatial models in applied ecological research
The role of spatial models in applied ecological research
richardchandler
 
#11 The Sun as an Energy Source
#11 The Sun as an Energy Source#11 The Sun as an Energy Source
#11 The Sun as an Energy Source
stanwood
 
4.3 volumetric analysis
4.3 volumetric analysis4.3 volumetric analysis
4.3 volumetric analysisMartin Brown
 
Estimacion del tamaño de una muestra representativa de una población
Estimacion del tamaño de una muestra representativa de una poblaciónEstimacion del tamaño de una muestra representativa de una población
Estimacion del tamaño de una muestra representativa de una población
tutor03770
 
Sampling methods PPT
Sampling methods PPTSampling methods PPT
Sampling methods PPT
Vijay Mehta
 
sampling ppt
sampling pptsampling ppt
sampling ppt
Swati Luthra
 
Sampling and Sample Types
Sampling  and Sample TypesSampling  and Sample Types
Sampling and Sample Types
Dr. Sunil Kumar
 
RESEARCH METHOD - SAMPLING
RESEARCH METHOD - SAMPLINGRESEARCH METHOD - SAMPLING
RESEARCH METHOD - SAMPLING
Hafizah Hajimia
 

Viewers also liked (9)

The role of spatial models in applied ecological research
The role of spatial models in applied ecological researchThe role of spatial models in applied ecological research
The role of spatial models in applied ecological research
 
#11 The Sun as an Energy Source
#11 The Sun as an Energy Source#11 The Sun as an Energy Source
#11 The Sun as an Energy Source
 
4.3 volumetric analysis
4.3 volumetric analysis4.3 volumetric analysis
4.3 volumetric analysis
 
Estimacion del tamaño de una muestra representativa de una población
Estimacion del tamaño de una muestra representativa de una poblaciónEstimacion del tamaño de una muestra representativa de una población
Estimacion del tamaño de una muestra representativa de una población
 
SAMPLING
SAMPLINGSAMPLING
SAMPLING
 
Sampling methods PPT
Sampling methods PPTSampling methods PPT
Sampling methods PPT
 
sampling ppt
sampling pptsampling ppt
sampling ppt
 
Sampling and Sample Types
Sampling  and Sample TypesSampling  and Sample Types
Sampling and Sample Types
 
RESEARCH METHOD - SAMPLING
RESEARCH METHOD - SAMPLINGRESEARCH METHOD - SAMPLING
RESEARCH METHOD - SAMPLING
 

Similar to Representative sampling

SAMPLING.pptx for analystical chemistry sample techniques
SAMPLING.pptx for analystical chemistry sample techniquesSAMPLING.pptx for analystical chemistry sample techniques
SAMPLING.pptx for analystical chemistry sample techniques
rodneykiptoo8
 
CHEM526 fccu Lahore analytical chemistry notes in a presentation
CHEM526 fccu Lahore analytical chemistry notes in a presentationCHEM526 fccu Lahore analytical chemistry notes in a presentation
CHEM526 fccu Lahore analytical chemistry notes in a presentation
BakhitaMaryam1
 
AGS Members' Day 2015 - Educating Consultants on Laboratory Testing Presentation
AGS Members' Day 2015 - Educating Consultants on Laboratory Testing PresentationAGS Members' Day 2015 - Educating Consultants on Laboratory Testing Presentation
AGS Members' Day 2015 - Educating Consultants on Laboratory Testing Presentation
ForumCourt
 
Bagley_HNRS_CRM_talk_2015
Bagley_HNRS_CRM_talk_2015Bagley_HNRS_CRM_talk_2015
Bagley_HNRS_CRM_talk_2015Thomas Bagley
 
Instrumental method of chemical analysis
Instrumental method of chemical analysisInstrumental method of chemical analysis
Instrumental method of chemical analysis
PranaliDhulasavant1
 
Instrumentation For Process Control 09
Instrumentation For Process Control 09Instrumentation For Process Control 09
Instrumentation For Process Control 09GreggACunn
 
Method Development and Validation : Laser diffraction particle size analyzer ...
Method Development and Validation : Laser diffraction particle size analyzer ...Method Development and Validation : Laser diffraction particle size analyzer ...
Method Development and Validation : Laser diffraction particle size analyzer ...
Md. Saddam Nawaz
 
PREPARATION OF SAMPLES FOR ANALYSIS.ppt
PREPARATION OF SAMPLES FOR ANALYSIS.pptPREPARATION OF SAMPLES FOR ANALYSIS.ppt
PREPARATION OF SAMPLES FOR ANALYSIS.ppt
AbdiIsaq1
 
Quality control of tti
Quality control of ttiQuality control of tti
Quality control of tti
TransfusionMedicine1
 
Session 3C - Simple Methods of Water Quality & Quantity Determination
Session 3C - Simple Methods of Water Quality & Quantity DeterminationSession 3C - Simple Methods of Water Quality & Quantity Determination
Session 3C - Simple Methods of Water Quality & Quantity Determination
University of Nebraska EWB-USA Chapter
 
Basic Laboratory Techniques by university of Iown
Basic Laboratory Techniques  by university of IownBasic Laboratory Techniques  by university of Iown
Basic Laboratory Techniques by university of Iown
ShielaLinnBanate1
 
Sampling Procedure and Protocols
Sampling Procedure and ProtocolsSampling Procedure and Protocols
Sampling Procedure and Protocols
AdamRayManlunas1
 
5. discussion review method
5. discussion  review method5. discussion  review method
5. discussion review method
Noor Farahin
 
Item 10. GLOSOLAN inter-laboratory comparison procedure
Item 10. GLOSOLAN inter-laboratory comparison procedureItem 10. GLOSOLAN inter-laboratory comparison procedure
Item 10. GLOSOLAN inter-laboratory comparison procedure
Soils FAO-GSP
 
FDA Feedback Regarding Chemistry for Toxicological Risk Assessment – How to M...
FDA Feedback Regarding Chemistry for Toxicological Risk Assessment – How to M...FDA Feedback Regarding Chemistry for Toxicological Risk Assessment – How to M...
FDA Feedback Regarding Chemistry for Toxicological Risk Assessment – How to M...
Greenlight Guru
 
Chromatography & PCR
Chromatography & PCRChromatography & PCR
Chromatography & PCR
Dr. Yash Panchal
 
Basic Laboratory Techniques in university.pdf
Basic Laboratory Techniques in university.pdfBasic Laboratory Techniques in university.pdf
Basic Laboratory Techniques in university.pdf
QuocHungDao
 
IQ Academy Lunch & Learn Webinar | Cost Effective Water Quality Monitoring wi...
IQ Academy Lunch & Learn Webinar | Cost Effective Water Quality Monitoring wi...IQ Academy Lunch & Learn Webinar | Cost Effective Water Quality Monitoring wi...
IQ Academy Lunch & Learn Webinar | Cost Effective Water Quality Monitoring wi...
IQ_UK
 
Bagley_HNRS_CRM_talk_2015
Bagley_HNRS_CRM_talk_2015Bagley_HNRS_CRM_talk_2015
Bagley_HNRS_CRM_talk_2015Thomas Bagley
 
Preanalytical quality control practices in clinical laboratory
Preanalytical quality control practices in clinical laboratoryPreanalytical quality control practices in clinical laboratory
Preanalytical quality control practices in clinical laboratory
Dr. Rajesh Bendre
 

Similar to Representative sampling (20)

SAMPLING.pptx for analystical chemistry sample techniques
SAMPLING.pptx for analystical chemistry sample techniquesSAMPLING.pptx for analystical chemistry sample techniques
SAMPLING.pptx for analystical chemistry sample techniques
 
CHEM526 fccu Lahore analytical chemistry notes in a presentation
CHEM526 fccu Lahore analytical chemistry notes in a presentationCHEM526 fccu Lahore analytical chemistry notes in a presentation
CHEM526 fccu Lahore analytical chemistry notes in a presentation
 
AGS Members' Day 2015 - Educating Consultants on Laboratory Testing Presentation
AGS Members' Day 2015 - Educating Consultants on Laboratory Testing PresentationAGS Members' Day 2015 - Educating Consultants on Laboratory Testing Presentation
AGS Members' Day 2015 - Educating Consultants on Laboratory Testing Presentation
 
Bagley_HNRS_CRM_talk_2015
Bagley_HNRS_CRM_talk_2015Bagley_HNRS_CRM_talk_2015
Bagley_HNRS_CRM_talk_2015
 
Instrumental method of chemical analysis
Instrumental method of chemical analysisInstrumental method of chemical analysis
Instrumental method of chemical analysis
 
Instrumentation For Process Control 09
Instrumentation For Process Control 09Instrumentation For Process Control 09
Instrumentation For Process Control 09
 
Method Development and Validation : Laser diffraction particle size analyzer ...
Method Development and Validation : Laser diffraction particle size analyzer ...Method Development and Validation : Laser diffraction particle size analyzer ...
Method Development and Validation : Laser diffraction particle size analyzer ...
 
PREPARATION OF SAMPLES FOR ANALYSIS.ppt
PREPARATION OF SAMPLES FOR ANALYSIS.pptPREPARATION OF SAMPLES FOR ANALYSIS.ppt
PREPARATION OF SAMPLES FOR ANALYSIS.ppt
 
Quality control of tti
Quality control of ttiQuality control of tti
Quality control of tti
 
Session 3C - Simple Methods of Water Quality & Quantity Determination
Session 3C - Simple Methods of Water Quality & Quantity DeterminationSession 3C - Simple Methods of Water Quality & Quantity Determination
Session 3C - Simple Methods of Water Quality & Quantity Determination
 
Basic Laboratory Techniques by university of Iown
Basic Laboratory Techniques  by university of IownBasic Laboratory Techniques  by university of Iown
Basic Laboratory Techniques by university of Iown
 
Sampling Procedure and Protocols
Sampling Procedure and ProtocolsSampling Procedure and Protocols
Sampling Procedure and Protocols
 
5. discussion review method
5. discussion  review method5. discussion  review method
5. discussion review method
 
Item 10. GLOSOLAN inter-laboratory comparison procedure
Item 10. GLOSOLAN inter-laboratory comparison procedureItem 10. GLOSOLAN inter-laboratory comparison procedure
Item 10. GLOSOLAN inter-laboratory comparison procedure
 
FDA Feedback Regarding Chemistry for Toxicological Risk Assessment – How to M...
FDA Feedback Regarding Chemistry for Toxicological Risk Assessment – How to M...FDA Feedback Regarding Chemistry for Toxicological Risk Assessment – How to M...
FDA Feedback Regarding Chemistry for Toxicological Risk Assessment – How to M...
 
Chromatography & PCR
Chromatography & PCRChromatography & PCR
Chromatography & PCR
 
Basic Laboratory Techniques in university.pdf
Basic Laboratory Techniques in university.pdfBasic Laboratory Techniques in university.pdf
Basic Laboratory Techniques in university.pdf
 
IQ Academy Lunch & Learn Webinar | Cost Effective Water Quality Monitoring wi...
IQ Academy Lunch & Learn Webinar | Cost Effective Water Quality Monitoring wi...IQ Academy Lunch & Learn Webinar | Cost Effective Water Quality Monitoring wi...
IQ Academy Lunch & Learn Webinar | Cost Effective Water Quality Monitoring wi...
 
Bagley_HNRS_CRM_talk_2015
Bagley_HNRS_CRM_talk_2015Bagley_HNRS_CRM_talk_2015
Bagley_HNRS_CRM_talk_2015
 
Preanalytical quality control practices in clinical laboratory
Preanalytical quality control practices in clinical laboratoryPreanalytical quality control practices in clinical laboratory
Preanalytical quality control practices in clinical laboratory
 

More from Malla Reddy College of Pharmacy

Rna secondary structure prediction
Rna secondary structure predictionRna secondary structure prediction
Rna secondary structure prediction
Malla Reddy College of Pharmacy
 
Proteins basics
Proteins basicsProteins basics
Protein structure classification
Protein structure classificationProtein structure classification
Protein structure classification
Malla Reddy College of Pharmacy
 
Protein identication characterization
Protein identication characterizationProtein identication characterization
Protein identication characterization
Malla Reddy College of Pharmacy
 
Protein modeling
Protein modelingProtein modeling
Phylogenetic studies
Phylogenetic studiesPhylogenetic studies
Phylogenetic studies
Malla Reddy College of Pharmacy
 
Multiple sequence alignment
Multiple sequence alignmentMultiple sequence alignment
Multiple sequence alignment
Malla Reddy College of Pharmacy
 
Homology modeling tools
Homology modeling toolsHomology modeling tools
Homology modeling tools
Malla Reddy College of Pharmacy
 
Homology modeling
Homology modelingHomology modeling
Genome assembly
Genome assemblyGenome assembly
Genome analysis2
Genome analysis2Genome analysis2
Genome analysis
Genome analysisGenome analysis
Drug design intro
Drug design introDrug design intro
Data retrieval
Data retrievalData retrieval
Biological databases
Biological databasesBiological databases
Biological databases
Malla Reddy College of Pharmacy
 

More from Malla Reddy College of Pharmacy (20)

Rna secondary structure prediction
Rna secondary structure predictionRna secondary structure prediction
Rna secondary structure prediction
 
Proteomics
ProteomicsProteomics
Proteomics
 
Proteins basics
Proteins basicsProteins basics
Proteins basics
 
Protein structure classification
Protein structure classificationProtein structure classification
Protein structure classification
 
Protein identication characterization
Protein identication characterizationProtein identication characterization
Protein identication characterization
 
Protein modeling
Protein modelingProtein modeling
Protein modeling
 
Primerdesign
PrimerdesignPrimerdesign
Primerdesign
 
Phylogenetic studies
Phylogenetic studiesPhylogenetic studies
Phylogenetic studies
 
Multiple sequence alignment
Multiple sequence alignmentMultiple sequence alignment
Multiple sequence alignment
 
Homology modeling tools
Homology modeling toolsHomology modeling tools
Homology modeling tools
 
Homology modeling
Homology modelingHomology modeling
Homology modeling
 
Genome assembly
Genome assemblyGenome assembly
Genome assembly
 
Genome analysis2
Genome analysis2Genome analysis2
Genome analysis2
 
Genome analysis
Genome analysisGenome analysis
Genome analysis
 
Fasta
FastaFasta
Fasta
 
Drug design intro
Drug design introDrug design intro
Drug design intro
 
Drug design
Drug designDrug design
Drug design
 
Data retrieval
Data retrievalData retrieval
Data retrieval
 
Blast
BlastBlast
Blast
 
Biological databases
Biological databasesBiological databases
Biological databases
 

Representative sampling

  • 1. Representative Sampling and Laboratory QA/QC
  • 2. Agenda  Language of Sampling  Types of Samples  The Unspoken Assumptions  Ideal Sampling Locations  Data Quality Objectives  Examples: The Good, The Bad, and The Ugly
  • 3. Introduction  Sampling usually given little thought relative to analysis, even though critical.  Largest errors in results from sampling.  Samples are taken:  At the wrong place.  At the wrong time.  And of the wrong type. Result: Non-representative results.
  • 4. Samples vs. Populations  The population is the total or all of the possible answers we might get by sampling.  All of the individuals in this room.  Every 100 mL aliquot in 2 MG of influent.  We sample because we can’t count the whole population.
  • 5. Representative Samples What is representative?  Sample should represent or be typical of the wastewater it is collected from.  If the true value of BOD5 in the wastewater is 280 mg/L, then the sample should be close to this value.  How do we know the sample is representative?  Answer: Statistics
  • 6. Representative Samples  Representative samples should be very close to the mean value of the population.  How do we know we are close to the mean?  Look at the sample standard deviation.
  • 7. Population Characteristics 68% 95% 99% Mean or Average
  • 8. Standard Deviation  The standard deviation tells us how spread out the data are.  If the mean is 20 and stddev is 2, then 68% of all measurements are between 18 and 22.
  • 9. Types of Samples  Grab Samples  Exactly what it sounds like. One sample collected at a particular point and time.  Composite Samples  Multiple samples collected and added together to make one sample.  Time Composite.  Space Composite.  Flow Proportional Composite.  Manual versus Automatic
  • 10. Grab Samples  May be used where population is not changing suddenly or changing a great deal over time.  Must be used for particular analyses:  Residual chlorine.  Fecal coliform.  Also applicable for estimating performance under a given set of conditions.
  • 11. Composite Samples  Frequently used to estimate average values over a 24-hour period.  BOD5 loading to aeration tanks.  TSS leaving the WWTP in the effluent.  Gives information over a longer period of time or space.  Permit samples are often flow proportional composites.
  • 12. Composite Samples  Consideration must be given to sample handling and storage during compositing. We don’t want the sample characteristics to change while we are sampling.  Refrigeration often used to slow biological activity.  Chemicals may also be added as preservatives.
  • 13. How to Composite  Simple Composite – Add equal volumes of samples collected from different times or locations. Mix thoroughly.  Flow Proportional Composite – Volume of each subsample based on flow.  Estimate total volume of sample required.  Estimate total flow over sampling period.  Calculate sample volume per flow.
  • 14. Simple vs Flow Proportional Time Flow (MGD) NH3 -N Simple Flow Prop. Midnight 10 12 12 120 4 a.m. 15 15 15 225 8 a.m. 18 20 20 360 Noon 28 40 40 1120 4 p.m. 26 37 37 962 8 p.m. 14 14 14 196 NH3-N Conc, (mg/L) in Sample = 23.0 26.9 Avg Daily Flow 18.5 MGD Total Lbs - Simple 3549 Total Lbs - Proportional 4146 Difference of 15%
  • 15. Manual vs. Automatic  Manual samples are collected by hand.  Automatic samples are collected by machine.  Cautions for automatic samplers:  Not necessarily better.  Not accurate when collecting <20 mL.  Clean frequently; clogging.  Variable flows and intake location.
  • 16. Examples of Autosampler Misuse  The BOD5 Producing Equalization Basin.  The No-Flow at Low-Flow Problem.  The 1 Day MCRT Nitrifying Basin.
  • 17. Unstated Assumptions  For simplicity, we ASSUME that the population we are sampling from is:  Normally distributed.  Completely mixed. We also ASSUME that our sample value approximates the population mean.  These assumptions are not always true.
  • 18. Guidelines for Representative Sampling  Samples should be collected:  Only where wastewater is well-mixed.  In the center of the flow channel.  Horizontally and Vertically.  Avoids floating scum and settled solids.  Ensure that samplers and sample containers are clean, uncontaminated, and suitable for the planned analysis.
  • 19. Guidelines for Representative Sampling  Recommended Sample Containers:  HDPE appropriate for most analyses.  Trace metals, oil and grease, volatiles should be sampled in glass containers.  Pre-cleaned or sterilized containers for phosphorus testing and fecal coliforms. When compositing or aliquoting, mix samples well before pouring.
  • 20. Guidelines for Representative Sampling Wiers are not good sampling points.  Solids settle upstream of weirs.  Oils and greases build-up downstream.  Materials tend to collect on the sides and bottoms of channels. Avoid edges.  Before collecting the sample, rinse the sampler and sample container several times.
  • 21. Agenda  Language of Sampling  Types of Samples  The Unspoken Assumptions  Ideal Sampling Locations  Data Quality Objectives  Examples: The Good, The Bad, and The Ugly
  • 22. DQOs  There are a lot of choices in sampling. What type of sample to take. Where to collect the sample. What time of day to collect the sample.  How do we know what we need? What data quality objectives (DQOs) are all about.
  • 23. DQOs  A sampling and analysis plan of attack.  Plan of attack is determined by answering these questions:  Why are we taking the sample?  What do we want to know?  How will the data be used?  What level of QA/QC is needed?  Who will take the samples?
  • 24. Why Collect the Sample?  For process control:  Wasting calculations.  Calculation of unit process efficiency.  Estimating plant capacity.  For permitting:  Required analyses for DMR.  Required analyses for biosolids disposal.  Quantifying receiving water quality.
  • 25. What Do We Want to Know?  Seems like a simple question……  Often neglected in sampling and analysis plans.  Are we interested in:  Average performance?  Performance at peak load?  Dictates type of sample AND time of day.  Dictates sampling location.
  • 26. How Will the Data be Used?  Internally or externally?  Public access? Will results prompt capital expenditures?  Does data need to be legally defensible?  Dictates total number of samples, analysis method, and QA/QC needed.
  • 27. What level of QA/QC is Needed?  Field and laboratory?  Frequency of QA/QC Samples?  Permit required analysis – every time.  Process control – weekly perhaps.  Certified standards needed?  Outside laboratory involved?
  • 28. Who Will Take the Samples?  Daytime sampling and analysis not usually a problem, but….  Nights and graveyards? Week-ends?  May limit types of sampling to be done.  Autosamplers eliminate this problem, but still need to be checked.
  • 30. Plan of Attack  Why are we taking the sample?  What do we want to know?  How will the data be used?  What level of QA/QC is needed?  Who will take the samples?  Sampling location.  Grab or composite.  Frequency of sampling.  Analytes needed.  QA/QC required.
  • 31. Calculate MCRT  Where to collect samples?  Type of samples to collect?  If multiple basins are in use?  If basins are independent?
  • 32. Estimate TF Performance  For average performance.  For peak performance.  Develop DQOs.  What if there is recycle?
  • 34. Why Do We Do It?  To Check for Contamination  To Verify  Precision  Accuracy  To Determine if Interferences are Present  ENSURES DATA QUALITY and GIVES CONFIDENCE!
  • 35. Contamination  Results in a false positive.  Caused by dirty glassware and improper sampling or handling techniques  Can happen at any stage of sampling or analysis  Happens when we add something to the sample  Examples: Phosphorus, Fecal Coliforms, BOD5
  • 36. Precision versus Accuracy  Neither precise nor accurate.  Precise, but not accurate.  Accurate, but not precise.  Accurate and Precise. BOTH ARE NEEDED.
  • 37. Precision versus Accuracy Neither Precise Accurate Both
  • 38. Interferences  Substances in a sample that cause  False Positives  False Negatives  Look for Interferences at the time of analysis.
  • 39. How do we know if we are: Free of contamination? Accurate and precise? Lacking Interferences?
  • 41. Filter Blank Only needed when analyzing for dissolved substances.  Total Suspended Solids (TSS) Ortho-phosphorus
  • 42. Filter Blank  Checks for contamination during filtering.  Set up and clean filtration apparatus. Special cleaning should not be done for blanks.  Filter a volume of ultra-pure water.  The filtrate is the filter blank.  The filter blank should be treated like any other sample.
  • 43. Reagent Blank  Ultra-pure water analyzed as a sample.  Accounts for differences in reagents between lot numbers or batches. Often used to “auto-zero” and instrument.  Subtracts out background.  Can be a check for contamination.
  • 44. Limits for Blanks  Blank values should be less than the MDL. MDL = Method Detection Limit.  Lowest concentration used for reporting.  Calculated value that may be different for different laboratories and analysts.  See EPA method for how to calculate.
  • 45. Acceptable or Unacceptable? MDL for Nitrate test is 0.5 mg/L  Field blank reads 0.2 mg/L  Filter blank reads 1.7 mg/L  Reagent blank reads 0.1 mg/L  Sample results are higher than normal. What happened?
  • 47. Field Duplicate  A second sample taken at the same time and place as the original sample.  Placed into a separate sample bottle.  Checks whether or not the sample is representative.  Tells us how heterogeneous the population is.
  • 48. Relative Standard Difference  RSD = ( A - B) * 100 ((A+B)/2)  Where A = Original Sample Result B = Duplicate Result  Results from a field duplicate should agree within +/- 20% RPD of original sample.
  • 49. Relative Standard Difference  Original Sample Result – 300 mg/L BOD5  Duplicate Sample Result – 350 mg/L BOD5  Calculate the RPD 100*(300 – 350) ((300 + 350)/2) = (50/325)*100 = 15.4%  Within Limits?
  • 50. Lab Duplicate  Tests analyst’s ability to take a representative sample from the field sample.  Two aliquots are taken from the same sample bottle and subjected to the same sample preparation and analysis steps.  Don’t confuse a duplicate with a replicate. A replicate is a second reading from the same aliquot.
  • 51. Relative Standard Difference  Original Sample Result – 300 mg/L TSS  Duplicate Sample Result – 180 mg/L TSS  Calculate the RPD 100*(300 – 180) ((300 + 180)/2) = (120/240)*100 = 50.0% WHAT HAPPENED?
  • 53. Standards  Contain a known concentration of analyte.  Should be within the same range as the sample concentrations.  Standard Methods recommends 5 to 50 times the MDL.  May be purchased “certified” from outside vendors.  Environmental Resource Associates  Hach, SPEX, VWR Scientific Products, and others
  • 54. Standards  Standards should be analyzed  Each time an instrument is calibrated.  Once per sample batch.  Once per lot of reagents.  Standard percent recoveries should be within + 10% of the true value.  Exception: BOD5 standard should be within + 15% of the true value.
  • 55. Percent Recovery Calculation  Certified Standard Concentration = 45.0 mg/L  Measured Standard Concentration = 42.0 mg/L  Percent Recovery = (Measured Concentration / Certified Value)*100  % R = (42.0 / 45.0)*100 = 93.3%
  • 56. Additional Quality Control  Spike Calculations  Sample Hold Times and Preservation  Instrument Calibration  Instrument Logs and Performance Checks  Accurate Record Keeping  Secondary Review of Calculations
  • 57. Hold Times and Preservation Parameter Preservative Hold time Alkalinity 4oC 14 Days Ammonia Nitrogen H2SO4 to pH<2, 4oC 28 Days BOD5/CBOD5 4oC 48 Hours COD H2SO4 to pH<2, 4oC 28 Days Conductivity 4oC 28 Days Fecal coliforms 4oC 24 Hours Hardness HNO3 to pH<2, 4oC 28 Days Nitrate 4oC 48 Hours Nitrite 4oC 48 Hours Total Suspended Solids 4oC 7 Days Total Dissolved Solids 4oC 7 Days Total Solids 4oC 7 Days Trace Metals HNO3 to pH<2, 4oC 180 Days
  • 58. Instrument Calibration  Minimum of a blank and one standard.  Standard Methods recommends a blank and THREE standards.  EVERY time the instrument is used or once per day.
  • 59. Quality Assurance and Quality Control: Is it All Really Necessary?  Permitted Analyses vs. Analyses for Process Control  Remember! Process control decisions are only as good as the data they are based on.
  • 60. We Do Analytical Work GOOD FAST and CHEAP Pick Any Two.
  • 61. QA/QC by Standard Methods  Reagent Blanks – One per 20 Samples  Duplicates – One per 20 Samples  Spikes – One per 20 Samples  Instrument Calibration – Every Time Used  Calibration Blank and Three Standards  Not all QA/QC applies to every analysis.