WATER ANALYSIS /Water quality testing p.k.k
•
37 likes•6,584 views

This document discusses water quality testing parameters and methods. It notes that water contains contaminants and periodic testing is needed to ensure safety. Key physical, chemical, and biological characteristics are examined, including odor, temperature, pH, total solids, dissolved solids, suspended solids, alkalinity, hardness, calcium, chloride, fluoride, phosphate, sulfate, nitrate, oil and grease, and dissolved oxygen. Methods like titration, spectrophotometry, and incubation are described. Indian drinking water standards provide guidelines for parameters like TDS, pH, and hardness. Equipment used in analysis includes spectrophotometers, pH/TDS meters, COD digesters, and TSS filter assemblies. Regular water testing

Recommended
More Related Content
What's hot
What's hot (20)
Viewers also liked
Viewers also liked (20)
Similar to WATER ANALYSIS /Water quality testing p.k.k
Similar to WATER ANALYSIS /Water quality testing p.k.k (20)
Recently uploaded
Recently uploaded (20)
WATER ANALYSIS /Water quality testing p.k.k
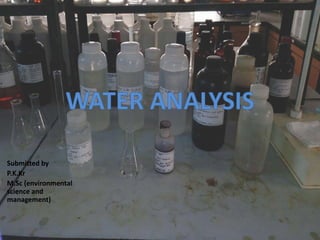
- 1. Submitted by P.K.Kr M.Sc (environmental science and management)
- 2. WATER QUALITY TESTING? • solvent of life • Nearly all water in the world contains contaminants • The only way to ensure safety of your water supply is to have a periodic laboratory water analysis done
- 3. Determination of Water quality Physical characteristics Chemical characteristics Biological characteristics
- 4. WATER TESTING PARAMETERS ODOUR • Most organic and some inorganic chemicals contribute • odour Rotten egg, Musty, Chemical • Unobjectionable odour TEMPERATURE • Thermometer • 15⁰-25⁰C pH • natural water PH range of 4 to 9 • pH meter
- 5. WATER TESTING PARAMETERS • Total Solids • filtrable or non-filtrable residue remains • TDS + TSS TS • Total dissolved solids • TDS Meters • Range 1-20,000mg/lTDS • Total suspended solids • Filtration assembly • 1-10,000mg/l TSS
- 6. WATER TESTING PARAMETERS • Titratable bases carbonate, bicarbonate ,and hydroxide • contributions from borates, phosphates, silicates, or other bases • Titrimetric Method • Range -2-4,000mg/l Alkalinity • Capacity of water to precipitate soap • calcium and magnesium ions present • Titrimetric Method . • Range 2-2,000mg/l Hardness
- 7. WATER TESTING PARAMETERS • Calcium carbonate (calcite) and calcium-magnesium carbonate (dolomite). • Titrimetric Method • Range -1 to >500 mg/L Calcium • Titrimetric Method • Range – 2 – 10000mg/lChloride
- 8. WATER TESTING PARAMETERS (using Spectrophotometer ) Fluoride • High concentration – dental fluorosis • Less concentration - dental caries (> 0.8 mg/l ) • Range – 0.1 – 10mg/l • Zirconium colorimetric Method Phosphate • promotes growth micro-organisms • Stannous Chloride Method • Range – 0.01 – 100mg/l
- 9. WATER TESTING PARAMETERS (using Spectrophotometer ) • occur in natural waters • Sulphates cause scaling, odour and corrosion due to H2S formation • Spectrophotometric Method • Range – 2 – 2000mg/l Sulphate • Growth stimulation of plants cause objectionable eutrophication • Blue baby disease in infants • Spectrophotometric method • Range – 1 – 100mg/l Nitrate Nitrogen (NO3 -)
- 10. WATER TESTING PARAMETERS OIL & GREASE -Cause 23-28 % of (SSO) - Insoluble in water & Harm to aquatic life -Partition Gravimetric Method - Range – 1-25mg/l
- 11. DISSOLVED OXYGEN (DO) • Amount of oxygen dissolved in 1L of water at given time and temperature • Key test in water pollution • Range - fresh water 6-12mg/l - river water 10-15 mg/l - sea water(surface) 8- 12 mg/l - sea water (bottom) ~0.5-6 mg/l
- 12. DISSOLVED OXYGEN (DO) • DO in Drinking water - Desirable limit 15 mg/l - Permissible limit >6 mg/l • Winkler Method • Calculation – DO mg/l = 4*X X = Volume of ThioSulphate Solution used for titration
- 13. BOD • BIOLOGICAL OXYGEN DEMAND (BOD) : determine the relative oxygen requirements • Aerobic oxidation of decomposable organic matter • Controlled conditions of temperature and incubation period • Finding out the level of pollution
- 14. BOD • Titrimetric method • Instrument - BOD Incubator • Calculation – BOD(mg/l) = D1-D5 D1 = DO of diluted sample immediately after preparation, mg/L, D5 = DO of diluted sample after 5 d incubation at 20°C, mg/L
- 15. BOD Quality class Designated best use BOD value A Drinking water source without conventional treatment but with chlorination 2 or less B Drinking water source with conventional treatment 3 or less Table : Guideline BOD values for classification of raw untreated water (Source : CPCB, July 2001)
- 16. Chemical Oxygen Demand(COD) • Definition ...... • Important for measuring organic strength • Amount of a specified oxidant that reacts with the sample under controlled conditions
- 17. Chemical Oxygen Demand(COD) • Digestion/Titrimetric method • Instrument – COD Digester • Range – 0 -200mg/l • Calculation – COD mg/l = (A-B)N x 8000/V A = Volume in ml of FAS Solution used in the titration in the blank B = Volume in ml of FAS Solution used in the titration with the sample N = Normality of standard FAS Solution V = Volume in ml of the sample taken for the test (FAS - ferrous ammonium sulphate)
- 18. Indian Standards For Drinking Water S.No Parameters Desirable limit Permissible limit 1 Odour Unobjectionable Unobjectionable 2 PH 6.5 – 8.5 No relaxation 3 Temperature[23.1] 15⁰C 23⁰C 4 TDS (mg/l) 500 2000 5 Alkalinity (mg/l) 200 600 6 Hardness ( mg/l) 200 600 7 Calcium (mg/l) 75 200 8 Chloride ( mg/l) 250 1 000 9 Fluoride (mg/l) 1.0 1.5 10 Phosphate - - 11 Sulphate (mg/l) 200 400 12 Nitrate Nitrogen 45 No relaxation 13 Nitrite Nitrogen - - 14 Aluminum 0.03 mg/l 0.2 mg/l 15 Oil & Grease - - 16 Dissolved Oxygen(DO) (mg/l) 15 >6
- 19. Equipments Used Water Analysis SPECTROPHOTOMETER PH /TDS METER
- 20. Equipments Used Water Analysis COD DIGESTER UNIT TSS FILTER ASSEMBLY
- 22. SUBMIT TED TO AMITY SCHOOL OF EARTH AND ENVIRONMENTAL SCIENCE (ASEES) AUH
Editor's Notes
- Sanitary sewage overflow (sso)