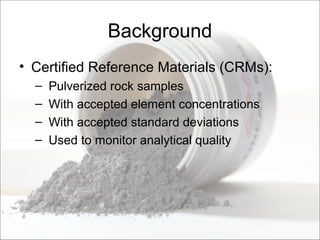
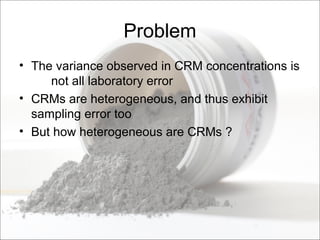
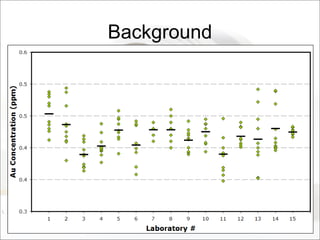
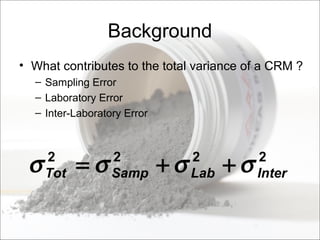
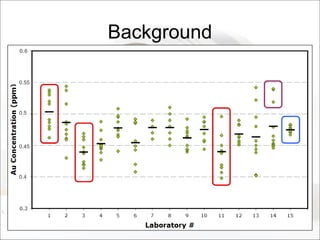
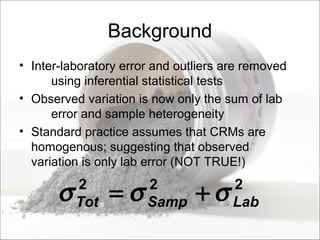
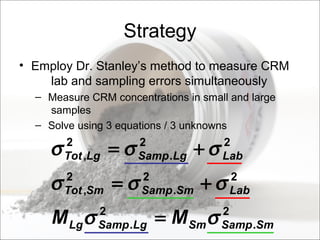
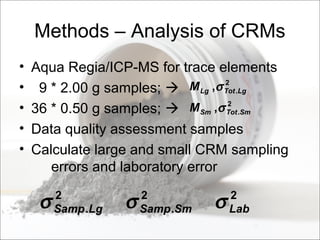
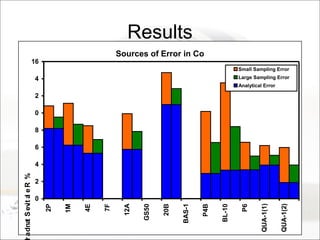
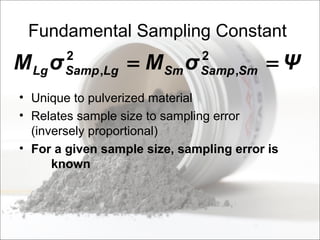
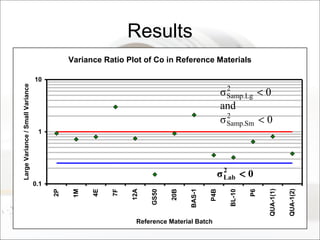
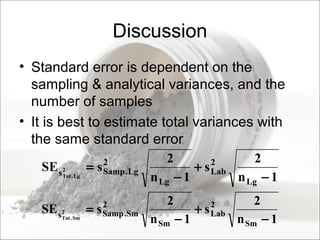
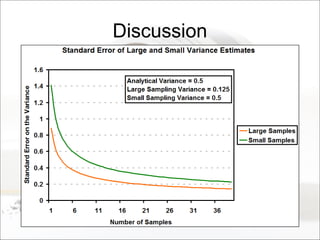
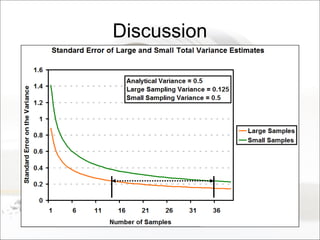
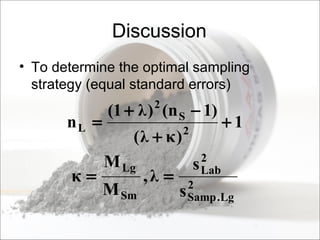
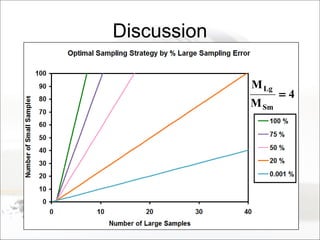
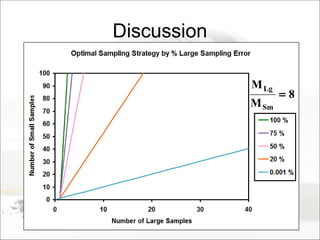
This document summarizes a study to determine the heterogeneity of certified reference materials (CRMs). The researchers analyzed multiple small and large samples of various CRMs to measure sampling error and laboratory error separately. They found that CRMs exhibit both sampling error and laboratory error, contradicting the standard assumption that CRMs are homogenous. The researchers developed a method using the variance of small and large samples to calculate sampling error and laboratory error simultaneously. They conclude CRM manufacturers should provide sampling error measurements and analytical procedures should aim to optimize precision.
This thesis aims to determine the heterogeneity of reference materials used in geochemical analysis. Reference materials are assumed to be homogeneous, but some variation in results could be due to sampling error from heterogeneity rather than just laboratory error. The researcher measures the concentration of elements in both small and large samples of reference materials. Using statistical analysis, this allows determining the magnitudes of sampling error and laboratory error simultaneously. The results indicate that reference materials do exhibit some heterogeneity, so sampling error contributes to total variation. Knowing the sampling error is important for accurately assessing analytical quality using reference materials.
4th SEALNET meeting, item 8: Training on internal quality control - Overview ...Soils FAO-GSP
Overview of internal quality control measures - Rob De Hayr, GLOSOLAN Vice-Chair
4th Asian Soil Laboratory Network (SEALNET) meeting (online), 30 June - 2 July 2020
According to Quality by Design (QbD) concept, quality should be built into product/method during pharmaceutical/analytical development. Recently, Design of Experiments (DoE) have been widely used to understand the effects of multidimensional and interactions of input factors on the output responses of pharmaceutical products and analytical methods.
Countries’ presentation on internal quality control: China 1ExternalEvents
The second lab managers’ meeting of the South-East Asia Laboratory NETwork (SEALNET) took place on 19 - 23 November 2018 in ICAR-IISS (Indian Institute of Soil Science), Bhopal, India.
Ms. Liping Yang , China National Center for Quality Supervision and Test of Chemical Fertilizers, Beijing, 2nd Day
4th SEALNET meeting, item 8: Training on internal quality control - Preparing...Soils FAO-GSP
How to prepare and use internal quality control soil samples - Rob De Hayr, GLOSOLAN Vice-Chair
4th Asian Soil Laboratory Network (SEALNET) meeting (online), 30 June - 2 July 2020
Steps to consider when developing analytical methods in your laboratory. Most important validation criteria to consider, including tips on how to remain relevant.
DOE Applications in Process Chemistry Presentationsaweissman
The document discusses how design of experiments (DOE) can help optimize chemical reactions and processes in a more efficient manner than traditional trial-and-error approaches. It provides examples of how pharmaceutical companies have used DOE to reduce costs and improve yields for key reaction steps. DOE allows researchers to systematically vary multiple reaction factors at once to understand their effects and interactions, requiring fewer total experiments than one-factor-at-a-time testing.
Lot-by-Lot Acceptance Sampling for AttributesParth Desani
This document discusses acceptance sampling for attributes, including lot-by-lot sampling. It covers single sampling plans, the operating characteristic curve, designing sampling plans, and Military Standard 105E/ANSI Z1.4, the most widely used sampling standard. MS 105E uses acceptable quality levels and inspection levels to determine sampling plans from tables for single, double, or multiple sampling. [/SUMMARY]
This document discusses military standards for acceptance sampling, including Military Standard 105E and Military Standard 414. MIL STD 105E provides sampling schemes for attributes data using single, double, or multiple sampling plans. It describes normal, tightened, and reduced inspection levels based on a vendor's quality history. MIL STD 414 provides variables acceptance sampling plans that use sample sizes based on lot size and inspection level, assuming the quality characteristic is normally distributed. It includes plans based on sample standard deviation, range, and known process standard deviation. The document provides examples of using these standards to determine acceptance sampling plans.
The document discusses quality assurance and quality control procedures for laboratories. It defines key terms like quality management system, quality assurance, and quality control. It describes important QA/QC activities laboratories should implement including using standardized methods, quality control samples and charts, equipment maintenance, competent staff, corrective actions, reporting unambiguous results, proficiency testing, method validation, auditing, data management, and root cause analysis. Specific quality control procedures discussed include running blanks, in-house quality control samples, replicates, certified reference materials, inter-laboratory comparison programs, standard solutions, drift check standards, and recovery spikes. Acceptance criteria for some quality control checks are provided as examples.
Quantitation techniques used in chromatographyVrushali Tambe
This document discusses various quantitative techniques used in chromatography, including external standard, internal standard, standard addition, and area normalization methods. The external standard method involves preparing calibration standards of known concentrations and constructing a calibration curve. The internal standard method uses an internal reference compound added to both samples and standards. The standard addition method determines an unknown concentration by adding increasing amounts of standard to the sample. Area normalization relies on the detector response being proportional to amount without reference standards. Multiple-point standardization and internal standards help account for matrix effects and instrument drift.
Advanced DOE with Minitab (presentation in Costa Rica)Blackberry&Cross
This document describes using a split-plot design for a wind tunnel experiment to optimize the aerodynamic performance of a racecar. The experiment had 4 factors, with 2 that were hard-to-change (front and rear ride heights) and 2 that were easy-to-change (yaw angle and grill cover). A split-plot design was used to reduce the total time needed, collecting data from 45 runs over 10 hours instead of 36 runs over 30 hours. The analysis accounted for two sources of error and showed several significant factors for improving downforce and reducing drag.
Prepared By : Shilpi Rajput (Analyst)
For detailed explanation of one of the most significant characteristic of method validation - Repeatability. Repeatability is the phenomenon where tests are conducted on identical test subjects with the same method, with the same method in short span of time.
This document discusses preliminary operations for analytical sample preparation, including sampling, mixing, crushing, drying, dissolution, filtration, and specifications for analytical equipment.
The key points are:
1) Proper sampling methodology is important to obtain a representative sample for analysis. Factors like sample size and sampling location impact representativeness.
2) Initial sample preparation steps like mixing, crushing, and drying aim to produce a homogeneous, reduced-size sample for further processing and analysis.
3) Analytical techniques like dissolution, filtration, and use of analytical balances and volumetric glassware require specifications and procedures to ensure accuracy and precision.
Acceptance sampling is a quality control technique where a random sample is taken from a lot and used to determine whether to accept or reject the entire lot. It aims to inspect a portion of items to draw a conclusion about the quality of the whole lot in a cost-effective manner. Key aspects include defining acceptance quality limits, sampling risks, developing sampling plans involving sample size and acceptance/rejection criteria, and understanding operating characteristic curves showing the probability of acceptance at different quality levels. The technique helps improve overall quality while reducing inspection costs and risks compared to 100% inspection.
This document discusses the classification and minimization of errors in analytical chemistry. It describes two main types of errors: systematic (determinate) errors, which include operational, instrumental, methodological and additive/proportional errors; and random (indeterminate) errors, which vary unpredictably between measurements. The document then outlines several methods to minimize errors, such as calibrating instruments, running blanks and control samples, using independent analytical methods, performing replicate analyses, and employing standard addition, internal standards, amplification or isotopic dilution techniques.
This document discusses different types of acceptance sampling plans including single sampling plans, double sampling plans, multiple sampling plans, and sequential sampling plans. It notes that double sampling plans may reduce the total amount of required inspection compared to single sampling plans by allowing lots to be accepted or rejected after inspecting a smaller first sample. Double sampling also allows rejecting a lot without completing inspection of the second sample.
Instrumentation deals with theoretical and practical aspects of analytical instruments and techniques. It involves separating, identifying, and determining components in a sample. Key aspects of analytical chemistry include classifying analytes by concentration, selecting appropriate techniques based on factors like required accuracy and sample size, and properly sampling, preparing, separating, and analyzing samples. Data is then evaluated to address the original analytical problem.
Methods of minimizing errors in chemical analysis involve careful calibration of apparatus, running blanks to account for impurities, using control determinations with standard substances, employing independent analytical methods for comparison, and performing parallel or duplicate determinations. Accuracy refers to how close a measurement is to the true value, while precision describes the agreement between repeated measurements of the same quantity. Significant figures indicate the certainty of measured values and help to properly calculate and report results.
Theory of hplc_quantitative_and_qualitative_hplcVanya Dimcheva
This document discusses quantitative HPLC analysis. It defines quantitative analysis as determining the concentration of a compound in a sample by comparing the response of an unknown sample to known standard samples of various concentrations. It outlines the key steps in quantitative analysis including establishing a method, analyzing standard samples to generate a calibration curve, analyzing unknown samples, and comparing the unknown response to the standard curve to determine concentration. It also discusses some chromatographic requirements for robust quantitative analysis such as separated peaks, symmetrical peak shapes, and stable baselines.
This document provides an introduction and definitions for terms relevant to the determination of inorganic analytes. It discusses sample handling and preservation, digestion or preparation, and analytical methods. Key terms defined include calibration blank, calibration curve, calibration standards, continuing calibration verification, dissolved metals, instrument detection limit, laboratory control sample, linear range, lower limit of quantitation, method blank, and method of standard addition. The document provides background information on analytical techniques and considerations for selecting an appropriate total analysis protocol.
This document discusses external and internal standardization techniques for quantitative analysis using high performance liquid chromatography (HPLC). External standardization involves preparing solutions of a reference standard at known concentrations, measuring peak areas, and generating a calibration curve to determine unknown concentrations. Internal standardization adds a known amount of internal standard compound to samples and standards, and quantifies unknowns based on peak area ratios and a calibration curve plotting ratios of analytical standard to internal standard areas versus concentration ratios. The internal standardization method is commonly used for gas chromatography as it avoids needing to know exact injection amounts.
Method Validation - Limit of Detection, Quantitation limits and Robustnesslabgo
Prepared By: Shruti Vij (Senior Analyst) , Geeta Mathur(Senior Scientist) ,Khushbu ( Analyst)
This slide show contains detailed explanation of three characteristics of method validation- Limit of detection, Quantitation limits and Robustness. Limit of detection is the minimum amount of substance that can be detected but not measured, quantitation limit is the minimum amount of substance which can be detected and measured. Common approach to these procedures- signal to noise ratio has also been covered. Robustness is a characteristic which determines a method’s reliability when deliberate variations are induced in parameters.
These slides provide an overview of the basics of design of experiments. They also describe and give examples of categorical and continuous factors and responses, discrete numeric and mixture variables, and blocking factors. The slides were presented live and in recorded videos as part of the Mastering JMP webcast series. Watch the webcasts at http://www.jmp.com/mastering
This document discusses acceptance sampling, which is used to determine whether to accept or reject a sample based on predetermined quality levels. It defines key terms and outlines the advantages and disadvantages. Various sampling plans are described, including single, double, and multiple sampling plans. The operating characteristic curve is explained as a graph showing the probability of accepting lots at various quality levels. Producers' and consumers' risks are defined. Examples are provided to demonstrate calculating acceptance probabilities using Poisson distributions and constructing operating characteristic curves.
Acceptance sampling is a statistical quality control technique where a random sample is taken from a lot to determine whether the lot should be accepted or rejected. Key terms include acceptable quality level (AQL), lot tolerance percent defective (LTPD), sampling plans, producers risk, consumers risk, attributes and variables. Advantages are that it is less expensive and damaging than 100% inspection, while disadvantages include the risks of rejecting good lots or accepting bad lots. An exercise demonstrates how to determine a sampling plan using AQL, LTPD and reference tables.
In manufacturing operations, production management includes responsibility for product and process design, planning and control issues involving capacity and ...
1st NENALAB Meeting_Item 32: Perform QA/QC in the lab by Rob De Hayr, GLOSOLA...Soils FAO-GSP
This document discusses quality assurance and quality control procedures for laboratories. It defines quality assurance as the planned and systematic implementation of a quality management system, while quality control checks that lab methods are performing as expected. It outlines several key aspects of a quality system including standardized methods, quality control samples, equipment maintenance, trained staff, corrective actions, and data management. The document also provides specific examples of quality control procedures laboratories can implement, such as running blanks, replicates, reference materials, and inter-laboratory comparisons. The goal is to ensure quality, accuracy, and consistency in laboratory testing.
Control of analytical quality using stable control materials postgradMedhatEldeeb2
This document discusses quality control basics for analytical testing methods. It defines internal and external quality control and describes how control materials of known concentration are used to monitor test performance. The key aspects covered include:
- Types of errors such as random errors and systematic errors
- Criteria for selecting stable control materials with acceptable concentration ranges
- Calculations for mean, standard deviation, and quality control limits
- The Levey-Jennings chart for graphing quality control results over time
- Westgard rules for identifying errors based on the number of controls tested
- Identifying trends or shifts that indicate problems requiring troubleshooting
Normalization of Large-Scale Metabolomic Studies 2014Dmitry Grapov
This document discusses approaches for normalizing large-scale metabolomics data to minimize analytical variance and remove non-biological artifacts. It describes common normalization methods like analytical standards, quality control-based normalization using LOESS or batch ratios, and variance stabilizing transformations. The document also presents two case studies on normalizing over 5,500 metabolomics samples from the TEDDY study using different normalization approaches like LOESS, batch ratio, qcISTD, and their combinations to minimize analytical variance from over 100 batches and better reveal true biological trends.
Data Normalization Approaches for Large-scale Biological StudiesDmitry Grapov
Overview of how to estimate data quality and validate normalization approaches to remove analytical variance.
See here for animations used in the presentation:
http://imdevsoftware.wordpress.com/2014/06/04/using-repeated-measures-to-remove-artifacts-from-longitudinal-data/
Item 2. Verification and Validation of Analytical MethodsSoils FAO-GSP
This document discusses the validation and verification of analytical test methods used at the Environmental Analysis Laboratory at Southern Cross University. It provides details on key validation parameters including accuracy, precision, selectivity, linearity, matrix effects, sensitivity, spike recoveries, trueness, range, ruggedness, and measurement uncertainty. Validation data is presented for methods analyzing metals and salts in freshwater, effluent, and wastewater samples by ICP-MS. The methods were verified to meet performance criteria in these sample matrices.
CHEM526 fccu Lahore analytical chemistry notes in a presentationBakhitaMaryam1
This document provides an overview of analytical techniques and quality control for chemical analysis. It discusses various techniques including spectroscopy, chromatography, electrophoresis and electroanalytical methods. It covers topics like sampling, sample preparation, quality assurance, accuracy, precision, limits of detection, and chromatography parameters. The document is intended as course content for an analytical chemistry class.
Planning of experiment in industrial researchpbbharate
This document discusses key concepts in the design of experiments. It begins with definitions of systems and processes, and defines an experiment as a test where input variables are deliberately changed to observe their effects on outputs. The objectives of experiments are identified as understanding factor effects and developing models. Basic principles for experimental design are outlined, including randomization, replication, and blocking. Guidelines are provided for various steps in designing an experiment, from problem definition to statistical analysis and conclusions. Examples are given throughout to illustrate experimental design concepts.
The document proposes a novel approach called PaDMTP for path directed source test case generation and prioritization using metamorphic testing in Python. It aims to address limitations in traditional testing like incomplete coverage and lack of automation. The approach generates test cases using Python constraint solving and prioritizes them using path tracing. It was implemented on sample programs and evaluated against random and adaptive random testing using mutation analysis, showing improved fault detection effectiveness with PaDMTP.
This document discusses laboratory errors and quality control in clinical testing. It describes three types of errors - pre-analytical, analytical, and post-analytical. Pre-analytical errors can occur before the sample reaches the lab due to improper patient preparation, collection, storage, or transport. Analytical errors occur during testing and can be due to issues with samples, equipment, reagents, or operator technique. Post-analytical errors involve improper result reporting. The document emphasizes the importance of quality control, calibration, and statistical analysis to monitor performance and identify errors. Quality control charts can reveal random errors or systematic shifts and trends.
Quality Control for Quantitative Tests by Prof Aamir Ijaz (Pakistan)Aamir Ijaz Brig
This document provides an overview of quality control and quality assurance processes in a chemical pathology laboratory. It discusses key terms like quality control, quality assurance, internal quality control, external quality assurance. It also describes different types of errors like random error and systematic error. The document explains statistical concepts like measures of central tendency, standard deviation, coefficient of variation. It discusses the Westgard rules for evaluating quality control results and triggering investigations into potential errors. The goal of the lecture is to describe the processes involved in quality management for chemical pathology laboratories.
The analyst is required to analyze a number of QC samples throughout the run where there are decisions to be made based on a window of acceptance for each QC sample analyzed.
This document discusses quality control in clinical laboratory testing. It emphasizes that quality control is essential to provide reliable diagnostic reports and cost-effective patient care. Quality control involves monitoring precision, accuracy, and sources of variation through internal quality control, external quality assessment, and statistical analysis of control values using tools like control charts and Westgard rules. The goal is to minimize laboratory errors and reliably distinguish pathological variations in patient samples.
This content is suitable for medical technologists/technicians/lab assistants/scientists writing the SMLTSA board exam. The content is also suitable for biomedical technology students and people also interested in learning about test methodologies used in medical technology. This chapter describes test quality assurance (QA) and quality control (QC). Please note that these notes are a collection I used to study for my board exam and train others who got distinctions using these.
Disclaimer: Credit goes to those who wrote the notes and the examiners of each exam question. Please use only as a reference guide and use your prescribed textbook for the latest and most accurate notes and ranges. The material here is not referenced as it is a collection of pieces of study notes from multiple people, and thus will not be held viable for any misinterpretations. Please use at your own discretion.
The document discusses internal quality control procedures in a medical laboratory. It defines internal quality control and explains the three main stages - pre-analytical, analytical, and post-analytical - that need to be controlled. It describes the process for internal quality control, including using control materials, establishing statistical limits, and interpreting quality control data using rules like Westgard's multi-rules. The document emphasizes the importance of root cause analysis when quality control is out of control and comparing internal quality control with external quality assessment.
This document discusses analytical chemistry and instrumentation methods. It introduces analytical chemistry as determining the chemical composition of samples through qualitative and quantitative analysis. It then describes common analytical approaches, including identifying problems, designing experiments, conducting experiments, analyzing data, and proposing solutions. The document outlines classical and instrumental analytical methods and key considerations for selecting methods. It also defines important figures of merit for methods and discusses calibration techniques like external standards, standard additions, and internal standards.
The document discusses quality control in clinical laboratories. It defines total quality management and the five Qs of quality management. Quality control refers to technical procedures used in quality assurance programs to control pre-analytical, analytical, and post-analytical variables in order to reduce errors. Key aspects of quality control include establishing standard operating procedures, training staff, collecting and analyzing quality control data using control charts, and implementing corrective actions when quality control rules are violated. The goal of quality control is to ensure high quality healthcare and accurate diagnosis and treatment of diseases.
Asia Pesticide Residue Mitigation through the Promotion of Biopesticides and ...apaari
Asia Pesticide Residue Mitigation through the Promotion of Biopesticides and Enhancement of Trade Opportunities (APRMP), Virtual lab meeting
13 August 2020
quality control in clinical laboratory DrmanarEmam
The document discusses quality control, quality assurance, and quality assessment in medical laboratories. It defines each term and describes their related but distinct roles. Quality control refers to statistical processes used during each test run to verify test accuracy and precision. Quality assurance describes the overall program that ensures correct final test results. Quality assessment challenges the quality programs through proficiency testing to evaluate the quality of reported results. The document provides details on quality control measurements and rules to monitor test performance over time and determine if tests are in or out of control.
1. Determining the Heterogeneity
of Reference Materials
Thomas Bagley, Dr. Cliff Stanley, Dr. John Murimboh
Depts. of Earth & Environmental Science and Chemistry
Acadia University
2. Acknowledgements
Grants Participating Laboratories &
CRM Manufacturers
• Acadia Faculty Research
Funding
• Canada Summer Jobs Funding
•MAC Student Research Funding
•SEG Student Research Funding
• ACME Analytical Labs, Vancouver
• Bureau Veritas, Perth
• African Mineral Standards,
Johannesburg Geostats Proprietary,
Vancouver
• CDN Resource Laboratories
• Ore Research/Exploration, Melbourne
• Rocklabs, Auckland
3. Background
• Certified Reference Materials (CRMs):
– Pulverized rock samples
– With accepted element concentrations
– With accepted standard deviations
– Used to monitor analytical quality
4.
5. Background
• How are CRMs used ?
– Analyzed in a batch of samples
• CRM measured concentrations are
compared with accepted concentrations to
monitor accuracy
– CRM measured concentrations are compared
with each other to monitor precision
– These provide an assessment of data quality
for the batch
7. Background
• How are CRMs prepared ?
– Pulverized
– Homogenized
– Sub-sampled
– Chemically analyzed
(in multi-lab round robin)
– Statistically analyzed
(to remove outliers)
8. Problem
• The variance observed in CRM concentrations is
not all laboratory error
• CRMs are heterogeneous, and thus exhibit
sampling error too
• But how heterogeneous are CRMs ?
10. Background
• What contributes to the total variance of a CRM ?
– Sampling Error
– Laboratory Error
– Inter-Laboratory Error
2222
InterLabSampTot σσσσ ++=
12. Background
• Inter-laboratory error and outliers are removed
using inferential statistical tests
• Observed variation is now only the sum of lab
error and sample heterogeneity
• Standard practice assumes that CRMs are
homogenous; suggesting that observed
variation is only lab error (NOT TRUE!)
222
LabSampTot σσσ +=
14. Strategy
• Employ Dr. Stanley’s method to measure CRM
lab and sampling errors simultaneously
– Measure CRM concentrations in small and large
samples
– Solve using 3 equations / 3 unknowns
2
.
2
.
22
.
2
,
22
.
2
,
SmSampSmLgSampLg
LabSmSampSmTot
LabLgSampLgTot
MM σσ
σσσ
σσσ
=
+=
+=
15. Methods – Analysis of CRMs
• Aqua Regia/ICP-MS for trace elements
• 9 * 2.00 g samples;
• 36 * 0.50 g samples;
• Data quality assessment samples
• Calculate large and small CRM sampling
errors and laboratory error
2
.
2
.
,
,
SmTotSm
LgTotLg
M
M
σ
σ
22
.
2
. LabSmSampLgSamp σσσ
16. Sources of Error in Co
0
2
4
6
8
10
12
14
16
2P
1M
4E
7F
12A
GS50
20B
BAS-1
P4B
BL-10
P6
QUA-1(1)
QUA-1(2)
%RSD
Small Sampling Error
Large Sampling Error
Analytical Error
Results%RelativeStanda
17. Fundamental Sampling Constant
• Unique to pulverized material
• Relates sample size to sampling error
(inversely proportional)
• For a given sample size, sampling error is
known
ΨσMσM SmSampSmLgSampLg == 2
,
2
,
18. Results
Variance Ratio Plot of Co in Reference Materials
0.1
1
10
2P
1M
4E
7F
12A
GS50
20B
BAS-1
P4B
BL-10
P6
QUA-1(1)
QUA-1(2)
Reference Material Batch
LargeVariance/SmallVariance
02
Lab <σ
0
and
0
2
Sm.Samp
2
Lg.Samp
<
<
σ
σ
19. Discussion
• The large & small sampling, and
laboratory variances exhibit error
• Sampling and Laboratory error
measurements are dependent on
adequate total variance estimates
• How do we achieve adequate estimates of
the total variance?
20. Discussion
• Standard error is dependent on the
sampling & analytical variances, and the
number of samples
• It is best to estimate total variances with
the same standard error
1n
2
s
1n
2
sSE
Lg
2
Lab
Lg
2
Lg.Samps2
Lg.Tot
−
+
−
=
1n
2
s
1n
2
sSE
Sm
2
Lab
Sm
2
Sm.Samps2
Sm.Tot
−
+
−
=
23. Discussion
• To determine the optimal sampling
strategy (equal standard errors)
1
)(
)1n()1(
n 2
S
2
L +
+
−+
=
κλ
λ
2
Lg.Samp
2
Lab
Sm
Lg
s
s
,
M
M
== λκ
26. Conclusions
• Reference material heterogeneity it is
not zero
• Fundamental sampling constants can be
used to estimate sampling error at
different sample masses
• CRM manufacturers should provide
fundamental sampling constants with their
accepted values
• Analytical procedures should be designed
to optimize standard error on the variance
27. Future work
• Investigate the controls on sampling
strategy, to maximize precision
• Develop QAQC methods that
accommodate reference material
heterogeneity
28. References
• Stanley, C.R. 2007. The Fundamental Relationship
Between Sample Mass and Sampling Variance in Real
Geological Samples and Corresponding Statistical
Models. Exploration and Mining Geology, 16: 109-123.
• Stanley, C.R., and Smee, B.W. 2007. Strategies for
Reducing Sampling Errors in Exploration and Resource
Definition Drilling Programmes for Gold Deposits.
Geochemistry: Exploration, Environment, Analysis, 7: 1-
12.
• Stanley, C.R, O'Driscoll, N., and Ranjan, P. 2010.
Determining the magnitude of true analytical error in
geochemical analysis. Geochemistry: Exploration,
Environment, Analysis, 10: 355–364
Editor's Notes
Geoscientists commonly use geochemistry to address geological and environmental problems. The geological samples are sent to the lab, and the results indicate the major or trace element compositions. But how do we know that the results are true to the sample?
Geoscientists send reference material with the batch of geological samples. Reference materials have an accepted concentration, so the quality of the analysis can be assessed from the result. My thesis concerns the heterogeneity of reference materials – how reproducible are the results from reference materials? Current practice assumes they are homogeneous, and attributes any variation to lab error.
Certified reference materials are pulverized rock or soil samples. They are useful in quality assessment/quality control (QAQC) because they are attributed with an accepted concentration & error.
Certified Reference Materials (CRMs) are used by the mining/resource and environmental industries to monitor analytical quality. Certified reference materials are sent with a batch of samples for analysis. To assess accuracy, the measured concentration can be compared to the accepted concentration. To measure precision, the results can be compared against themselves.
This is an example of a traditional control chart. Each CRM is plotted in the order that it was analyzed, from left to right.
The concentration is represented on the y axis. The control chart has tolerances above and below the mean (1, 2 and 3 SD). Samples are unlikely to have concentrations outside 2SD from the mean, and very unlikely to have concentrations outside 3SD from the mean. In this chart there is an acceptable variation in the results from an analysis. A sample beyond 2SD would probably not be an outlier, but multiple samples beyond 2 SD would be anomalous. There also aren’t any obvious patterns. Patterns can be cause for concern – they can indicate problems like contamination. If one of two crushers is contaminated then the results on a control chart would alternate high – low.
The rock or soil sample is pulverized in a ball mill.
The sample are blended. homogenized
Sub samples are taken from the population which has been ‘homogenized’.
The sub samples are analyzed at external labs in a ‘round robin’ analysis.
Statistical processes are applied to remove outliers from the round robin: t-test (iso 5725), z-test, iso/iec 43-1, iso 3207..
http://upload.wikimedia.org/wikipedia/commons/c/c2/Ball_mill.gif
Image of a ball mill from google images
http://bestservices.co.in/images/equipment/ball-mill-dry-type.jpg
Despite the best efforts of the manufacturer, the homogenization is imperfect – the CRMs are heterogeneous
Also, segregation can occur during shipping – graded bedding
Therefore, the mining industry cannot use CRMs to monitor analytical quality unless the magnitudes of their heterogeneity are known.
So, how heterogeneous are CRMs?
This diagram shows the results from a round robin CDN-GS-P4B. What contributes to the variation that we see?
Variance (gesture toward a sigma) is the standard deviation squared, it represents the spread of the data. Variation is high when replicate values differ significantly in concentration. Variance describes the magnitude of error. There are three sources of variation in a certification/round-robin:
Sampling error is the heterogeneity of the sample – this is relevant to all elements. Gold is especially prone to high sampling error (nuggets..)
Laboratory error is introduced during the analysis – variation in reagent quality, internal pressure in the mass spec, flame flicker..
Inter lab error is introduced when the labs in the round robin produce different distributions.
Here is our round-robin again:
The red labs produced results that differ from the other labs, they’re outlying labs. (different means)
The purple results from lab 14 differ substantially from most of lab 14’s results, and are outlying samples.
Statistical procedures are used to distinguish outliers in this sort of scenario, to improve the quality of the certification.
Also notice that the blue lab was much more precise than the other labs, this can happen if they analyze using a larger sample mass.
By removing the outliers we also remove the inter-lab error.
Since inter-lab error has been removed, the error equation becomes: (gesture toward the equation on ppt)
This is the point where it has generally been assumed that the reference material is homogeneous and that the total variation is lab error. THIS IS NOT TRUE, BUT IT IS STANDARD PRACTICE.
To improve the quality assessment methods, we must be able to determine the magnitude of the sampling error.
There is a statistical approach that was developed by my supervisor, Dr Cliff Stanley that’s separates sample and lab error.
It is known that the sample mass is proportional to sampling error. Assuming lab error to be constant then the sample error can be determined.
In this way, sampling error and lab error can both be determined.
The lab procedure was developed with Dr John Murimboh. This is the summary of the procedure that we use for each batch of samples. There are large and small samples, measured in replicate to estimate the variance. The procedure blank + control sample are for QAQC purposes
Using this procedure we estimate each error:
Small sampling error
Large sampling error
Lab error
The method allows us to determine the sampling error for both the large and small samples, and the analytical error. These graphs illustrates the relative proportions of analytical and sampling error for large and small samples. The small samples have much more sampling error! No surprise there! Samples that have no bars plotted did not produce valid estimates of sampling error and analytical error (to be discussed in detail later on)
More background:
In the last graphs we saw that the sampling error was smaller for large samples. It turns out that the variance is inversely proportional to sample mass. That is, they multiply to define a constant, the fundamental sampling constant (FSC). The FSC can be used to compare homogeneity, and it allows us to CALCULATE THE ERROR AT ANY SAMPLE MASS – very practical information for QAQC.
The ratio of the total variances determines if the sampling and analytical errors can be decomposed. The lower tolerance is equal to the mass ratio (Ms/ML = 0.25 in this case), the upper tolerance is 1: the large total variance equalling the small total variance. Above the upper tolerance, negative sampling errors result and below the lower tolerance we get negative analytical errors.
The cause of failed sampling & analytical error estimates is likely to be a low standard error on the total variance (caused by too few replicates or an ineffective sampling strategy). How can we achieve the best estimates?
Standard error on the total variance is a function of the sampling & analytical error, and the number of samples. The best strategy to maximize the precision of the analytical and sampling error estimates is to make the standard error of the large total variance equal to the standard error on the small total variance (Stanley & Smee 2007).
Analytical variance is equal to the small sampling variance in this diagram, the large sampling variance is ¼ of the small sampling variance for a sample mass 4 times the size (Stanley 2007).
Small samples need to be analyzed more times (as expected) to achieve the same standard error
2) The optimal sampling strategy uses the same standard error on the variance for both large and small samples; 36 and 15 in this case (we would have achieved more consistent results with fewer invalid estimates had we used 15 large samples instead of 9)
The previous example was for fixed sampling and analytical errors
The sampling strategy changes depending on the proportions of sampling and analytical error. This system models the number of small to large samples that it takes to achieve an equal standard error on the total variances.
The optimal proportion of small to large samples to analyze based on the % large sampling variance (of the large total variance). The orange line is the same case that we examined previously (50% sm. Sampling error), not that 15 large samples to approximately 36 small samples.
This diagram also illustrates that the sampling strategy for a reference material exhibiting no sampling error is an equal proportion of large and small samples, a case where there is only analytical error (slope = 1, blue line, 0.001%). The sampling strategy for a reference material that exhibits only sampling error (a perfect geochemical analysis!) would use a proportion of 1:16 large to small samples (slope of 16), when using a large sample mass 4 times the small sample mass.
By using samples with twice the difference (1:8 instead of 1:4 by mass), the number of large samples is greatly decreased – only 8 would need to be analyzed for 36 small samples.