Downloaded 150 times

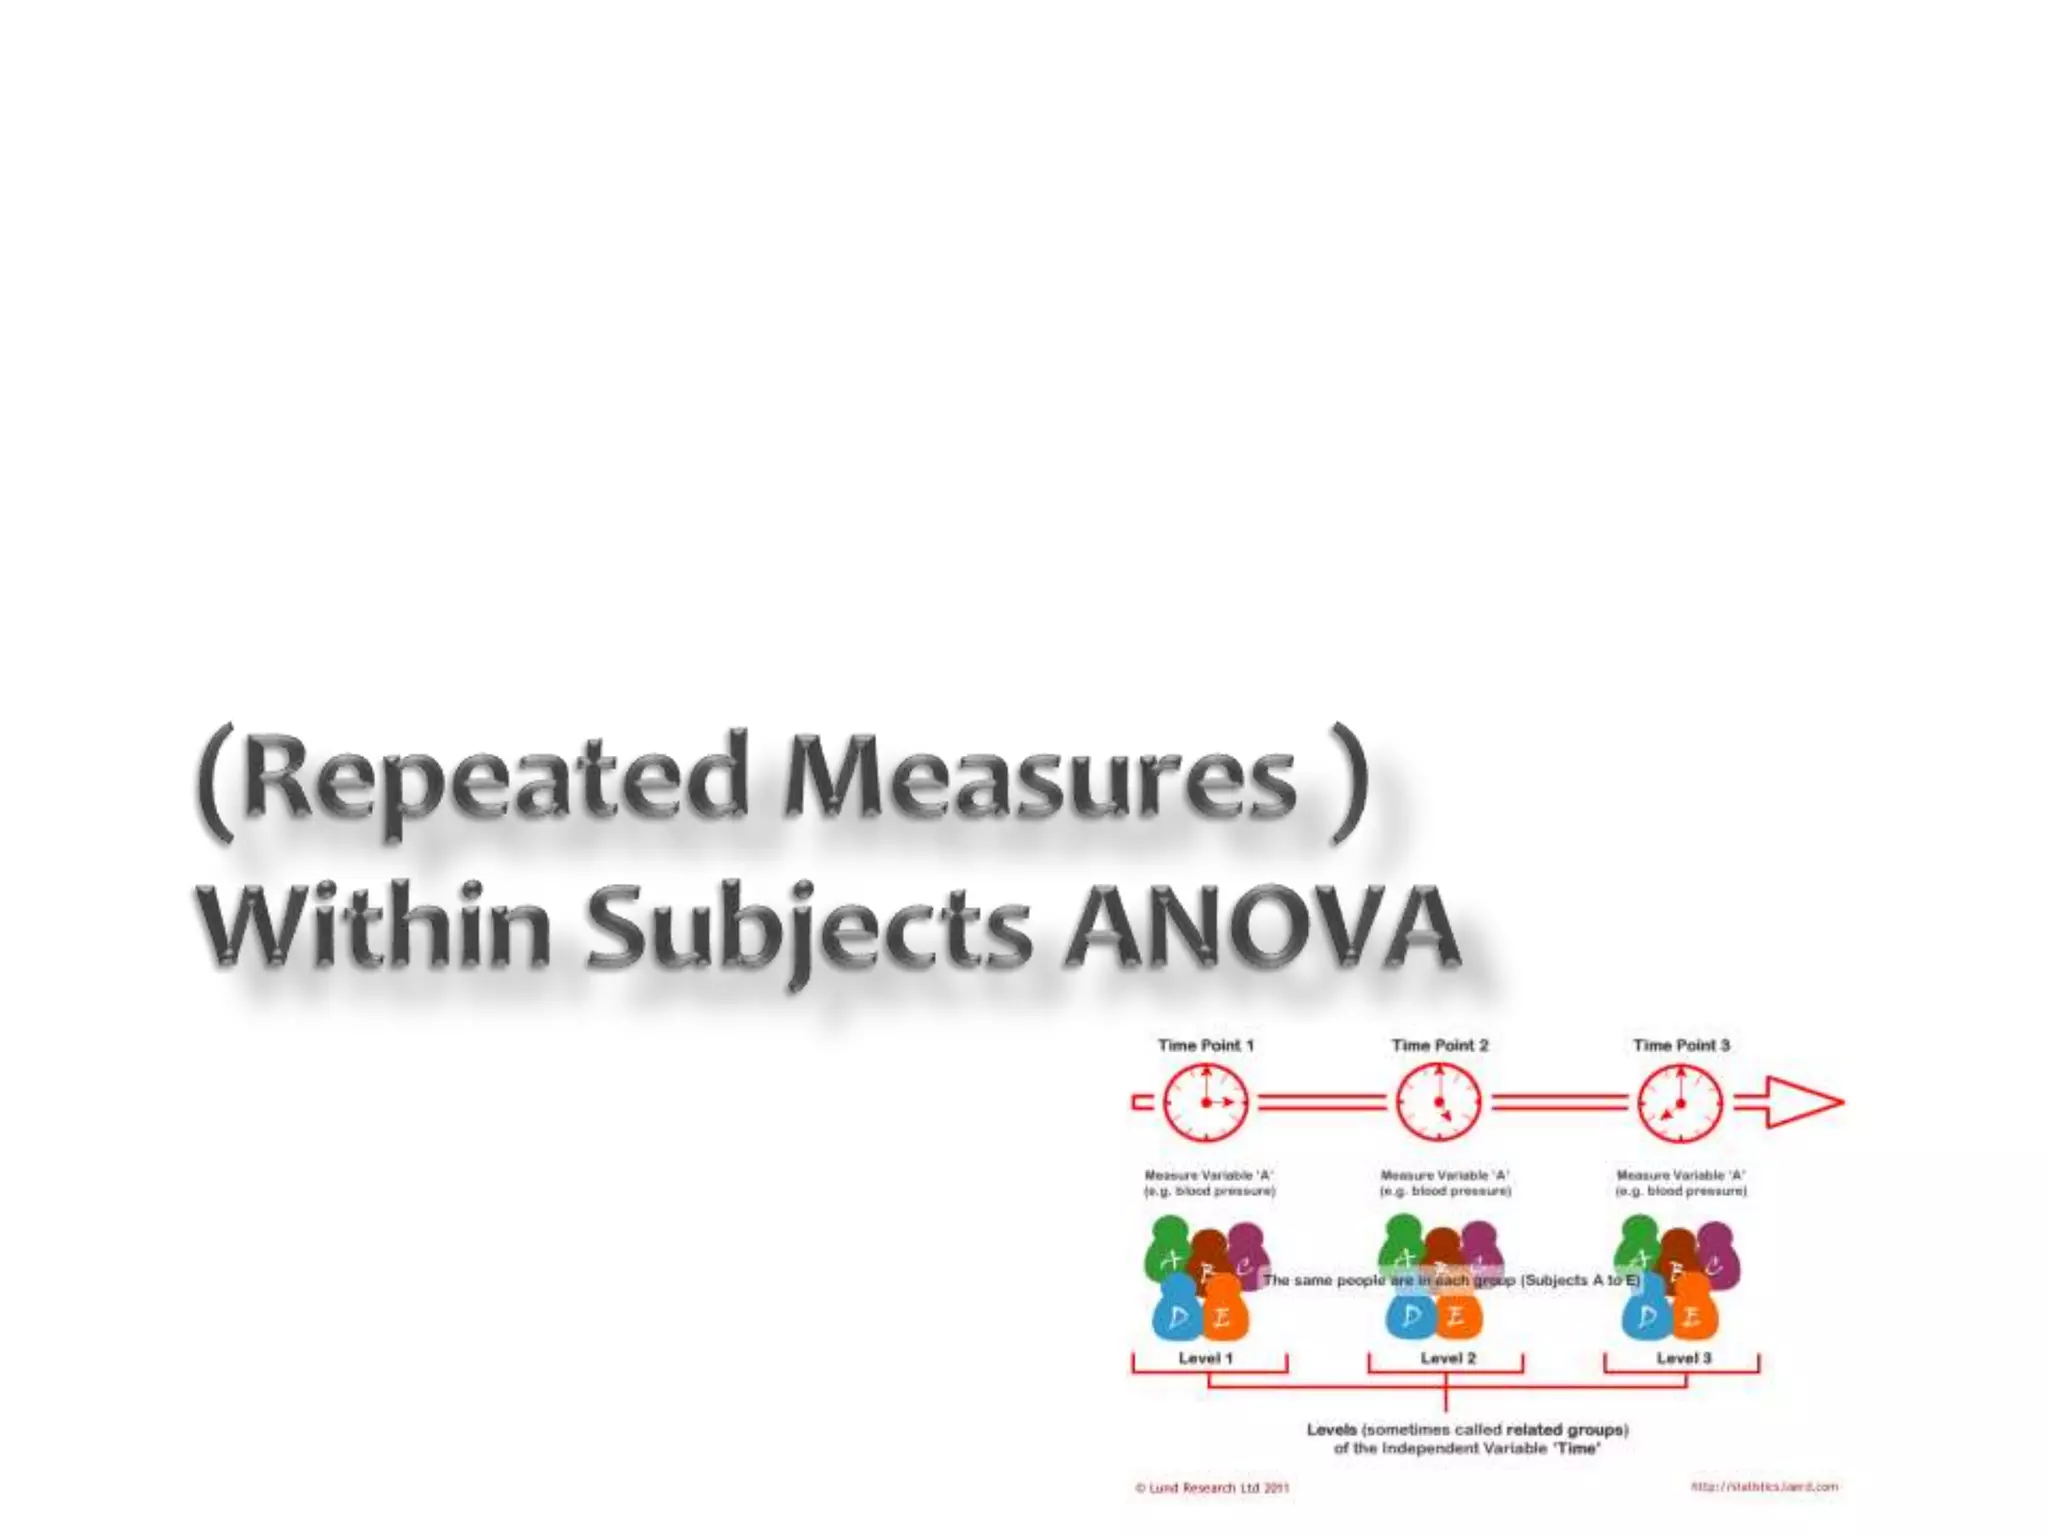
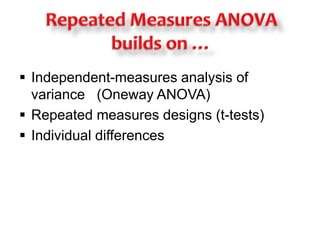
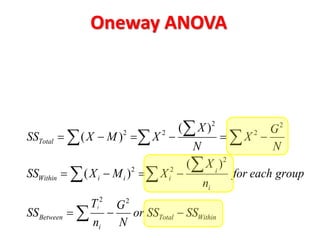
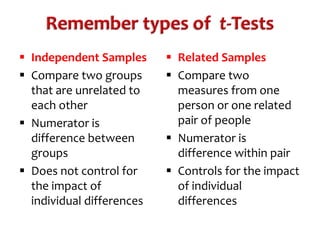
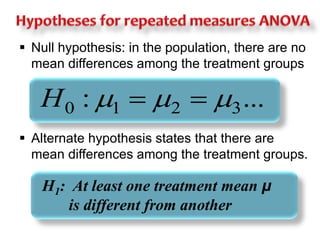
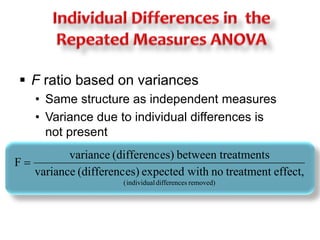
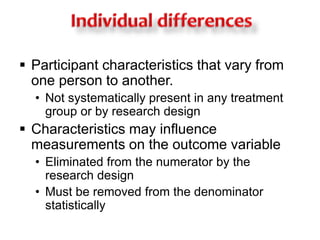
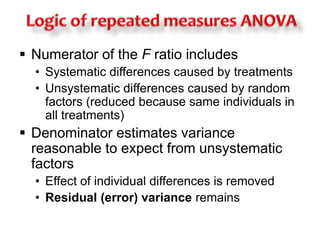
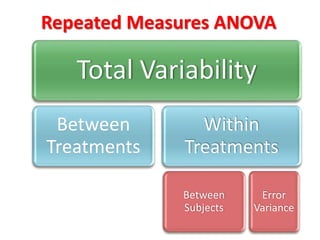
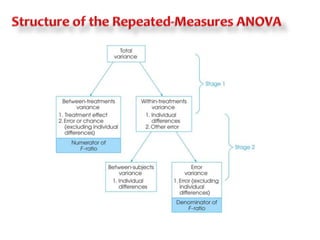
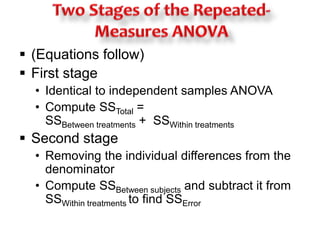

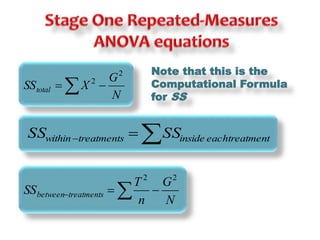
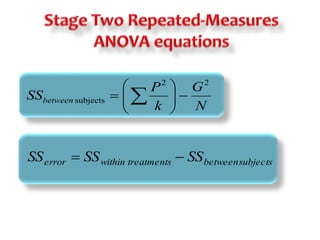
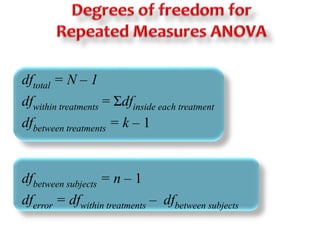
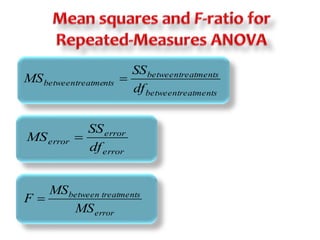
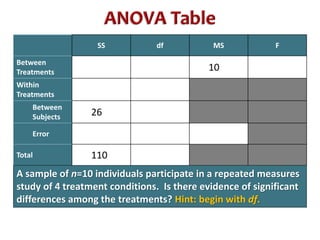
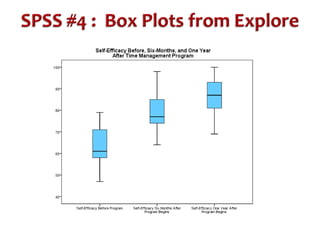
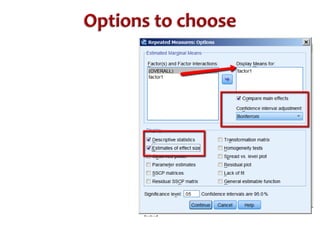
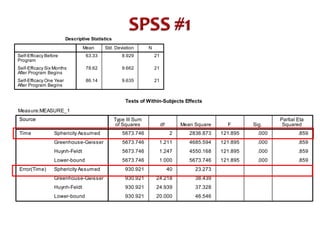
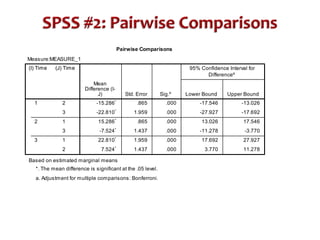
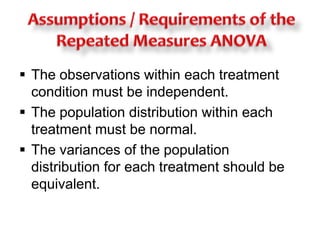
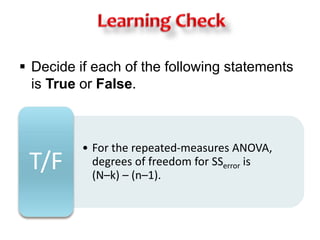
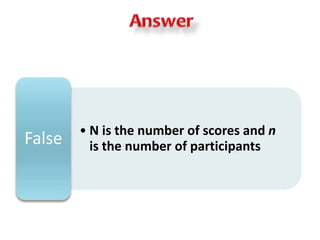
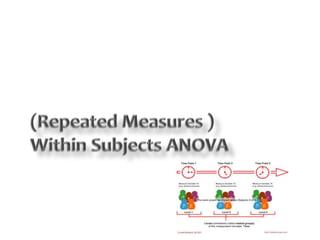

This document discusses repeated measures analysis of variance (ANOVA). It explains that repeated measures ANOVA compares measures taken on the same subjects across different treatment conditions, controlling for individual differences. It provides the computational formulas for calculating sums of squares for between treatments, between subjects, and error. It also discusses degrees of freedom, mean squares, and the F-ratio test used to determine if there are significant differences among treatment means while accounting for correlations between measures from the same subject.


![Lecture 5_Analysis of Variance [ANOVA].pptx](https://cdn.slidesharecdn.com/ss_thumbnails/lecture5analysisofvarianceanova-260107181555-9a697733-thumbnail.jpg?width=640&height=640&fit=bounds)