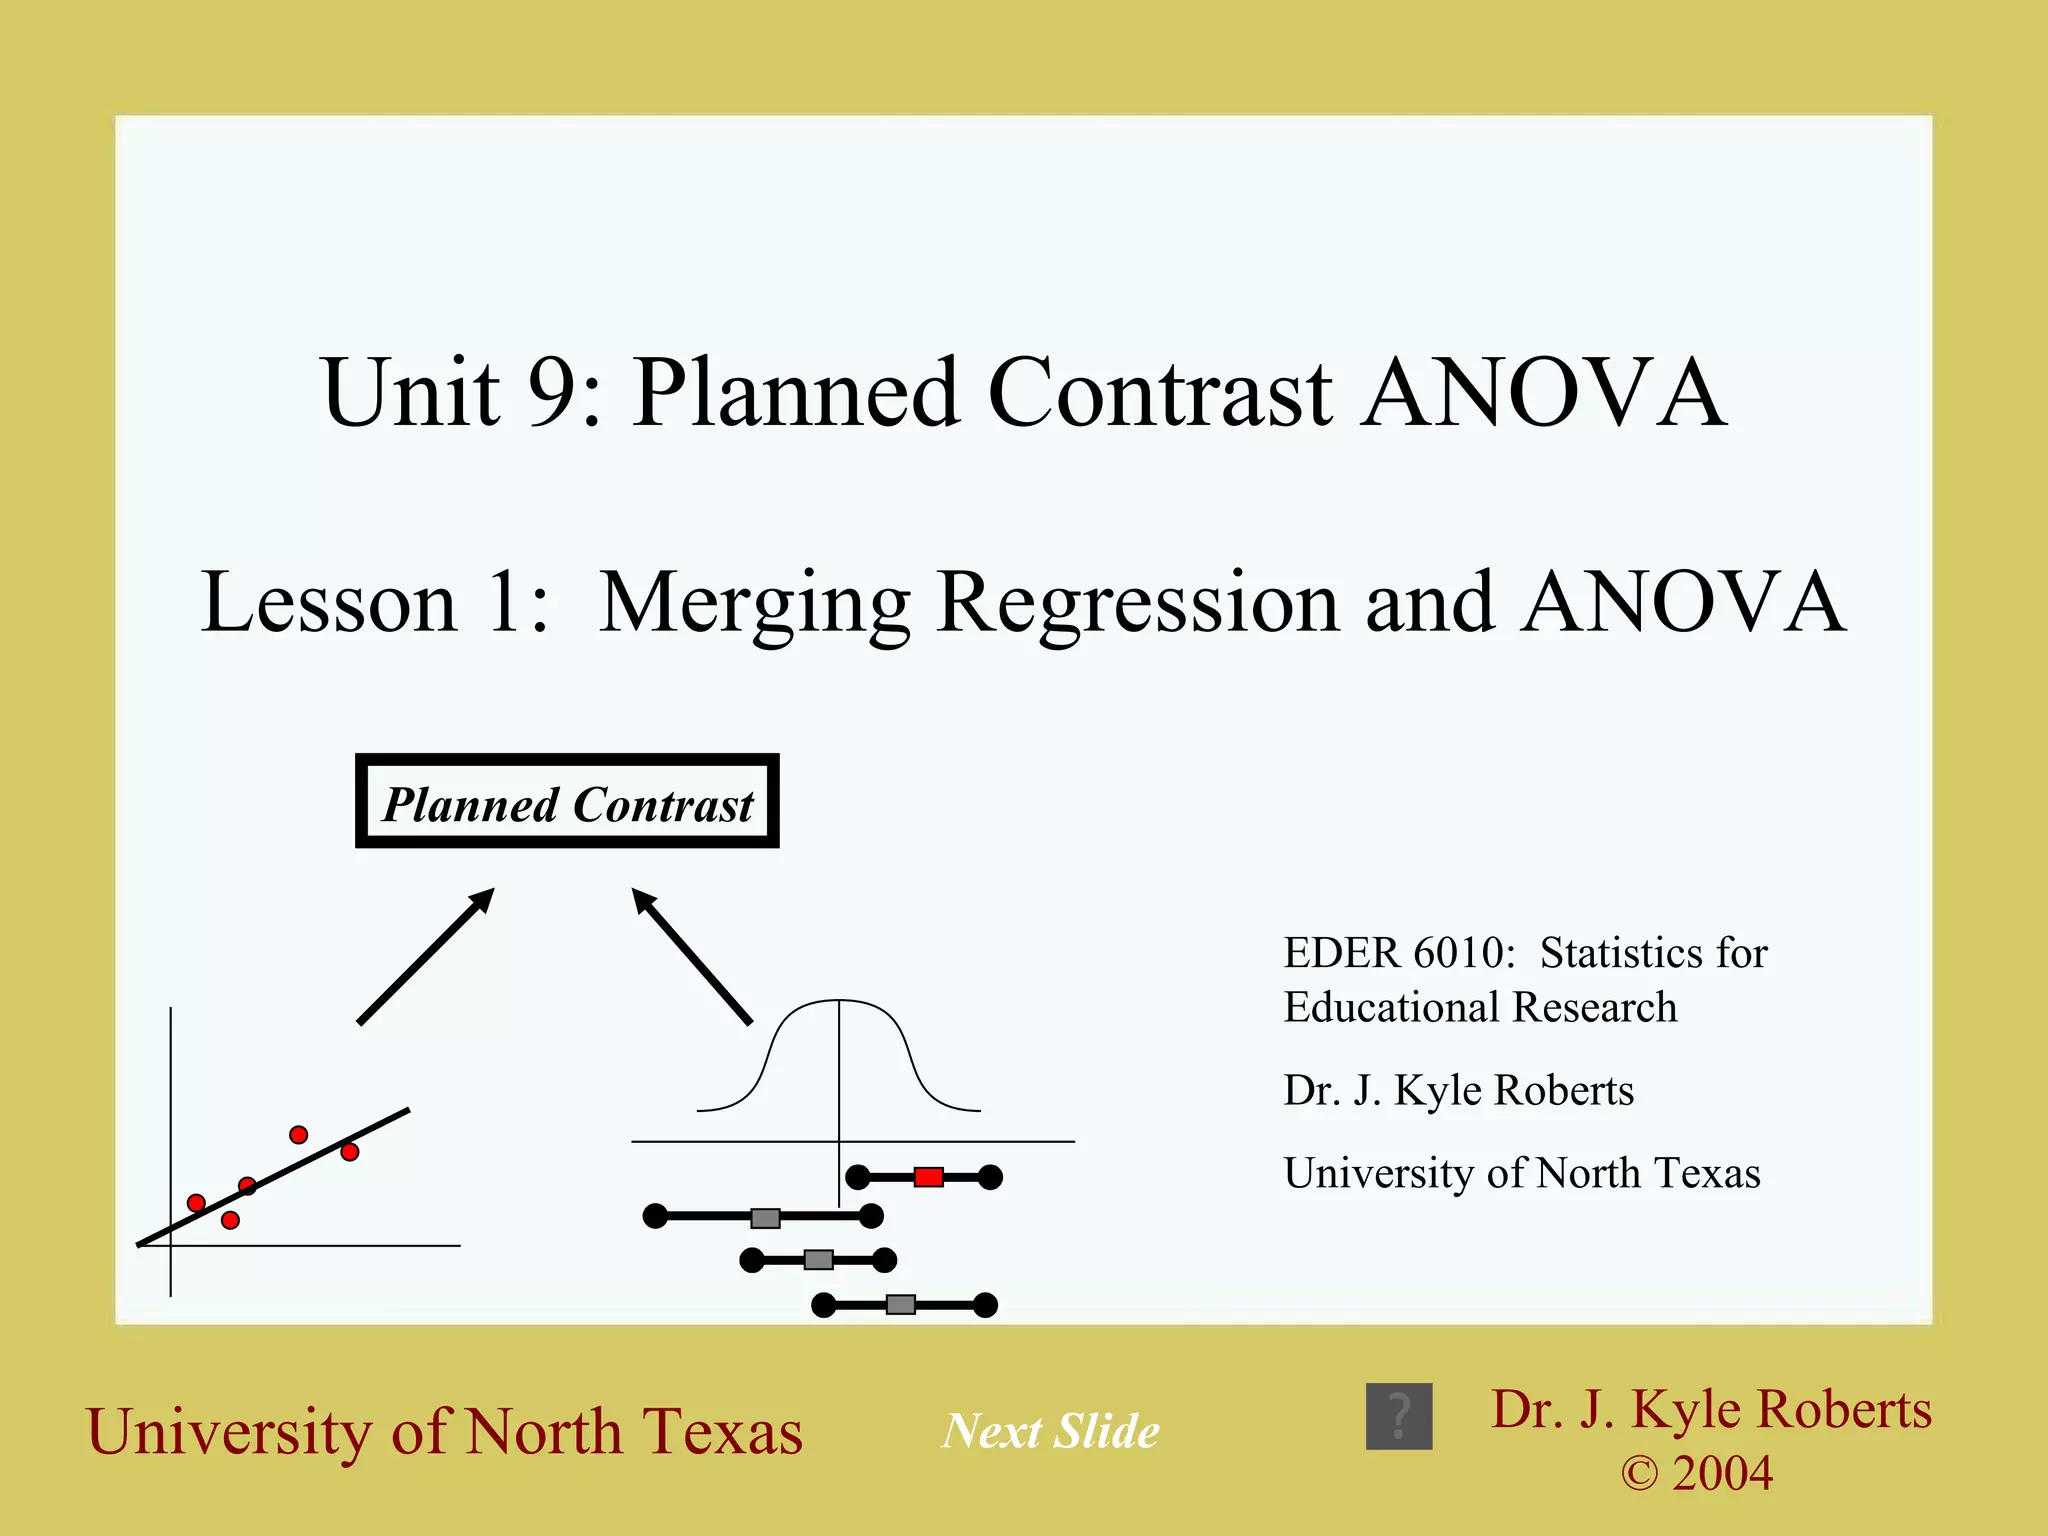
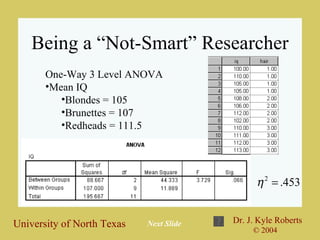
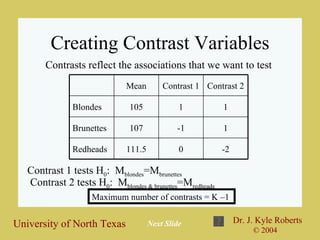
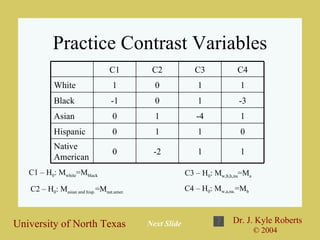
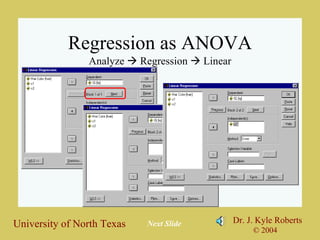
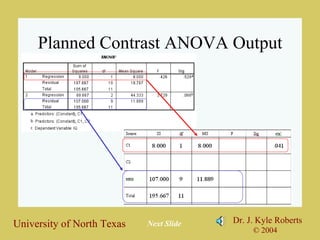
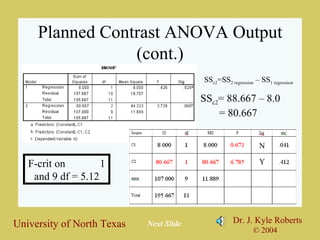
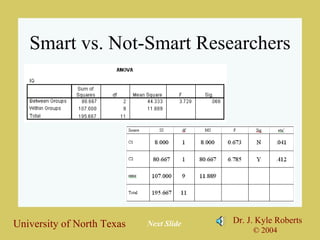
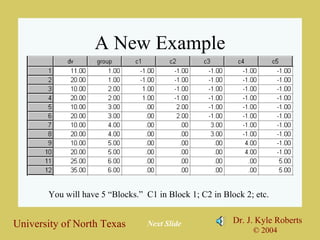
Unit 9: Planned Contrast ANOVA Lesson 1:  Merging Regression and ANOVA EDER 6010:  Statistics for Educational Research Dr. J. Kyle Roberts University of North Texas Planned Contrast Next Slide
Being a “Not-Smart” Researcher One-Way 3 Level ANOVA Mean IQ Blondes = 105 Brunettes = 107 Redheads = 111.5 Next Slide
Being a “Smart” Researcher H 0 :  Mean Blonde =Mean Brunette =Mean Redhead Blondes = 105 Brunettes = 107 Redheads = 111.5 Next Slide H 0 :M Blonde  & M Brunette =M Red Probably  is  statistically significantly different H 0 :M Blonde =M Brunette Probably  not  statistically significantly different
Creating Contrast Variables Contrasts reflect the associations that we want to test Contrast 1 tests H 0 :  M blondes =M brunettes Contrast 2 tests H 0 :  M blondes & brunettes =M redheads Next Slide Maximum number of contrasts = K –1  -2 0 111.5 Redheads 1 -1 107 Brunettes 1 1 105 Blondes Contrast 2 Contrast 1 Mean
Practice Contrast Variables C1 – H 0 : M white =M black C2 – H 0 : M asian and hisp. =M nat.amer. C4 – H 0 : M w,a,na. =M b C3 – H 0 : M w,b,h,na =M a Next Slide 1 1 -2 0 Native American 0 1 1 0 Hispanic 1 -4 1 0 Asian -3 1 0 -1 Black 1 1 0 1 White C4 C3 C2 C1
Back to “IQ” – “Hair” Example Next Slide
Regression as ANOVA Analyze    Regression    Linear Next Slide
Planned Contrast ANOVA Output Next Slide
Planned Contrast ANOVA Output (cont.) SS c2 = 88.667 – 8.0 = 80.667 F-crit on  1 and 9 df = 5.12 Next Slide SS c2 =SS 2 regression  – SS 1 regression Y N
Smart vs. Not-Smart Researchers  Next Slide
A New Example Next Slide You will have 5 “Blocks.”  C1 in Block 1; C2 in Block 2; etc.
SPSS Output for “New Example” Next Slide SS c2 =.333 - .250 SS c3 =.375 - .333 SS c4 =.400 - .375 SS c5 =370.417 - .400
Results for “New Example” Next Slide F-crit on  1 and 6 df = 5.99
“Other” Examples Next Slide -1 -1 -1 0 Group 5 -1 -1 1 0 Group 4 4 0 0 0 Group 3 -1 1 0 -1 Group 2 -1 1 0 1 Group 1 C4 C3 C2 C1
Unit 9: Planned Contrast ANOVA Lesson 1:  Merging Regression and ANOVA EDER 6010:  Statistics for Educational Research Dr. J. Kyle Roberts University of North Texas Planned Contrast

Unit 9 lesson 1

  • 1.
    Unit 9: PlannedContrast ANOVA Lesson 1: Merging Regression and ANOVA EDER 6010: Statistics for Educational Research Dr. J. Kyle Roberts University of North Texas Planned Contrast Next Slide
  • 2.
    Being a “Not-Smart”Researcher One-Way 3 Level ANOVA Mean IQ Blondes = 105 Brunettes = 107 Redheads = 111.5 Next Slide
  • 3.
    Being a “Smart”Researcher H 0 : Mean Blonde =Mean Brunette =Mean Redhead Blondes = 105 Brunettes = 107 Redheads = 111.5 Next Slide H 0 :M Blonde & M Brunette =M Red Probably is statistically significantly different H 0 :M Blonde =M Brunette Probably not statistically significantly different
  • 4.
    Creating Contrast VariablesContrasts reflect the associations that we want to test Contrast 1 tests H 0 : M blondes =M brunettes Contrast 2 tests H 0 : M blondes & brunettes =M redheads Next Slide Maximum number of contrasts = K –1 -2 0 111.5 Redheads 1 -1 107 Brunettes 1 1 105 Blondes Contrast 2 Contrast 1 Mean
  • 5.
    Practice Contrast VariablesC1 – H 0 : M white =M black C2 – H 0 : M asian and hisp. =M nat.amer. C4 – H 0 : M w,a,na. =M b C3 – H 0 : M w,b,h,na =M a Next Slide 1 1 -2 0 Native American 0 1 1 0 Hispanic 1 -4 1 0 Asian -3 1 0 -1 Black 1 1 0 1 White C4 C3 C2 C1
  • 6.
    Back to “IQ”– “Hair” Example Next Slide
  • 7.
    Regression as ANOVAAnalyze  Regression  Linear Next Slide
  • 8.
    Planned Contrast ANOVAOutput Next Slide
  • 9.
    Planned Contrast ANOVAOutput (cont.) SS c2 = 88.667 – 8.0 = 80.667 F-crit on 1 and 9 df = 5.12 Next Slide SS c2 =SS 2 regression – SS 1 regression Y N
  • 10.
    Smart vs. Not-SmartResearchers Next Slide
  • 11.
    A New ExampleNext Slide You will have 5 “Blocks.” C1 in Block 1; C2 in Block 2; etc.
  • 12.
    SPSS Output for“New Example” Next Slide SS c2 =.333 - .250 SS c3 =.375 - .333 SS c4 =.400 - .375 SS c5 =370.417 - .400
  • 13.
    Results for “NewExample” Next Slide F-crit on 1 and 6 df = 5.99
  • 14.
    “Other” Examples NextSlide -1 -1 -1 0 Group 5 -1 -1 1 0 Group 4 4 0 0 0 Group 3 -1 1 0 -1 Group 2 -1 1 0 1 Group 1 C4 C3 C2 C1
  • 15.
    Unit 9: PlannedContrast ANOVA Lesson 1: Merging Regression and ANOVA EDER 6010: Statistics for Educational Research Dr. J. Kyle Roberts University of North Texas Planned Contrast