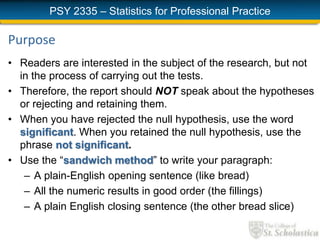
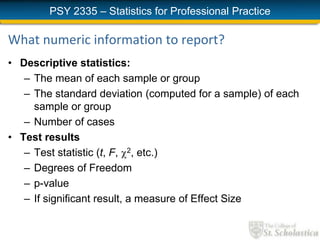
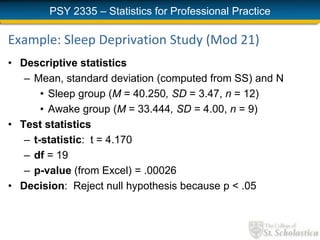
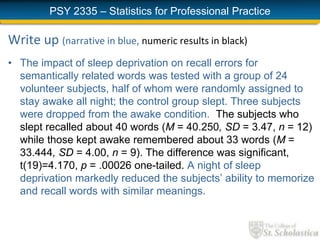
This document provides guidance on how to report test results using APA style. It recommends using a "sandwich method" of writing with a plain English opening sentence, numeric results in order, and a plain English closing sentence. Descriptive statistics like means, standard deviations, and sample sizes should be reported. Test statistics such as t-values, degrees of freedom, p-values, and effect sizes if significant should also be included. An example reporting the results of a sleep deprivation study is given to illustrate these recommendations.
Mga salita na kalimitang ginagamit sa mga pangungusap ngunit hindi natin alam ang tamang ppakahulugan nito. Kaya humanhantong sa pagkakaroon ng maling pang-unawa.
This is my report in my Assessment II subject. I am assigned to discuss on how to interpret test scores by standard deviation unit, Z-score, T-score, Stanine, Deviation IQ and NCE.
EPS 525 – Introduction to StatisticsAssignment No. 5 – One-w.docxYASHU40
EPS 525 – Introduction to Statistics
Assignment No. 5 – One-way Analysis of Variance
Name:
A researcher conducted a study to examine the effects of secure, anxious, and avoidant attachment styles on the physiology of sleep. Participants were selected using a stratified random sampling approach to ensure representation of each of the three styles. The sleep patterns of 30 secure, 30 anxious, and 30 avoidant children were monitored. Of primary importance to the researcher was the overall percentage of time each child spent in deep (delta) sleep. Following is the average amount of time that each child spent in delta sleep, expressed as a percentage of total sleep time (ranging from 0.0 to 100.0). For the attachment styles, 1 = secure, 2 = anxious, and 3 = avoidant.
Data Output for this Assignment is found on the last four pages.
The gray boxes for your answers will expand as necessary for your responses.
1.
(2 points) What would the null hypothesis be for this study? Show/write the appropriate symbols and expression in words.
H0:
.
2.
(2 points) What would the alternative hypothesis be for this study? Show/write the appropriate symbols and expression in words.
Ha:
3.
Prior to examining whether the group means differ; you need to test the underlying assumptions of the one-way analysis of variance.
3.a.
(2 points) Has the assumption of independence been met for this data?
FORMCHECKBOX
Yes
FORMCHECKBOX
No
(check your answer selection)
Indicate how you made your determination.
3.b.
(3 points) Has the assumption of normality been met for this data, using an alpha level of .001?
FORMCHECKBOX
Yes
FORMCHECKBOX
No
(check your answer selection)
Indicate how you made your determination. Be sure to include all applicable values and symbols.
3.c.
(3 points) Has the assumption of homogeneity of variance been met for this data, using an alpha level of .05? That is, is this assumption met or not met?
FORMCHECKBOX
Yes
FORMCHECKBOX
No
(check your answer selection)
Indicate how you came to your conclusion. Be sure to include all applicable values and symbols.
4.
(2 points) The next question that needs to be answered is whether all of the groups are the same in their percentage of time in deep (delta) sleep using an alpha level of .05. If applicable (or indicate why not), use the Welch statistic. What is your conclusion (at this point) from this analysis? Indicate how you came to your conclusion. Be sure to include all applicable values and symbols.
5.
(3 points) Calculate the measure of association and interpret its meaning.
W
T
W
B
MS
SS
MS
K
SS
+
-
-
=
)
1
(
2
wWhere
SSB =
K =
MSW =
SST =
MSW =
Therefore, (2 =
This means:
6.
(1 point) Write the statistical strand for this one-way ANOVA analysis.
7.
(4 points) Assuming that you found a significant F, which pairs of groups differ? Indicate which post hoc procedure you used and why. Indicate your findings fr ...
Chapter 7
Hypothesis Testing Procedures
Learning Objectives
• Define null and research hypothesis, test
statistic, level of significance and decision rule
• Distinguish between Type I and Type II errors
and discuss the implications of each
• Explain the difference between one- and two-
sided tests of hypothesis
Learning Objectives
• Estimate and interpret p-values
• Explain the relationship between confidence interval
estimates and p-values in drawing inferences
• Perform analysis of variance by hand
• Appropriately interpret the results of analysis of
variance tests
• Distinguish between one and two factor analysis of
variance tests
Learning Objectives
• Perform chi-square tests by hand
• Appropriately interpret the results of chi-square tests
• Identify the appropriate hypothesis testing procedures
based on type of outcome variable and number of
samples
Hypothesis Testing
• Research hypothesis is generated about
unknown population parameter
• Sample data are analyzed and determined to
support or refute the research hypothesis
Hypothesis Testing Procedures
Step 1
Null hypothesis (H0):
No difference, no change
Research hypothesis (H1):
What investigator
believes to be true
Hypothesis Testing Procedures
Step 2
Collect sample data and determine whether sample
data support research hypothesis or not.
For example, in test for m, evaluate .
X
Hypothesis Testing Procedures
Step 3
• Set up decision rule to decide when to believe null
versus research hypothesis
• Depends on level of significance, a = P(Reject H0|H0
is true)
Hypothesis Testing Procedures
Steps 4 and 5
• Summarize sample information in test statistic (e.g.,
Z value)
• Draw conclusion by comparing test statistic to
decision rule. Provide final assessment as to whether
H1 is likely true given the observed data.
P-values
• P-values represent the exact significance of the
data
• Estimate p-values when rejecting H0 to
summarize significance of the data (can
approximate with statistical tables, can get
exact value with statistical computing
package)
• P-value is the smallest a where we still reject
H0
Hypothesis Testing Procedures
1. Set up null and research hypotheses, select a
2. Select test statistic
2. Set up decision rule
3. Compute test statistic
4. Draw conclusion & summarize significance
Errors in Hypothesis Tests
Hypothesis Testing for m
• Continuous outcome
• 1 Sample
H0: m=m0
H1: m>m0, m<m0, m≠m0
Test Statistic
n>30 (Find critical
value in Table 1C,
n<30 Table 2, df=n-1)
ns/
μ-X
Z
0
=
ns/
μ-X
t
0
=
Example 7.2.
Hypothesis Testing for m
The National Center for Health Statistics (NCHS)
reports the mean total cholesterol for adults is 203. Is
the mean total cholesterol in Framingham Heart
Study participants significantly different?
In 3310 participants the mean is 200.3 with a standard
deviation of 36.8.
Example 7.2.
Hypothesis Test ...
P
A
G
E
5
Ryerson University
Daphne Cockwell School of Nursing
CNUR 860 WINTER 2022 Major Statistics Week 10
Course Leader Dr Elaine Santa Mina
This assignment is worth 30 marks
THE QUESTIONS ON THIS ASSIGNMENT ARE Three (3) PAGES IN LENGTH
There is no page limit to your paper.
This assignment accompanies the RNAO Best Practice Guideline:
Registered Nurses’ Association of Ontario (2005). Nursing Care of Dyspnea: The 6th
Vital Sign in Individuals with Chronic Obstructive Pulmonary Disease (COPD). Toronto,
Canada: Registered Nurses’ Association of Ontario.
Prepare your assignment as per APA 5th format, inclusive of a title page, pages
numbered, double spaced , reference page etc. DO NOT RECOPY Question format and
DO NOT INSERT ANSWERS IN POINT FORM; Reference your Salkind text
appropriately
Grading: Assignments completed in point form will NOT be accepted for grading.
This is an individual assignment, not a group assignment, see course syllabus
directions to not share files, papers, or any part of your assignment with another
student, as that constitutes academic misconduct.
Answer each research question separately…do not combine answers across questions.
There will be a 5 mark deduction, if APA format for a scholarly paper is not followed,
and/ or if responses to questions are combined.
Please remember: If you decide a pearson r is required in the hypothesis test, on
your output the correct significance in the correlation to interpret is the significance for
the p value beside the independent variable. The written excel directions are correct.
There is an error in the captivate lab which incorrectly indicates that you are to use the p
value for the intercept
Use the CNUR 860 Major STATS assignment database and study abstract for this
assignment. For the following three research scenarios, answer the research questions by
conducting the requested analyses. Each question is worth a total of 10 marks for a total
of 30 marks for this assignment. The distribution of marks is similar to the distribution
on your mini stats assignments.
FOR EACH RESEARCH QUESTION CONDUCT ALL RELEVANT:
a) descriptive stats = 4 marks (2 marks per variable) Conduct the appropriate
descriptive statistical analyses to answer this research question. Include in the descriptive
analyses, all outputs, (include graphs: histograms/bar graphs, for the descriptives, if you think they are
helpful in the presentation of your answer) with legends as required and discuss findings of
descriptives
b) inferential = 4 marks, Include each step of the hypothesis test.
P
A
G
E
5
Correct null and research hypotheses = .25
No grade is given for identification of target population, sample population or IV and DV
and level of measure, (grades for IV and DV are included in descriptives), but if omitted,
there will be a deduction of .1 for each omission
No grade is given for level ...
Brief presentation of Robin Williams' four principles from The Non-Designers Design Book (Peachpit Press). Organized for classroom presentation in SCI 2777 Storytelling with Data.
Brief example showing Chi-Square computations, the impact of effect size on the Chi-Square statistic, equations for Phi and for Cramer's V, and a narrative write-up of the results. Uses hypothetical data for a Growth Mindset study, and includes supplemental materials on the Growth Mindset research.
Presentation at the Benedictine Pedagogy Conference 2013 at Benedictine University in Lisle, IL. Focus on challenges and opportunities for Benedictine institutions to work with their sponsoring monastic communities to enable continued sponsorship as numbers of monastic women and men decrease.
2024.06.01 Introducing a competency framework for languag learning materials ...Sandy Millin
http://sandymillin.wordpress.com/iateflwebinar2024
Published classroom materials form the basis of syllabuses, drive teacher professional development, and have a potentially huge influence on learners, teachers and education systems. All teachers also create their own materials, whether a few sentences on a blackboard, a highly-structured fully-realised online course, or anything in between. Despite this, the knowledge and skills needed to create effective language learning materials are rarely part of teacher training, and are mostly learnt by trial and error.
Knowledge and skills frameworks, generally called competency frameworks, for ELT teachers, trainers and managers have existed for a few years now. However, until I created one for my MA dissertation, there wasn’t one drawing together what we need to know and do to be able to effectively produce language learning materials.
This webinar will introduce you to my framework, highlighting the key competencies I identified from my research. It will also show how anybody involved in language teaching (any language, not just English!), teacher training, managing schools or developing language learning materials can benefit from using the framework.
Honest Reviews of Tim Han LMA Course Program.pptxtimhan337
Personal development courses are widely available today, with each one promising life-changing outcomes. Tim Han’s Life Mastery Achievers (LMA) Course has drawn a lot of interest. In addition to offering my frank assessment of Success Insider’s LMA Course, this piece examines the course’s effects via a variety of Tim Han LMA course reviews and Success Insider comments.
The Roman Empire A Historical Colossus.pdfkaushalkr1407
The Roman Empire, a vast and enduring power, stands as one of history's most remarkable civilizations, leaving an indelible imprint on the world. It emerged from the Roman Republic, transitioning into an imperial powerhouse under the leadership of Augustus Caesar in 27 BCE. This transformation marked the beginning of an era defined by unprecedented territorial expansion, architectural marvels, and profound cultural influence.
The empire's roots lie in the city of Rome, founded, according to legend, by Romulus in 753 BCE. Over centuries, Rome evolved from a small settlement to a formidable republic, characterized by a complex political system with elected officials and checks on power. However, internal strife, class conflicts, and military ambitions paved the way for the end of the Republic. Julius Caesar’s dictatorship and subsequent assassination in 44 BCE created a power vacuum, leading to a civil war. Octavian, later Augustus, emerged victorious, heralding the Roman Empire’s birth.
Under Augustus, the empire experienced the Pax Romana, a 200-year period of relative peace and stability. Augustus reformed the military, established efficient administrative systems, and initiated grand construction projects. The empire's borders expanded, encompassing territories from Britain to Egypt and from Spain to the Euphrates. Roman legions, renowned for their discipline and engineering prowess, secured and maintained these vast territories, building roads, fortifications, and cities that facilitated control and integration.
The Roman Empire’s society was hierarchical, with a rigid class system. At the top were the patricians, wealthy elites who held significant political power. Below them were the plebeians, free citizens with limited political influence, and the vast numbers of slaves who formed the backbone of the economy. The family unit was central, governed by the paterfamilias, the male head who held absolute authority.
Culturally, the Romans were eclectic, absorbing and adapting elements from the civilizations they encountered, particularly the Greeks. Roman art, literature, and philosophy reflected this synthesis, creating a rich cultural tapestry. Latin, the Roman language, became the lingua franca of the Western world, influencing numerous modern languages.
Roman architecture and engineering achievements were monumental. They perfected the arch, vault, and dome, constructing enduring structures like the Colosseum, Pantheon, and aqueducts. These engineering marvels not only showcased Roman ingenuity but also served practical purposes, from public entertainment to water supply.
Welcome to TechSoup New Member Orientation and Q&A (May 2024).pdfTechSoup
In this webinar you will learn how your organization can access TechSoup's wide variety of product discount and donation programs. From hardware to software, we'll give you a tour of the tools available to help your nonprofit with productivity, collaboration, financial management, donor tracking, security, and more.
Macroeconomics- Movie Location
This will be used as part of your Personal Professional Portfolio once graded.
Objective:
Prepare a presentation or a paper using research, basic comparative analysis, data organization and application of economic information. You will make an informed assessment of an economic climate outside of the United States to accomplish an entertainment industry objective.
1. PSY 2335 – Statistics for Professional Practice
PSY 2335
How to Report
Test Results (APA)
2. PSY 2335 – Statistics for Professional Practice
Purpose
• Readers are interested in the subject of the research, but not
in the process of carrying out the tests.
• Therefore, the report should NOT speak about the hypotheses
or rejecting and retaining them.
• When you have rejected the null hypothesis, use the word
significant. When you retained the null hypothesis, use the
phrase not significant.
• Use the “sandwich method” to write your paragraph:
– A plain-English opening sentence (like bread)
– All the numeric results in good order (the fillings)
– A plain English closing sentence (the other bread slice)
3. PSY 2335 – Statistics for Professional Practice
What numeric information to report?
• Descriptive statistics:
– The mean of each sample or group
– The standard deviation (computed for a sample) of each
sample or group
– Number of cases
• Test results
– Test statistic (t, F, 2, etc.)
– Degrees of Freedom
– p-value
– If significant result, a measure of Effect Size
4. PSY 2335 – Statistics for Professional Practice
Example: Sleep Deprivation Study (Mod 21)
• Descriptive statistics
– Mean, standard deviation (computed from SS) and N
• Sleep group (M = 40.250, SD = 3.47, n = 12)
• Awake group (M = 33.444, SD = 4.00, n = 9)
• Test statistics
– t-statistic: t = 4.170
– df = 19
– p-value (from Excel) = .00026
• Decision: Reject null hypothesis because p < .05
5. PSY 2335 – Statistics for Professional Practice
Write up (narrative in blue, numeric results in black)
• The impact of sleep deprivation on recall errors for
semantically related words was tested with a group of 24
volunteer subjects, half of whom were randomly assigned to
stay awake all night; the control group slept. Three subjects
were dropped from the awake condition. The subjects who
slept recalled about 40 words (M = 40.250, SD = 3.47, n = 12)
while those kept awake remembered about 33 words (M =
33.444, SD = 4.00, n = 9). The difference was significant,
t(19)=4.170, p = .00026 one-tailed. A night of sleep
deprivation markedly reduced the subjects’ ability to memorize
and recall words with similar meanings.
6. PSY 2335 – Statistics for Professional Practice
PSY 2335
How to Report
Test Results (APA)