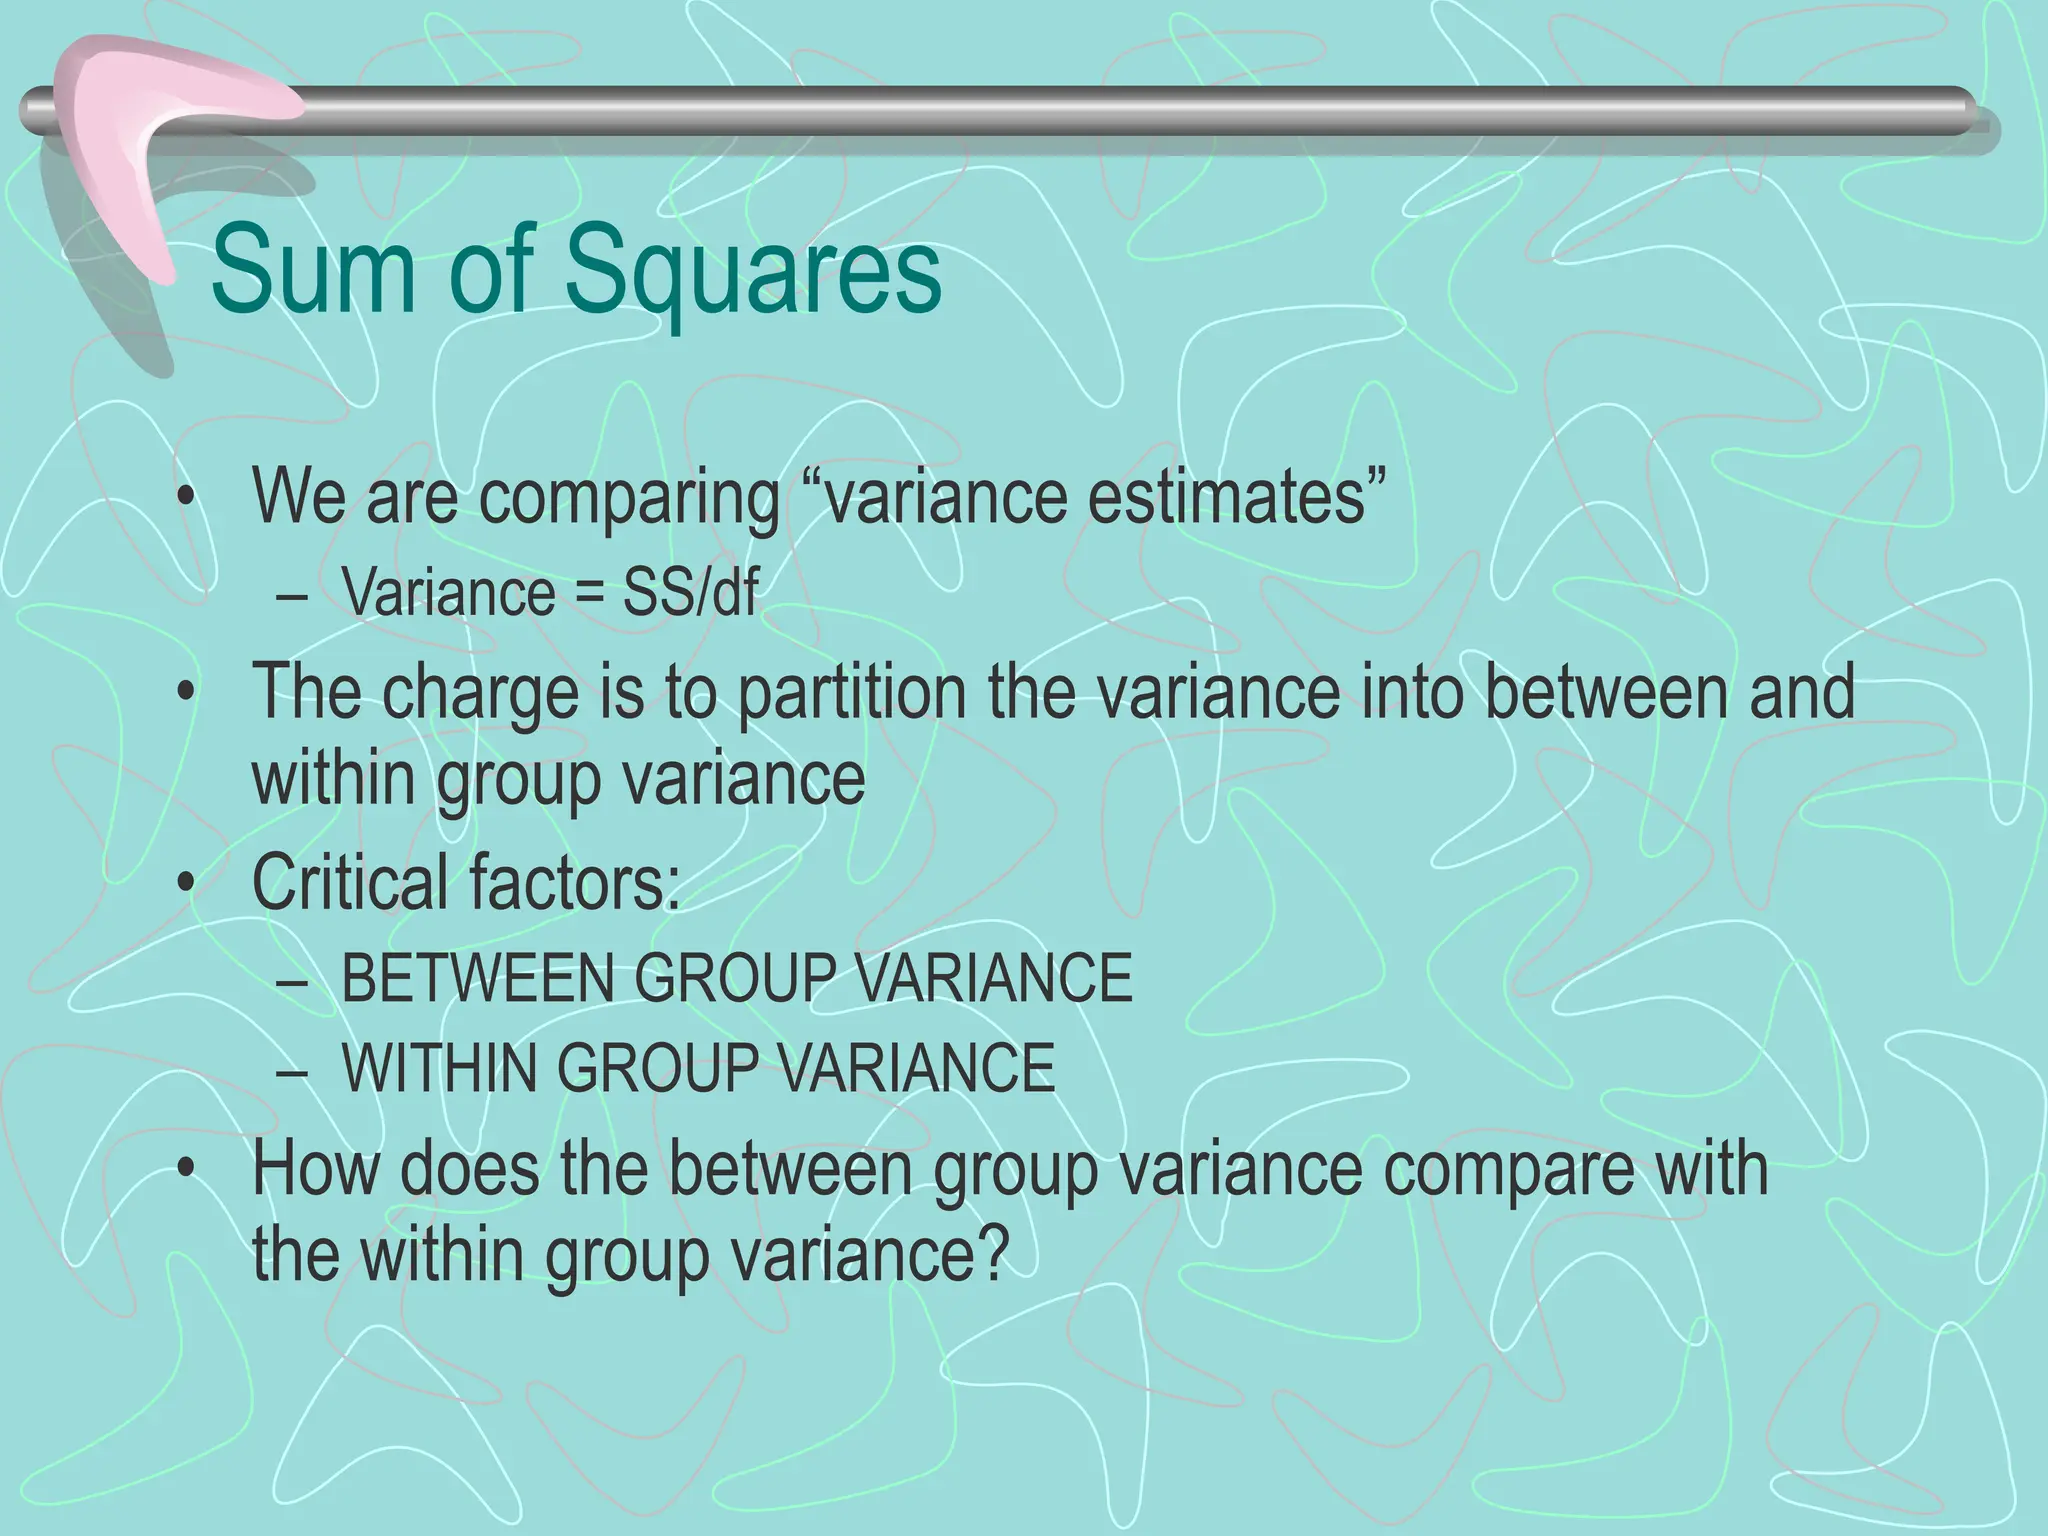
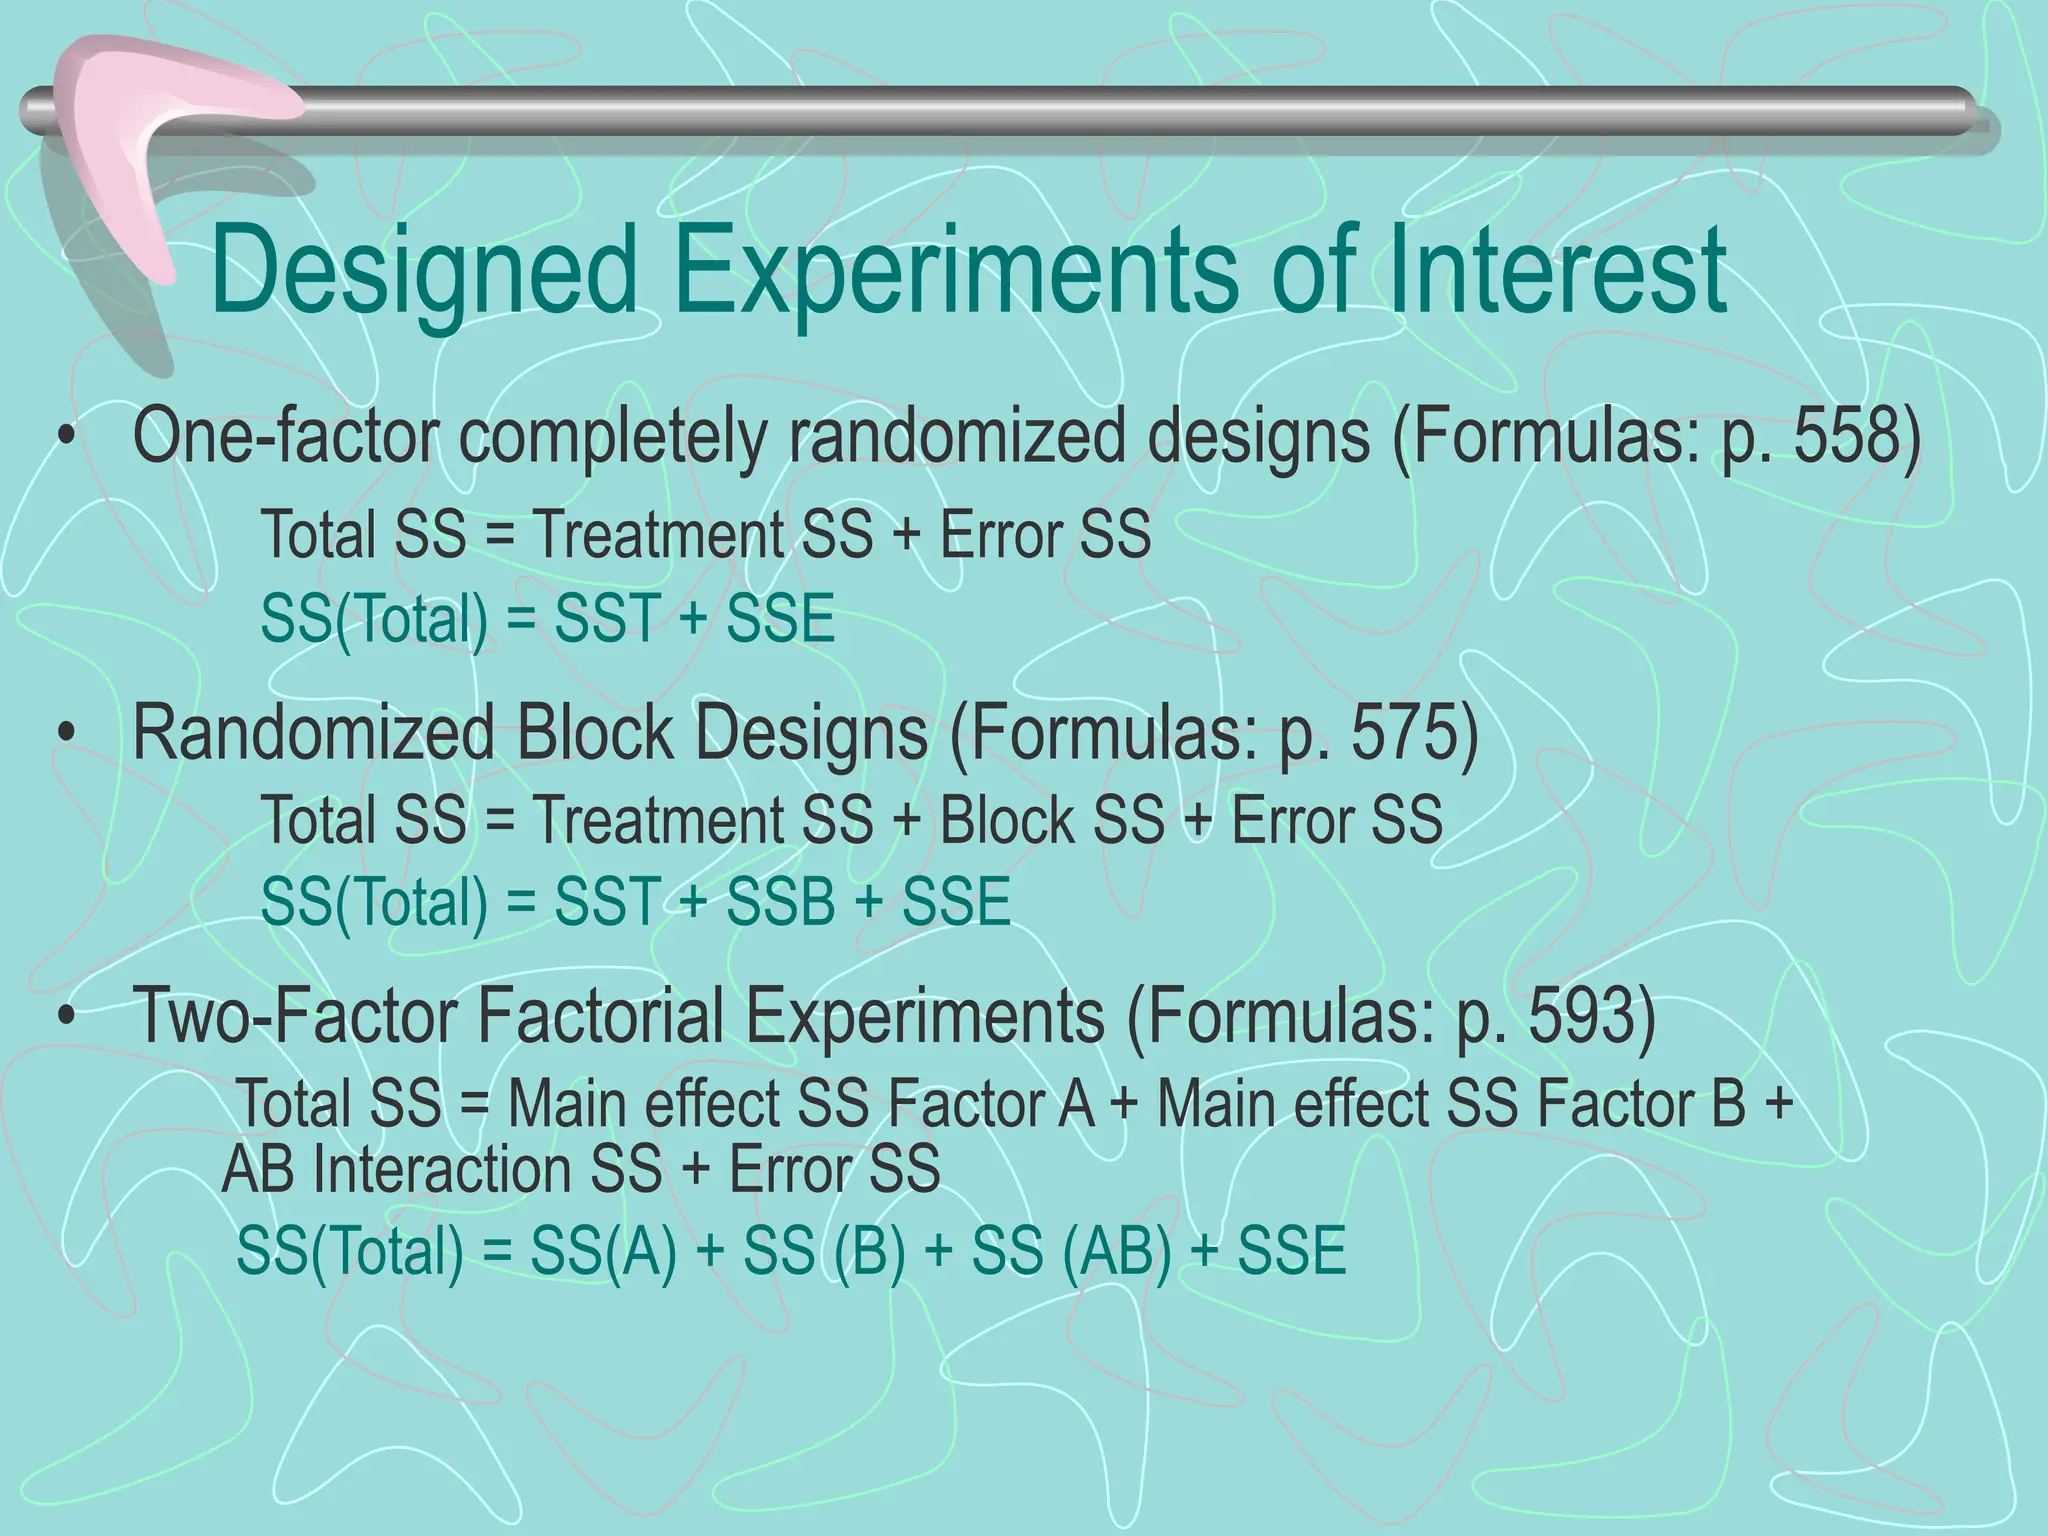
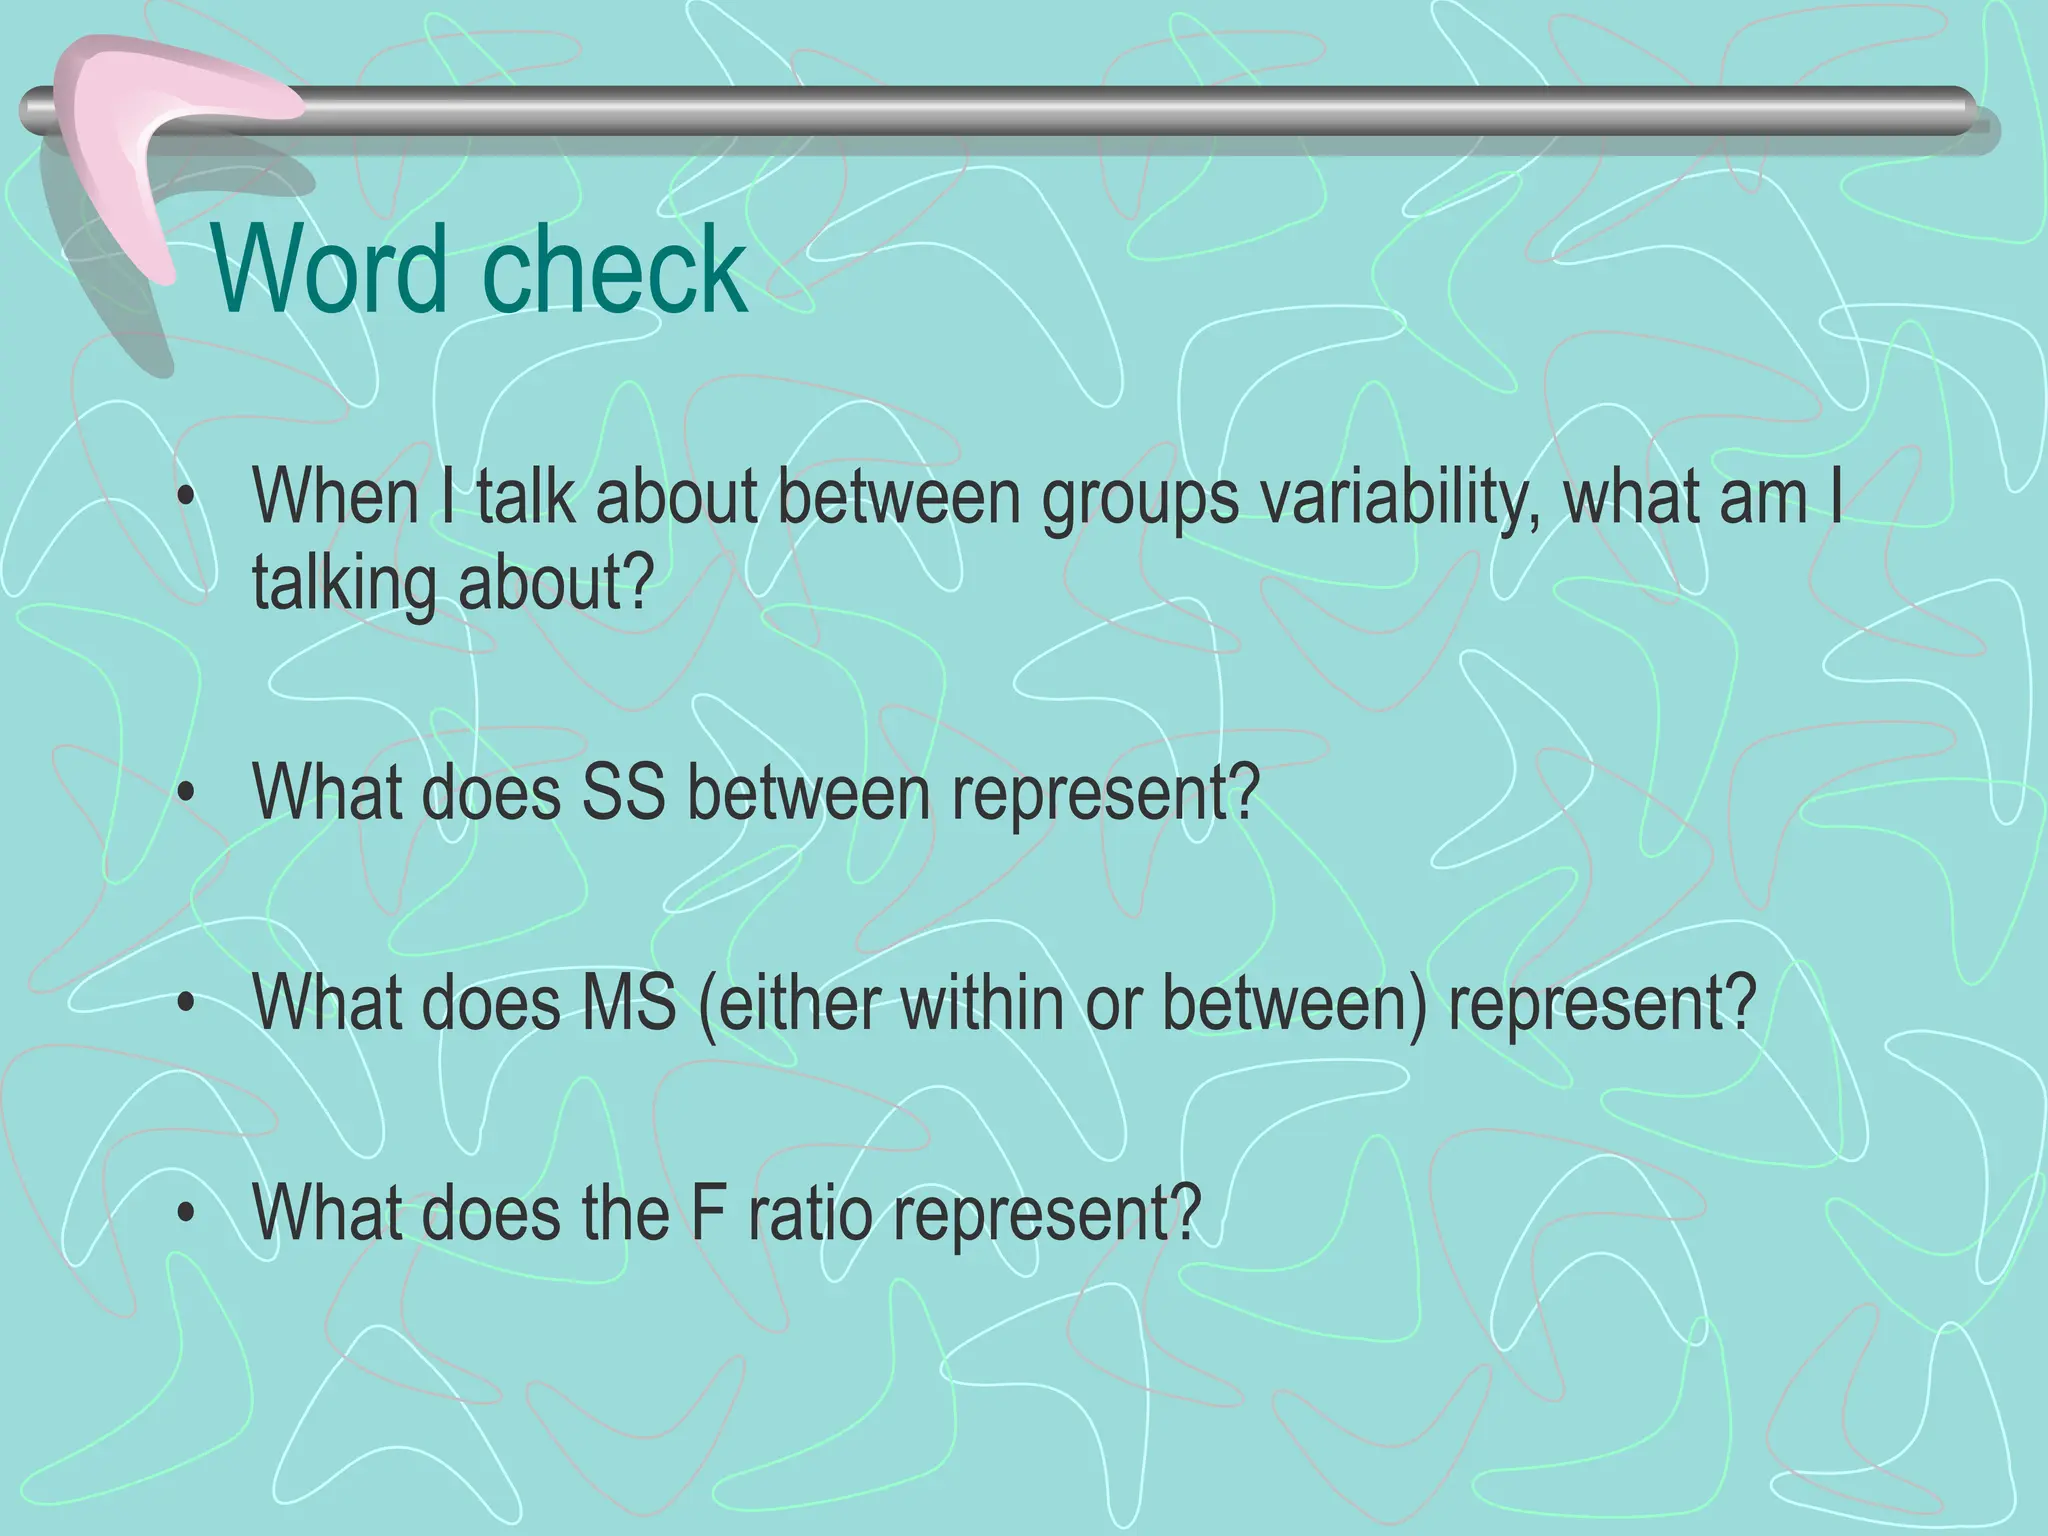
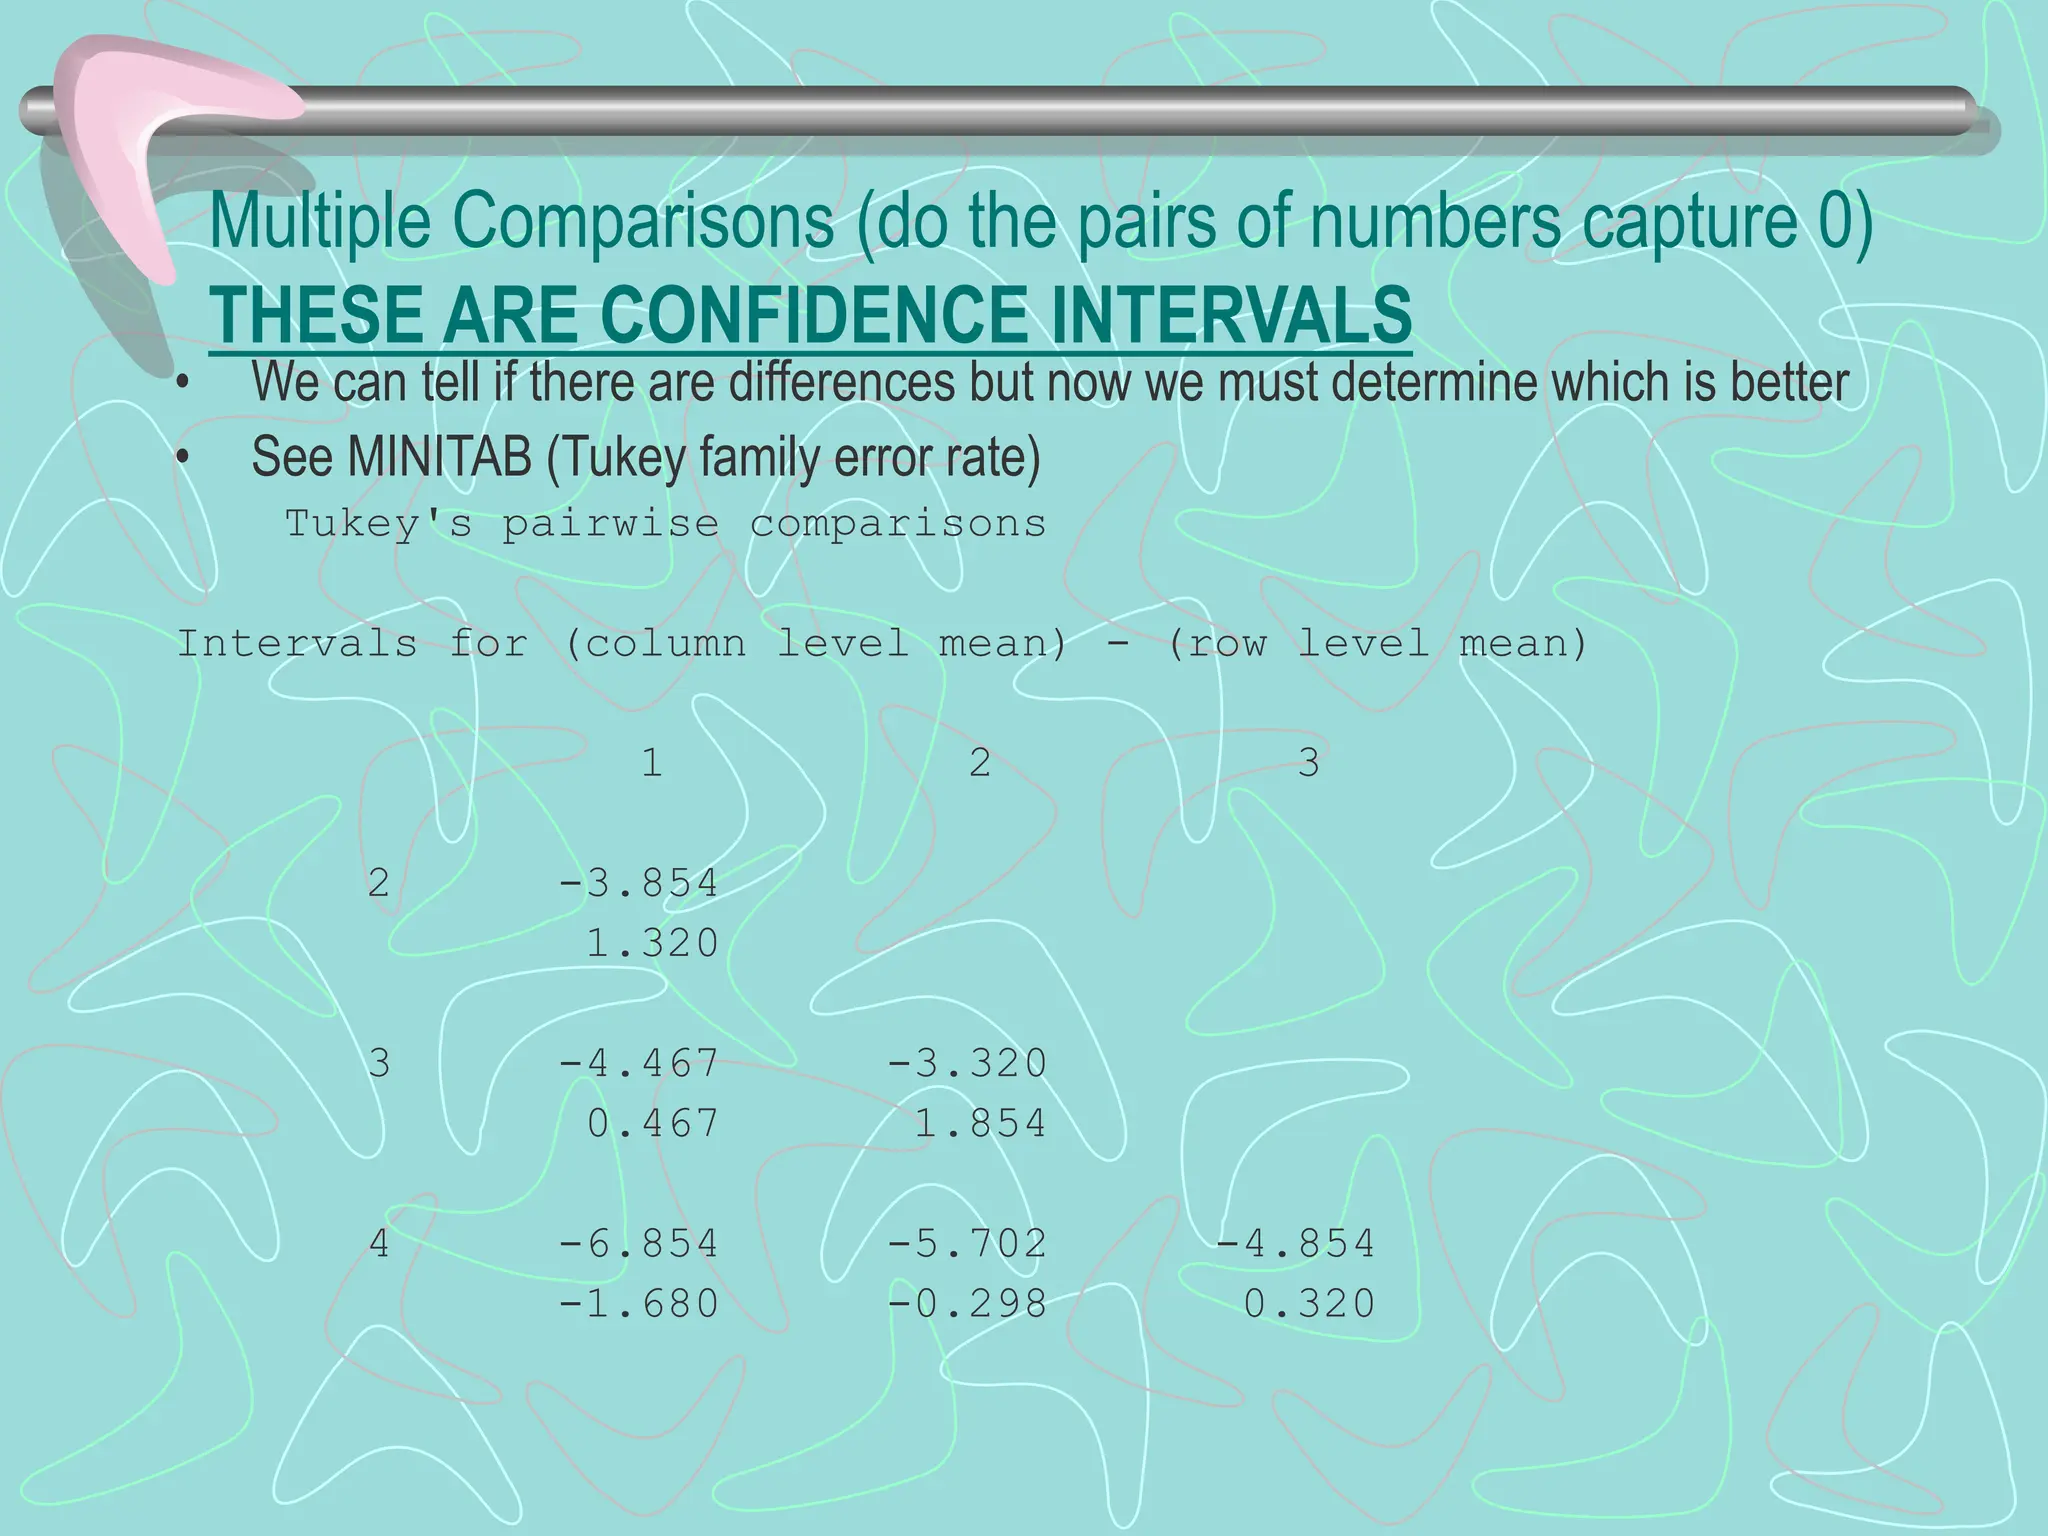
Analysis of Variance (ANOVA)
Why ANOVA?
• In real life things do not typically result in two groups
being compared
– Test lines on I-64 in Frankfort
• Two-sample t-tests are problematic
– Increasing the risk of a Type I error
– At .05 level of significance, with 100 comparisons, 5 will show
a difference when none exists (experimentwise error)
– So the more t-tests you run, the greater the risk of a type I
error (rejecting the null when there is no difference)
• ANOVA allows us to see if there are differences
between means with an OMNIBUS test
When ANOVA?
• Data must be experimental
• If you do not have access to statistical software, an
ANOVA can be computed by hand
• With many experimental designs, the sample sizes
must be equal for the various factor level combinations
• A regression analysis will accomplish the same goal as
an ANOVA.
• ANOVA formulas change from one experimental design
to another
Variance – why do scores vary?
• A representation of the spread of scores
• What contributes to differences in scores?
– Individual differences
– Which group you are in
Variance to compare Means
• We are applying the variance concept to means
– How do means of different groups compare to the
overall mean
• Do the means vary so greatly from each other
that they exceed individual differences within the
groups?
Between/Within Groups
• Variance can be separated into two major
components
– Within groups – variability or differences in
particular groups (individual differences)
– Between groups - differences depending what
group one is in or what treatment is received
Formulas: page 550
Bottom Line
• We are examining the ratio of differences
(variances) from treatment to variances from
individual differences
• If the ratio is large there is a significant impact
from treatment.
• We know if a ratio is “large enough” by
calculating the ratio of the MST to MSE and
conducting an F test.
Fundamental Concepts
• You are able to compare MULTIPLE means
• Between-group variance reflects differences in
the way the groups were treated
• Within-group variance reflects individual
differences
• Null hypothesis: no difference in means
• Alternative hypothesis: difference in means
Sum of Squares
• We are comparing “variance estimates”
– Variance = SS/df
• The charge is to partition the variance into between and
within group variance
• Critical factors:
– BETWEEN GROUP VARIANCE
– WITHIN GROUP VARIANCE
• How does the between group variance compare with
the within group variance?
Designed Experiments of Interest
• One-factor completely randomized designs (Formulas: p. 558)
Total SS = Treatment SS + Error SS
SS(Total) = SST + SSE
• Randomized Block Designs (Formulas: p. 575)
Total SS = Treatment SS + Block SS + Error SS
SS(Total) = SST + SSB + SSE
• Two-Factor Factorial Experiments (Formulas: p. 593)
Total SS = Main effect SS Factor A + Main effect SS Factor B +
AB Interaction SS + Error SS
SS(Total) = SS(A) + SS (B) + SS (AB) + SSE
Word check
• When I talk about between groups variability, what am I
talking about?
• What does SS between represent?
• What does MS (either within or between) represent?
• What does the F ratio represent?
Multiple Comparisons (do the pairs of numbers capture 0)
THESE ARE CONFIDENCE INTERVALS
• We can tell if there are differences but now we must determine which is better
• See MINITAB (Tukey family error rate)
Tukey's pairwise comparisons
Intervals for (column level mean) - (row level mean)
1 2 3
2 -3.854
1.320
3 -4.467 -3.320
0.467 1.854
4 -6.854 -5.702 -4.854
-1.680 -0.298 0.320

GRADE 10 PPT FOR THE LESSON ANOVA Presentation.ppt

  • 1.
  • 2.
    Why ANOVA? • Inreal life things do not typically result in two groups being compared – Test lines on I-64 in Frankfort • Two-sample t-tests are problematic – Increasing the risk of a Type I error – At .05 level of significance, with 100 comparisons, 5 will show a difference when none exists (experimentwise error) – So the more t-tests you run, the greater the risk of a type I error (rejecting the null when there is no difference) • ANOVA allows us to see if there are differences between means with an OMNIBUS test
  • 3.
    When ANOVA? • Datamust be experimental • If you do not have access to statistical software, an ANOVA can be computed by hand • With many experimental designs, the sample sizes must be equal for the various factor level combinations • A regression analysis will accomplish the same goal as an ANOVA. • ANOVA formulas change from one experimental design to another
  • 4.
    Variance – whydo scores vary? • A representation of the spread of scores • What contributes to differences in scores? – Individual differences – Which group you are in
  • 5.
    Variance to compareMeans • We are applying the variance concept to means – How do means of different groups compare to the overall mean • Do the means vary so greatly from each other that they exceed individual differences within the groups?
  • 6.
    Between/Within Groups • Variancecan be separated into two major components – Within groups – variability or differences in particular groups (individual differences) – Between groups - differences depending what group one is in or what treatment is received Formulas: page 550
  • 7.
    Bottom Line • Weare examining the ratio of differences (variances) from treatment to variances from individual differences • If the ratio is large there is a significant impact from treatment. • We know if a ratio is “large enough” by calculating the ratio of the MST to MSE and conducting an F test.
  • 8.
    Fundamental Concepts • Youare able to compare MULTIPLE means • Between-group variance reflects differences in the way the groups were treated • Within-group variance reflects individual differences • Null hypothesis: no difference in means • Alternative hypothesis: difference in means
  • 9.
    Sum of Squares •We are comparing “variance estimates” – Variance = SS/df • The charge is to partition the variance into between and within group variance • Critical factors: – BETWEEN GROUP VARIANCE – WITHIN GROUP VARIANCE • How does the between group variance compare with the within group variance?
  • 10.
    Designed Experiments ofInterest • One-factor completely randomized designs (Formulas: p. 558) Total SS = Treatment SS + Error SS SS(Total) = SST + SSE • Randomized Block Designs (Formulas: p. 575) Total SS = Treatment SS + Block SS + Error SS SS(Total) = SST + SSB + SSE • Two-Factor Factorial Experiments (Formulas: p. 593) Total SS = Main effect SS Factor A + Main effect SS Factor B + AB Interaction SS + Error SS SS(Total) = SS(A) + SS (B) + SS (AB) + SSE
  • 11.
    Word check • WhenI talk about between groups variability, what am I talking about? • What does SS between represent? • What does MS (either within or between) represent? • What does the F ratio represent?
  • 12.
    Multiple Comparisons (dothe pairs of numbers capture 0) THESE ARE CONFIDENCE INTERVALS • We can tell if there are differences but now we must determine which is better • See MINITAB (Tukey family error rate) Tukey's pairwise comparisons Intervals for (column level mean) - (row level mean) 1 2 3 2 -3.854 1.320 3 -4.467 -3.320 0.467 1.854 4 -6.854 -5.702 -4.854 -1.680 -0.298 0.320