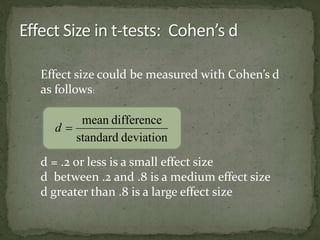
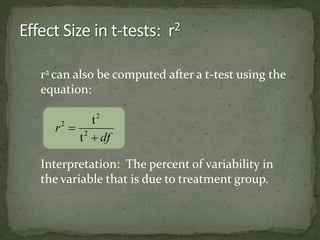
SlideShare a Scribd company logo
1 of 7
Shared Variance 
Improved Prediction
 Significance: 
Is there evidence that this event would be 
unlikely, if the null hypothesis were true? 
 An result can be significant but the size of the 
difference might be very small 
 If sample size is very large 
 If variability is quite small 
 Effect size can also be measured and 
compared.
 In Correlation, we computed r2 to see the 
amount of shared variability between two 
variables. 
 A correlation of r = .7 meant that 49% of the 
variability was “shared” or “explained” by the 
relationship of the two variables. 
 This gave us a measure that increased in a 
linear way (unlike r) to talk about the size of 
the correlation.
Effect size could be measured with Cohen’s d 
as follows: 
mean difference 
standard deviation 
d  
d = .2 or less is a small effect size 
d between .2 and .8 is a medium effect size 
d greater than .8 is a large effect size
r2 can also be computed after a t-test using the 
equation: 
df 
r 
2 
t 
 
 2 
2 
t 
Interpretation: The percent of variability in 
the variable that is due to treatment group.
Same idea of shared variance as we saw in r2 
2 between SS 
  
total SS 
Interpretation: The percent of variability in 
the variable that is due to treatment group.
 Enter data for our sample problem 
 Instead of Group ABC, use codes 
1, 2 and 3. 
 Add value labels for praise levels 
 Add variable names 
 Consult Cronk book 
 Do your own write-up of the 
results, including a measure of 
Effect Size. 
Group X 
A 7 
A 6 
A 5 
A 8 
A 3 
A 7 
B 4 
B 6 
B 4 
B 7 
B 5 
B 7 
C 3 
C 2 
C 1 
C 3 
C 4 
C 1 
ΣX 83 
Mean 4.6111

More Related Content

What's hot

Factor Analysis - Statistics
Factor Analysis - StatisticsFactor Analysis - Statistics
Factor Analysis - StatisticsThiyagu K
 
Basic survival analysis
Basic survival analysisBasic survival analysis
Basic survival analysisMike LaValley
 
Power, effect size, and Issues in NHST
Power, effect size, and Issues in NHSTPower, effect size, and Issues in NHST
Power, effect size, and Issues in NHSTCarlo Magno
 
Statistical tests for data involving quantitative data
Statistical tests for data involving quantitative dataStatistical tests for data involving quantitative data
Statistical tests for data involving quantitative dataRizwan S A
 
Validity and its types
Validity and its typesValidity and its types
Validity and its typesBibiNadia1
 
Parametric and nonparametric test
Parametric and nonparametric testParametric and nonparametric test
Parametric and nonparametric testponnienselvi
 
Brm (one tailed and two tailed hypothesis)
Brm (one tailed and two tailed hypothesis)Brm (one tailed and two tailed hypothesis)
Brm (one tailed and two tailed hypothesis)Upama Dwivedi
 
Independent sample t test
Independent sample t testIndependent sample t test
Independent sample t testShajar Khan
 
Multiple Linear Regression II and ANOVA I
Multiple Linear Regression II and ANOVA IMultiple Linear Regression II and ANOVA I
Multiple Linear Regression II and ANOVA IJames Neill
 
INFERENTIAL STATISTICS: AN INTRODUCTION
INFERENTIAL STATISTICS: AN INTRODUCTIONINFERENTIAL STATISTICS: AN INTRODUCTION
INFERENTIAL STATISTICS: AN INTRODUCTIONJohn Labrador
 
Fundamental of Statistics and Types of Correlations
Fundamental of Statistics and Types of CorrelationsFundamental of Statistics and Types of Correlations
Fundamental of Statistics and Types of CorrelationsRajesh Verma
 
Correlation and Regression
Correlation and RegressionCorrelation and Regression
Correlation and Regressionjasondroesch
 
Sampling design
Sampling designSampling design
Sampling designBalaji P
 

What's hot (20)

Factor Analysis - Statistics
Factor Analysis - StatisticsFactor Analysis - Statistics
Factor Analysis - Statistics
 
Data analysis using spss
Data analysis using spssData analysis using spss
Data analysis using spss
 
Basic survival analysis
Basic survival analysisBasic survival analysis
Basic survival analysis
 
Repeated Measures ANOVA
Repeated Measures ANOVARepeated Measures ANOVA
Repeated Measures ANOVA
 
Power, effect size, and Issues in NHST
Power, effect size, and Issues in NHSTPower, effect size, and Issues in NHST
Power, effect size, and Issues in NHST
 
Research design
Research designResearch design
Research design
 
Chi squared test
Chi squared test Chi squared test
Chi squared test
 
Statistical tests for data involving quantitative data
Statistical tests for data involving quantitative dataStatistical tests for data involving quantitative data
Statistical tests for data involving quantitative data
 
Validity and its types
Validity and its typesValidity and its types
Validity and its types
 
Factor analysis
Factor analysisFactor analysis
Factor analysis
 
Parametric and nonparametric test
Parametric and nonparametric testParametric and nonparametric test
Parametric and nonparametric test
 
Triangulation research
Triangulation researchTriangulation research
Triangulation research
 
Brm (one tailed and two tailed hypothesis)
Brm (one tailed and two tailed hypothesis)Brm (one tailed and two tailed hypothesis)
Brm (one tailed and two tailed hypothesis)
 
Survival analysis
Survival analysis  Survival analysis
Survival analysis
 
Independent sample t test
Independent sample t testIndependent sample t test
Independent sample t test
 
Multiple Linear Regression II and ANOVA I
Multiple Linear Regression II and ANOVA IMultiple Linear Regression II and ANOVA I
Multiple Linear Regression II and ANOVA I
 
INFERENTIAL STATISTICS: AN INTRODUCTION
INFERENTIAL STATISTICS: AN INTRODUCTIONINFERENTIAL STATISTICS: AN INTRODUCTION
INFERENTIAL STATISTICS: AN INTRODUCTION
 
Fundamental of Statistics and Types of Correlations
Fundamental of Statistics and Types of CorrelationsFundamental of Statistics and Types of Correlations
Fundamental of Statistics and Types of Correlations
 
Correlation and Regression
Correlation and RegressionCorrelation and Regression
Correlation and Regression
 
Sampling design
Sampling designSampling design
Sampling design
 

Similar to Effect size

Two-Variable (Bivariate) RegressionIn the last unit, we covered
Two-Variable (Bivariate) RegressionIn the last unit, we covered Two-Variable (Bivariate) RegressionIn the last unit, we covered
Two-Variable (Bivariate) RegressionIn the last unit, we covered LacieKlineeb
 
Topic17 regression spss
Topic17 regression spssTopic17 regression spss
Topic17 regression spssSizwan Ahammed
 
Hph7310week2winter2009narr
Hph7310week2winter2009narrHph7310week2winter2009narr
Hph7310week2winter2009narrSarah
 
Logistic regression and analysis using statistical information
Logistic regression and analysis using statistical informationLogistic regression and analysis using statistical information
Logistic regression and analysis using statistical informationAsadJaved304231
 
For this assignment, use the aschooltest.sav dataset.The d
For this assignment, use the aschooltest.sav dataset.The dFor this assignment, use the aschooltest.sav dataset.The d
For this assignment, use the aschooltest.sav dataset.The dMerrileeDelvalle969
 
10Multiple Regression Using More Than One Predictor.docx
10Multiple Regression Using  More Than One Predictor.docx10Multiple Regression Using  More Than One Predictor.docx
10Multiple Regression Using More Than One Predictor.docxhyacinthshackley2629
 
discriminant analysis
discriminant analysisdiscriminant analysis
discriminant analysiskrishnadk
 
chapter 2 post optimality.pptx
chapter 2 post optimality.pptxchapter 2 post optimality.pptx
chapter 2 post optimality.pptxDejeneDay
 
Partial correlation
Partial correlationPartial correlation
Partial correlationDwaitiRoy
 
Estimating a Population Standard Deviation or Variance
Estimating a Population Standard Deviation or VarianceEstimating a Population Standard Deviation or Variance
Estimating a Population Standard Deviation or VarianceLong Beach City College
 
Guide for building GLMS
Guide for building GLMSGuide for building GLMS
Guide for building GLMSAli T. Lotia
 
Prediction of house price using multiple regression
Prediction of house price using multiple regressionPrediction of house price using multiple regression
Prediction of house price using multiple regressionvinovk
 
Increasing Power without Increasing Sample Size
Increasing Power without Increasing Sample SizeIncreasing Power without Increasing Sample Size
Increasing Power without Increasing Sample Sizesmackinnon
 

Similar to Effect size (20)

effectsize.ppt
effectsize.ppteffectsize.ppt
effectsize.ppt
 
Multiple regression
Multiple regressionMultiple regression
Multiple regression
 
Two-Variable (Bivariate) RegressionIn the last unit, we covered
Two-Variable (Bivariate) RegressionIn the last unit, we covered Two-Variable (Bivariate) RegressionIn the last unit, we covered
Two-Variable (Bivariate) RegressionIn the last unit, we covered
 
Topic17 regression spss
Topic17 regression spssTopic17 regression spss
Topic17 regression spss
 
12943625.ppt
12943625.ppt12943625.ppt
12943625.ppt
 
Hph7310week2winter2009narr
Hph7310week2winter2009narrHph7310week2winter2009narr
Hph7310week2winter2009narr
 
Logistic regression and analysis using statistical information
Logistic regression and analysis using statistical informationLogistic regression and analysis using statistical information
Logistic regression and analysis using statistical information
 
For this assignment, use the aschooltest.sav dataset.The d
For this assignment, use the aschooltest.sav dataset.The dFor this assignment, use the aschooltest.sav dataset.The d
For this assignment, use the aschooltest.sav dataset.The d
 
Regression -Linear.pptx
Regression -Linear.pptxRegression -Linear.pptx
Regression -Linear.pptx
 
10Multiple Regression Using More Than One Predictor.docx
10Multiple Regression Using  More Than One Predictor.docx10Multiple Regression Using  More Than One Predictor.docx
10Multiple Regression Using More Than One Predictor.docx
 
Chapter 14
Chapter 14 Chapter 14
Chapter 14
 
discriminant analysis
discriminant analysisdiscriminant analysis
discriminant analysis
 
Simple Regression.pptx
Simple Regression.pptxSimple Regression.pptx
Simple Regression.pptx
 
chapter 2 post optimality.pptx
chapter 2 post optimality.pptxchapter 2 post optimality.pptx
chapter 2 post optimality.pptx
 
Partial correlation
Partial correlationPartial correlation
Partial correlation
 
Estimating a Population Standard Deviation or Variance
Estimating a Population Standard Deviation or VarianceEstimating a Population Standard Deviation or Variance
Estimating a Population Standard Deviation or Variance
 
Meta analysis with R
Meta analysis with RMeta analysis with R
Meta analysis with R
 
Guide for building GLMS
Guide for building GLMSGuide for building GLMS
Guide for building GLMS
 
Prediction of house price using multiple regression
Prediction of house price using multiple regressionPrediction of house price using multiple regression
Prediction of house price using multiple regression
 
Increasing Power without Increasing Sample Size
Increasing Power without Increasing Sample SizeIncreasing Power without Increasing Sample Size
Increasing Power without Increasing Sample Size
 

More from Sr Edith Bogue

How to Report Test Results
How to Report Test ResultsHow to Report Test Results
How to Report Test ResultsSr Edith Bogue
 
Introduction to the t test
Introduction to the t testIntroduction to the t test
Introduction to the t testSr Edith Bogue
 
Principles of Design (Williams)
Principles of Design (Williams)Principles of Design (Williams)
Principles of Design (Williams)Sr Edith Bogue
 
Two-Way ANOVA Overview & SPSS interpretation
Two-Way ANOVA Overview & SPSS interpretationTwo-Way ANOVA Overview & SPSS interpretation
Two-Way ANOVA Overview & SPSS interpretationSr Edith Bogue
 
Repeated Measures ANOVA - Overview
Repeated Measures ANOVA - OverviewRepeated Measures ANOVA - Overview
Repeated Measures ANOVA - OverviewSr Edith Bogue
 
Oneway ANOVA - Overview
Oneway ANOVA - OverviewOneway ANOVA - Overview
Oneway ANOVA - OverviewSr Edith Bogue
 
One-Sample Hypothesis Tests
One-Sample Hypothesis TestsOne-Sample Hypothesis Tests
One-Sample Hypothesis TestsSr Edith Bogue
 
Review & Hypothesis Testing
Review & Hypothesis TestingReview & Hypothesis Testing
Review & Hypothesis TestingSr Edith Bogue
 
Sustaining the Ministry of Sponsorship
Sustaining the Ministry of SponsorshipSustaining the Ministry of Sponsorship
Sustaining the Ministry of SponsorshipSr Edith Bogue
 
Data Management - Basic Concepts
Data Management - Basic ConceptsData Management - Basic Concepts
Data Management - Basic ConceptsSr Edith Bogue
 
Central Tendency - Overview
Central Tendency - Overview Central Tendency - Overview
Central Tendency - Overview Sr Edith Bogue
 
Introduction to z-Scores
Introduction to z-Scores Introduction to z-Scores
Introduction to z-Scores Sr Edith Bogue
 
Introduction to Statistics
Introduction to StatisticsIntroduction to Statistics
Introduction to StatisticsSr Edith Bogue
 

More from Sr Edith Bogue (20)

How to Report Test Results
How to Report Test ResultsHow to Report Test Results
How to Report Test Results
 
Introduction to the t test
Introduction to the t testIntroduction to the t test
Introduction to the t test
 
Location Scores
Location  ScoresLocation  Scores
Location Scores
 
Variability
VariabilityVariability
Variability
 
Principles of Design (Williams)
Principles of Design (Williams)Principles of Design (Williams)
Principles of Design (Williams)
 
Levels of Measurement
Levels of MeasurementLevels of Measurement
Levels of Measurement
 
Chi-Square Example
Chi-Square ExampleChi-Square Example
Chi-Square Example
 
Two-Way ANOVA Overview & SPSS interpretation
Two-Way ANOVA Overview & SPSS interpretationTwo-Way ANOVA Overview & SPSS interpretation
Two-Way ANOVA Overview & SPSS interpretation
 
Repeated Measures ANOVA - Overview
Repeated Measures ANOVA - OverviewRepeated Measures ANOVA - Overview
Repeated Measures ANOVA - Overview
 
Oneway ANOVA - Overview
Oneway ANOVA - OverviewOneway ANOVA - Overview
Oneway ANOVA - Overview
 
One-Sample Hypothesis Tests
One-Sample Hypothesis TestsOne-Sample Hypothesis Tests
One-Sample Hypothesis Tests
 
Review & Hypothesis Testing
Review & Hypothesis TestingReview & Hypothesis Testing
Review & Hypothesis Testing
 
Sustaining the Ministry of Sponsorship
Sustaining the Ministry of SponsorshipSustaining the Ministry of Sponsorship
Sustaining the Ministry of Sponsorship
 
Demographic Processes
Demographic ProcessesDemographic Processes
Demographic Processes
 
Location scores
Location scoresLocation scores
Location scores
 
Data Management - Basic Concepts
Data Management - Basic ConceptsData Management - Basic Concepts
Data Management - Basic Concepts
 
Central Tendency - Overview
Central Tendency - Overview Central Tendency - Overview
Central Tendency - Overview
 
Introduction to z-Scores
Introduction to z-Scores Introduction to z-Scores
Introduction to z-Scores
 
Graphing
GraphingGraphing
Graphing
 
Introduction to Statistics
Introduction to StatisticsIntroduction to Statistics
Introduction to Statistics
 

Effect size

  • 2.  Significance: Is there evidence that this event would be unlikely, if the null hypothesis were true?  An result can be significant but the size of the difference might be very small  If sample size is very large  If variability is quite small  Effect size can also be measured and compared.
  • 3.  In Correlation, we computed r2 to see the amount of shared variability between two variables.  A correlation of r = .7 meant that 49% of the variability was “shared” or “explained” by the relationship of the two variables.  This gave us a measure that increased in a linear way (unlike r) to talk about the size of the correlation.
  • 4. Effect size could be measured with Cohen’s d as follows: mean difference standard deviation d  d = .2 or less is a small effect size d between .2 and .8 is a medium effect size d greater than .8 is a large effect size
  • 5. r2 can also be computed after a t-test using the equation: df r 2 t   2 2 t Interpretation: The percent of variability in the variable that is due to treatment group.
  • 6. Same idea of shared variance as we saw in r2 2 between SS   total SS Interpretation: The percent of variability in the variable that is due to treatment group.
  • 7.  Enter data for our sample problem  Instead of Group ABC, use codes 1, 2 and 3.  Add value labels for praise levels  Add variable names  Consult Cronk book  Do your own write-up of the results, including a measure of Effect Size. Group X A 7 A 6 A 5 A 8 A 3 A 7 B 4 B 6 B 4 B 7 B 5 B 7 C 3 C 2 C 1 C 3 C 4 C 1 ΣX 83 Mean 4.6111