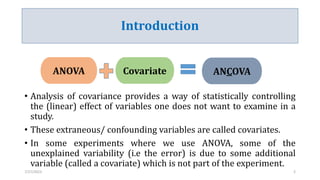
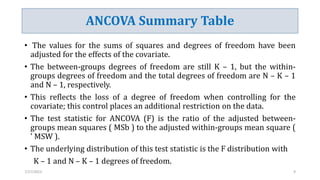
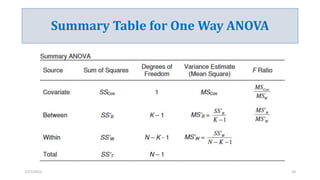
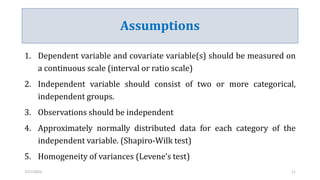
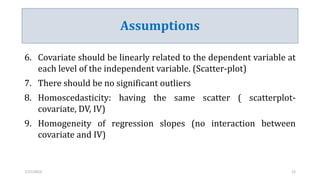
Presented By:
Anil Khanal (Roll no:2)
Sunita Poudel (Roll no:8)
Yamuna Thapa (Roll no: 10)
Introduction
• Analysis of covariance provides a way of statistically controlling
the (linear) effect of variables one does not want to examine in a
study.
• These extraneous/ confounding variables are called covariates.
• In some experiments where we use ANOVA, some of the
unexplained variability (i.e the error) is due to some additional
variable (called a covariate) which is not part of the experiment.
ANCOVA
ANOVA Covariate
7/27/2023 2
Introduction
• ANCOVA is the statistical technique that combines regression and ANOVA.
• ANCOVA determines the covariation (correlation) between the
covariate(s) and the dependent variable and then removes that variance
associated with the covariate(s) from the dependent variable scores, prior
to determining whether the differences between the experimental
condition (dependent variable score) means are significant.
• Remove effect of covariate---Reduce error variance---More accurate
picture of true effect of independent variables. (ANCOVA)
7/27/2023 3
Extension of Multiple Regressions
• ANOVA compares group means, ANCOVA compares adjusted mean
• Like regression analysis, ANCOVA enables you to look at how an independent
variable acts on a dependent variable. ANCOVA removes any effect of covariates,
which are variables you don’t want to study.
• Example: You might want to find out if a new drug works for depression. The
study has three treatment groups and one control group. A regular ANOVA can
tell you if the treatment works. ANCOVA can control for other factors that might
influence the outcome. For example: family life, job status, or drug use.
7/27/2023 4
Extension of ANOVA
• As an extension of ANOVA, ANCOVA can be used in two ways (Leech et.
al, 2005):
• To control for covariates (typically continuous or variables on a
particular scale) that aren’t the main focus of your study.
• To study combinations of categorical and continuous variables, or
variables on a scale as predictors. In this case, the covariate is a
variable of interest (as opposed to one you want to control for).
7/27/2023 5
Examples
Teaching method
Lecture
Method
Lecture with
demonstration
Video based
teaching
Intelligence A B C
Achievement X Y Z
• Teaching method: Independent Variable
• Achievement: Dependent Variable
• Intelligence: Covariate
7/27/2023 6
Examples
• In a study to test the effects of antihypertensive drugs on Systolic Blood
Pressure in participants of varying age. The change in SBP after treatment
(a continuous variable) is the dependent variable, and the independent
variables might be age (a continuous variable) and treatment (a categoric
variable).
• In an experiment to see how corn plants tolerate drought. Level of drought
is the actual “treatment”, but it isn't the only factor that affects how plants
perform: size is a known factor that affects tolerance levels, so you would
run plant size as a covariate.
7/27/2023 7
Setting up Null and Alternative Hypothesis
• The null hypothesis and the alternative hypothesis for ANCOVA are similar to
those for ANOVA.
• Conceptually, however, these population means have been adjusted for the
covariate.
H0:µ1 = µ2 = µ k i.e. the means of population from which k samples drawn
are equal to one another.
H1: µ1 ≠ µ2 ≠ µk i.e. the means of population from which k samples drawn
are not equal to one another or at least two of the population means are not
equal.
7/27/2023 8
ANCOVA Summary Table
• The values for the sums of squares and degrees of freedom have been
adjusted for the effects of the covariate.
• The between-groups degrees of freedom are still K – 1, but the within-
groups degrees of freedom and the total degrees of freedom are N – K – 1
and N – 1, respectively.
• This reflects the loss of a degree of freedom when controlling for the
covariate; this control places an additional restriction on the data.
• The test statistic for ANCOVA (F) is the ratio of the adjusted between-
groups mean squares ( MSb ) to the adjusted within-groups mean square (
' MSW ).
• The underlying distribution of this test statistic is the F distribution with
K – 1 and N – K – 1 degrees of freedom.
7/27/2023 9
Summary Table for One Way ANOVA
7/27/2023 10
Assumptions
1. Dependent variable and covariate variable(s) should be measured on
a continuous scale (interval or ratio scale)
2. Independent variable should consist of two or more categorical,
independent groups.
3. Observations should be independent
4. Approximately normally distributed data for each category of the
independent variable. (Shapiro-Wilk test)
5. Homogeneity of variances (Levene’s test)
7/27/2023 11
Assumptions
6. Covariate should be linearly related to the dependent variable at
each level of the independent variable. (Scatter-plot)
7. There should be no significant outliers
8. Homoscedasticity: having the same scatter ( scatterplot-
covariate, DV, IV)
9. Homogeneity of regression slopes (no interaction between
covariate and IV)
7/27/2023 12
References
• Horn, R. (n.d.). Understanding Analysis of Covariance. Retrieved October 26, 2017
from: http://oak.ucc.nau.edu/rh232/courses/eps625/
• https://psfaculty.plantsciences.ucdavis.edu/agr205/Lectures/2011_Lectures/L13_A
NCOVA.pdf
• https://www.youtube.com/watch?v=jEswYprHUgM&t=27s&ab_channel=MetaEduca
tion
• https://statistics.laerd.com/spss-tutorials/ancova-using-spss-statistics.php
• https://www.statisticshowto.com/ancova/
• http://oak.ucc.nau.edu/rh232/courses/eps625/handouts/ancova/understanding%
20ancova.pdf
7/27/2023 13
Thank You!
7/27/2023 14

Analysis of Covariance.pptx

  • 1.
    Presented By: Anil Khanal(Roll no:2) Sunita Poudel (Roll no:8) Yamuna Thapa (Roll no: 10)
  • 2.
    Introduction • Analysis ofcovariance provides a way of statistically controlling the (linear) effect of variables one does not want to examine in a study. • These extraneous/ confounding variables are called covariates. • In some experiments where we use ANOVA, some of the unexplained variability (i.e the error) is due to some additional variable (called a covariate) which is not part of the experiment. ANCOVA ANOVA Covariate 7/27/2023 2
  • 3.
    Introduction • ANCOVA isthe statistical technique that combines regression and ANOVA. • ANCOVA determines the covariation (correlation) between the covariate(s) and the dependent variable and then removes that variance associated with the covariate(s) from the dependent variable scores, prior to determining whether the differences between the experimental condition (dependent variable score) means are significant. • Remove effect of covariate---Reduce error variance---More accurate picture of true effect of independent variables. (ANCOVA) 7/27/2023 3
  • 4.
    Extension of MultipleRegressions • ANOVA compares group means, ANCOVA compares adjusted mean • Like regression analysis, ANCOVA enables you to look at how an independent variable acts on a dependent variable. ANCOVA removes any effect of covariates, which are variables you don’t want to study. • Example: You might want to find out if a new drug works for depression. The study has three treatment groups and one control group. A regular ANOVA can tell you if the treatment works. ANCOVA can control for other factors that might influence the outcome. For example: family life, job status, or drug use. 7/27/2023 4
  • 5.
    Extension of ANOVA •As an extension of ANOVA, ANCOVA can be used in two ways (Leech et. al, 2005): • To control for covariates (typically continuous or variables on a particular scale) that aren’t the main focus of your study. • To study combinations of categorical and continuous variables, or variables on a scale as predictors. In this case, the covariate is a variable of interest (as opposed to one you want to control for). 7/27/2023 5
  • 6.
    Examples Teaching method Lecture Method Lecture with demonstration Videobased teaching Intelligence A B C Achievement X Y Z • Teaching method: Independent Variable • Achievement: Dependent Variable • Intelligence: Covariate 7/27/2023 6
  • 7.
    Examples • In astudy to test the effects of antihypertensive drugs on Systolic Blood Pressure in participants of varying age. The change in SBP after treatment (a continuous variable) is the dependent variable, and the independent variables might be age (a continuous variable) and treatment (a categoric variable). • In an experiment to see how corn plants tolerate drought. Level of drought is the actual “treatment”, but it isn't the only factor that affects how plants perform: size is a known factor that affects tolerance levels, so you would run plant size as a covariate. 7/27/2023 7
  • 8.
    Setting up Nulland Alternative Hypothesis • The null hypothesis and the alternative hypothesis for ANCOVA are similar to those for ANOVA. • Conceptually, however, these population means have been adjusted for the covariate. H0:µ1 = µ2 = µ k i.e. the means of population from which k samples drawn are equal to one another. H1: µ1 ≠ µ2 ≠ µk i.e. the means of population from which k samples drawn are not equal to one another or at least two of the population means are not equal. 7/27/2023 8
  • 9.
    ANCOVA Summary Table •The values for the sums of squares and degrees of freedom have been adjusted for the effects of the covariate. • The between-groups degrees of freedom are still K – 1, but the within- groups degrees of freedom and the total degrees of freedom are N – K – 1 and N – 1, respectively. • This reflects the loss of a degree of freedom when controlling for the covariate; this control places an additional restriction on the data. • The test statistic for ANCOVA (F) is the ratio of the adjusted between- groups mean squares ( MSb ) to the adjusted within-groups mean square ( ' MSW ). • The underlying distribution of this test statistic is the F distribution with K – 1 and N – K – 1 degrees of freedom. 7/27/2023 9
  • 10.
    Summary Table forOne Way ANOVA 7/27/2023 10
  • 11.
    Assumptions 1. Dependent variableand covariate variable(s) should be measured on a continuous scale (interval or ratio scale) 2. Independent variable should consist of two or more categorical, independent groups. 3. Observations should be independent 4. Approximately normally distributed data for each category of the independent variable. (Shapiro-Wilk test) 5. Homogeneity of variances (Levene’s test) 7/27/2023 11
  • 12.
    Assumptions 6. Covariate shouldbe linearly related to the dependent variable at each level of the independent variable. (Scatter-plot) 7. There should be no significant outliers 8. Homoscedasticity: having the same scatter ( scatterplot- covariate, DV, IV) 9. Homogeneity of regression slopes (no interaction between covariate and IV) 7/27/2023 12
  • 13.
    References • Horn, R.(n.d.). Understanding Analysis of Covariance. Retrieved October 26, 2017 from: http://oak.ucc.nau.edu/rh232/courses/eps625/ • https://psfaculty.plantsciences.ucdavis.edu/agr205/Lectures/2011_Lectures/L13_A NCOVA.pdf • https://www.youtube.com/watch?v=jEswYprHUgM&t=27s&ab_channel=MetaEduca tion • https://statistics.laerd.com/spss-tutorials/ancova-using-spss-statistics.php • https://www.statisticshowto.com/ancova/ • http://oak.ucc.nau.edu/rh232/courses/eps625/handouts/ancova/understanding% 20ancova.pdf 7/27/2023 13
  • 14.

Editor's Notes

  • #12 Source: https://statistics.laerd.com/spss-tutorials/ancova-using-spss-statistics.php