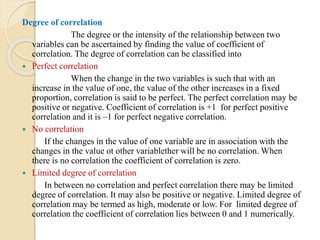
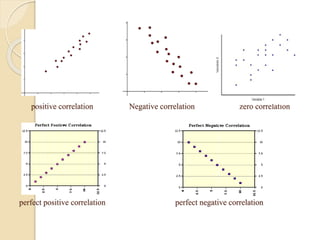
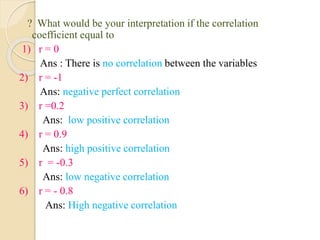
WELCOME…
CORRELATION
DEFINITION
 The variables are said to be correlated if the changes in one
variable results in a corresponding change in the other
variable. That is, when two variables move together we say
they are correlated.
 Boddington states that “ whenever some definite connection
exists between the two or more groups, classes or series or
data there is said to be correlation”.
 Bowely defines correlation as, “ when two quantities are so
related that the fluctuations in one are in sympathy with the
fluctuations of the other, that an increase or decrease of the
one is found in connection with the increase or decrease of the
other and greater the magnitude of change in the other, the
quantities are said to be correlated”
 According to A. M Tuttle, “correlation is an analysis of the
association between two or more variables.
 Simply, correlation may be defined as the degree of
relationship between two variables.
 “Correlation analysis” the purpose of which is the
determination of degree of relationship between the variables
 The method of correlation is developed by FRANCIS
GALTON in 1885.
TYPES OF CORRELATION
The different types of correlation are
o Positive and Negative correlation
o Linear and Non-linear correlation
o Simple, Multiple and Partial correlation.
 Positive Correlation
When the values of two variables move same direction,
correlation is said to be positive
ie; an increase in the value of one variable results into an
increase in the other variable also or if decrease in the value
of one variable results into a decrease in the other variable
also correlation is said to be positive.
Eg. Temperature and volume
 Negative correlation
When the values of two variables move opposite direction,
correlation is said to be negative.
ie; an increase in the value of one variable results into an decrease in the
other variable also or if decrease in the value of one variable results into a
increase in the other variable also correlation is said to be positive.
Eg. Pressure and volume
 Linear Correlation
When the amount of change in one variable leads to a constant ratio
of change in the other variable, correlation is said to be linear.
 Non linear Correlation
Correlation is said to be non linear (curve linear) when the amount of
change in one variable is not in constant ratio to the change in the other
variable.
 Simple correlation
In the study of relationship between the variables, if there are
only two variables, the correlation is said to be simple.
When one variable is related to a number of others, the correlation
is not simple.
 Multiple correlation
In the study of multiple correlation we measure the degree of
association between one variable on one side and all the other
variable together on the other side.
 Partial correlation
In partial correlation we study the relationship of one variable
with one of the other variables presuming that the other variable
remains constant.
Degree of correlation
The degree or the intensity of the relationship between two
variables can be ascertained by finding the value of coefficient of
correlation. The degree of correlation can be classified into
 Perfect correlation
When the change in the two variables is such that with an
increase in the value of one, the value of the other increases in a fixed
proportion, correlation is said to be perfect. The perfect correlation may be
positive or negative. Coefficient of correlation is +1 for perfect positive
correlation and it is –1 for perfect negative correlation.
 No correlation
If the changes in the value of one variable are in association with the
changes in the value ot other variablether will be no correlation. When
there is no correlation the coefficient of correlation is zero.
 Limited degree of correlation
In between no correlation and perfect correlation there may be limited
degree of correlation. It may also be positive or negative. Limited degree of
correlation may be termed as high, moderate or low. For limited degree of
correlation the coefficient of correlation lies between 0 and 1 numerically.
METHODS FOR STUDYING CORRELATION
Correlation between two variables can be measured by both graphic
and algebraic method. Scatter diagram and correlation graph are
the two important graphic methods while coefficient of correlation
is an algebraic method used for measuring correlation.
a) Scatter diagram
This is a graphical method of studying the correlation between two
variables. One of the variable is shown on the X- axis and the other
on the Y-axis. Each pair of values is plotted on the graph by means
of a dot mark. After all the items are plotted we get as many dots
on the graph paper as the number of points. If these points show
some trend either upward or downward, the two variables are said
to be correlated. If the point do not show any trend, the two
variables are not correlated.
positive correlation Negative correlation zero correlation
perfect positive correlation perfect negative correlation
b) Correlation Graph
Under this method, separate curves are drawn for the X variable
and Y variable on the same graph paper. The values of the variable
are taken as ordinates of the points plotted. From the direction and
closeness of the two curves we can infer whether the variables are
related. If both the curves are move in the same direction(upward or
downward), correlation is said to be positive. If the curves are
moving in the opposite direction correlation is said to be negative.
c) Coefficient of correlation
 Coefficient of correlation is an algebraic method of measuring
correlation.
 Under this method, we measure correlation by finding a value
known as the coefficient of correlation using an appropriate
formula.
 Coefficient of correlation is a numerical value. It shows the degree
or the extent of correlation between two variables.
 Coefficient of correlation is a pure number lying between -1
and +1.
 When the correlation is negative, it lies between -1 and 0.
 When the correlation is positive, it lies between 0 and 1.
 When the correlation of coefficient is zero, it indicates that
there is no correlation between the variables.
 When the correlation coefficient is 1,there is perfect
correlation.
 Between no correlation and perfect correlation there are
varying degree of correlation.
Coefficient of correlation can be computed by applying the
methods given below
 Karl Pearson’s method
 Spearman’s method
 Concurrent deviation method
PROPERTIES OF COEFFICIENT OF CORRELATION
1. Correlation coefficient has a well defined formula
2. Correlation coefficient is a pure number and is independent of
its units of measurement.
3. It lies between -1 and +1.
4. Correlation coefficient does not change with reference to
change of origin or change of scale.
5. Correlation of coefficient between x and y is same as that
between y and x.
IMPORTANCE OF CORRELATION
 Correlation helps to study the association between two
variables.
 Coefficient of correlation is vital for all kinds of research
work.
 It helps in establishing Validity or Reliability of an evaluation
tool.
 It helps to ascertain the traits and capacities of pupils while
giving guidance or counselling.
 Correlation analysis helps to estimate the future values.
? What would be your interpretation if the correlation
coefficient equal to
1) r = 0
Ans : There is no correlation between the variables
2) r = -1
Ans: negative perfect correlation
3) r =0.2
Ans: low positive correlation
4) r = 0.9
Ans: high positive correlation
5) r = -0.3
Ans: low negative correlation
6) r = - 0.8
Ans: High negative correlation
THANK YOU…

Correlation

  • 1.
  • 2.
    CORRELATION DEFINITION  The variablesare said to be correlated if the changes in one variable results in a corresponding change in the other variable. That is, when two variables move together we say they are correlated.  Boddington states that “ whenever some definite connection exists between the two or more groups, classes or series or data there is said to be correlation”.  Bowely defines correlation as, “ when two quantities are so related that the fluctuations in one are in sympathy with the fluctuations of the other, that an increase or decrease of the one is found in connection with the increase or decrease of the other and greater the magnitude of change in the other, the quantities are said to be correlated”
  • 3.
     According toA. M Tuttle, “correlation is an analysis of the association between two or more variables.  Simply, correlation may be defined as the degree of relationship between two variables.  “Correlation analysis” the purpose of which is the determination of degree of relationship between the variables  The method of correlation is developed by FRANCIS GALTON in 1885.
  • 4.
    TYPES OF CORRELATION Thedifferent types of correlation are o Positive and Negative correlation o Linear and Non-linear correlation o Simple, Multiple and Partial correlation.  Positive Correlation When the values of two variables move same direction, correlation is said to be positive ie; an increase in the value of one variable results into an increase in the other variable also or if decrease in the value of one variable results into a decrease in the other variable also correlation is said to be positive. Eg. Temperature and volume
  • 5.
     Negative correlation Whenthe values of two variables move opposite direction, correlation is said to be negative. ie; an increase in the value of one variable results into an decrease in the other variable also or if decrease in the value of one variable results into a increase in the other variable also correlation is said to be positive. Eg. Pressure and volume  Linear Correlation When the amount of change in one variable leads to a constant ratio of change in the other variable, correlation is said to be linear.  Non linear Correlation Correlation is said to be non linear (curve linear) when the amount of change in one variable is not in constant ratio to the change in the other variable.
  • 6.
     Simple correlation Inthe study of relationship between the variables, if there are only two variables, the correlation is said to be simple. When one variable is related to a number of others, the correlation is not simple.  Multiple correlation In the study of multiple correlation we measure the degree of association between one variable on one side and all the other variable together on the other side.  Partial correlation In partial correlation we study the relationship of one variable with one of the other variables presuming that the other variable remains constant.
  • 7.
    Degree of correlation Thedegree or the intensity of the relationship between two variables can be ascertained by finding the value of coefficient of correlation. The degree of correlation can be classified into  Perfect correlation When the change in the two variables is such that with an increase in the value of one, the value of the other increases in a fixed proportion, correlation is said to be perfect. The perfect correlation may be positive or negative. Coefficient of correlation is +1 for perfect positive correlation and it is –1 for perfect negative correlation.  No correlation If the changes in the value of one variable are in association with the changes in the value ot other variablether will be no correlation. When there is no correlation the coefficient of correlation is zero.  Limited degree of correlation In between no correlation and perfect correlation there may be limited degree of correlation. It may also be positive or negative. Limited degree of correlation may be termed as high, moderate or low. For limited degree of correlation the coefficient of correlation lies between 0 and 1 numerically.
  • 8.
    METHODS FOR STUDYINGCORRELATION Correlation between two variables can be measured by both graphic and algebraic method. Scatter diagram and correlation graph are the two important graphic methods while coefficient of correlation is an algebraic method used for measuring correlation. a) Scatter diagram This is a graphical method of studying the correlation between two variables. One of the variable is shown on the X- axis and the other on the Y-axis. Each pair of values is plotted on the graph by means of a dot mark. After all the items are plotted we get as many dots on the graph paper as the number of points. If these points show some trend either upward or downward, the two variables are said to be correlated. If the point do not show any trend, the two variables are not correlated.
  • 9.
    positive correlation Negativecorrelation zero correlation perfect positive correlation perfect negative correlation
  • 10.
    b) Correlation Graph Underthis method, separate curves are drawn for the X variable and Y variable on the same graph paper. The values of the variable are taken as ordinates of the points plotted. From the direction and closeness of the two curves we can infer whether the variables are related. If both the curves are move in the same direction(upward or downward), correlation is said to be positive. If the curves are moving in the opposite direction correlation is said to be negative. c) Coefficient of correlation  Coefficient of correlation is an algebraic method of measuring correlation.  Under this method, we measure correlation by finding a value known as the coefficient of correlation using an appropriate formula.  Coefficient of correlation is a numerical value. It shows the degree or the extent of correlation between two variables.
  • 11.
     Coefficient ofcorrelation is a pure number lying between -1 and +1.  When the correlation is negative, it lies between -1 and 0.  When the correlation is positive, it lies between 0 and 1.  When the correlation of coefficient is zero, it indicates that there is no correlation between the variables.  When the correlation coefficient is 1,there is perfect correlation.  Between no correlation and perfect correlation there are varying degree of correlation. Coefficient of correlation can be computed by applying the methods given below  Karl Pearson’s method  Spearman’s method  Concurrent deviation method
  • 12.
    PROPERTIES OF COEFFICIENTOF CORRELATION 1. Correlation coefficient has a well defined formula 2. Correlation coefficient is a pure number and is independent of its units of measurement. 3. It lies between -1 and +1. 4. Correlation coefficient does not change with reference to change of origin or change of scale. 5. Correlation of coefficient between x and y is same as that between y and x.
  • 13.
    IMPORTANCE OF CORRELATION Correlation helps to study the association between two variables.  Coefficient of correlation is vital for all kinds of research work.  It helps in establishing Validity or Reliability of an evaluation tool.  It helps to ascertain the traits and capacities of pupils while giving guidance or counselling.  Correlation analysis helps to estimate the future values.
  • 14.
    ? What wouldbe your interpretation if the correlation coefficient equal to 1) r = 0 Ans : There is no correlation between the variables 2) r = -1 Ans: negative perfect correlation 3) r =0.2 Ans: low positive correlation 4) r = 0.9 Ans: high positive correlation 5) r = -0.3 Ans: low negative correlation 6) r = - 0.8 Ans: High negative correlation
  • 15.