Download as ODP, PPTX
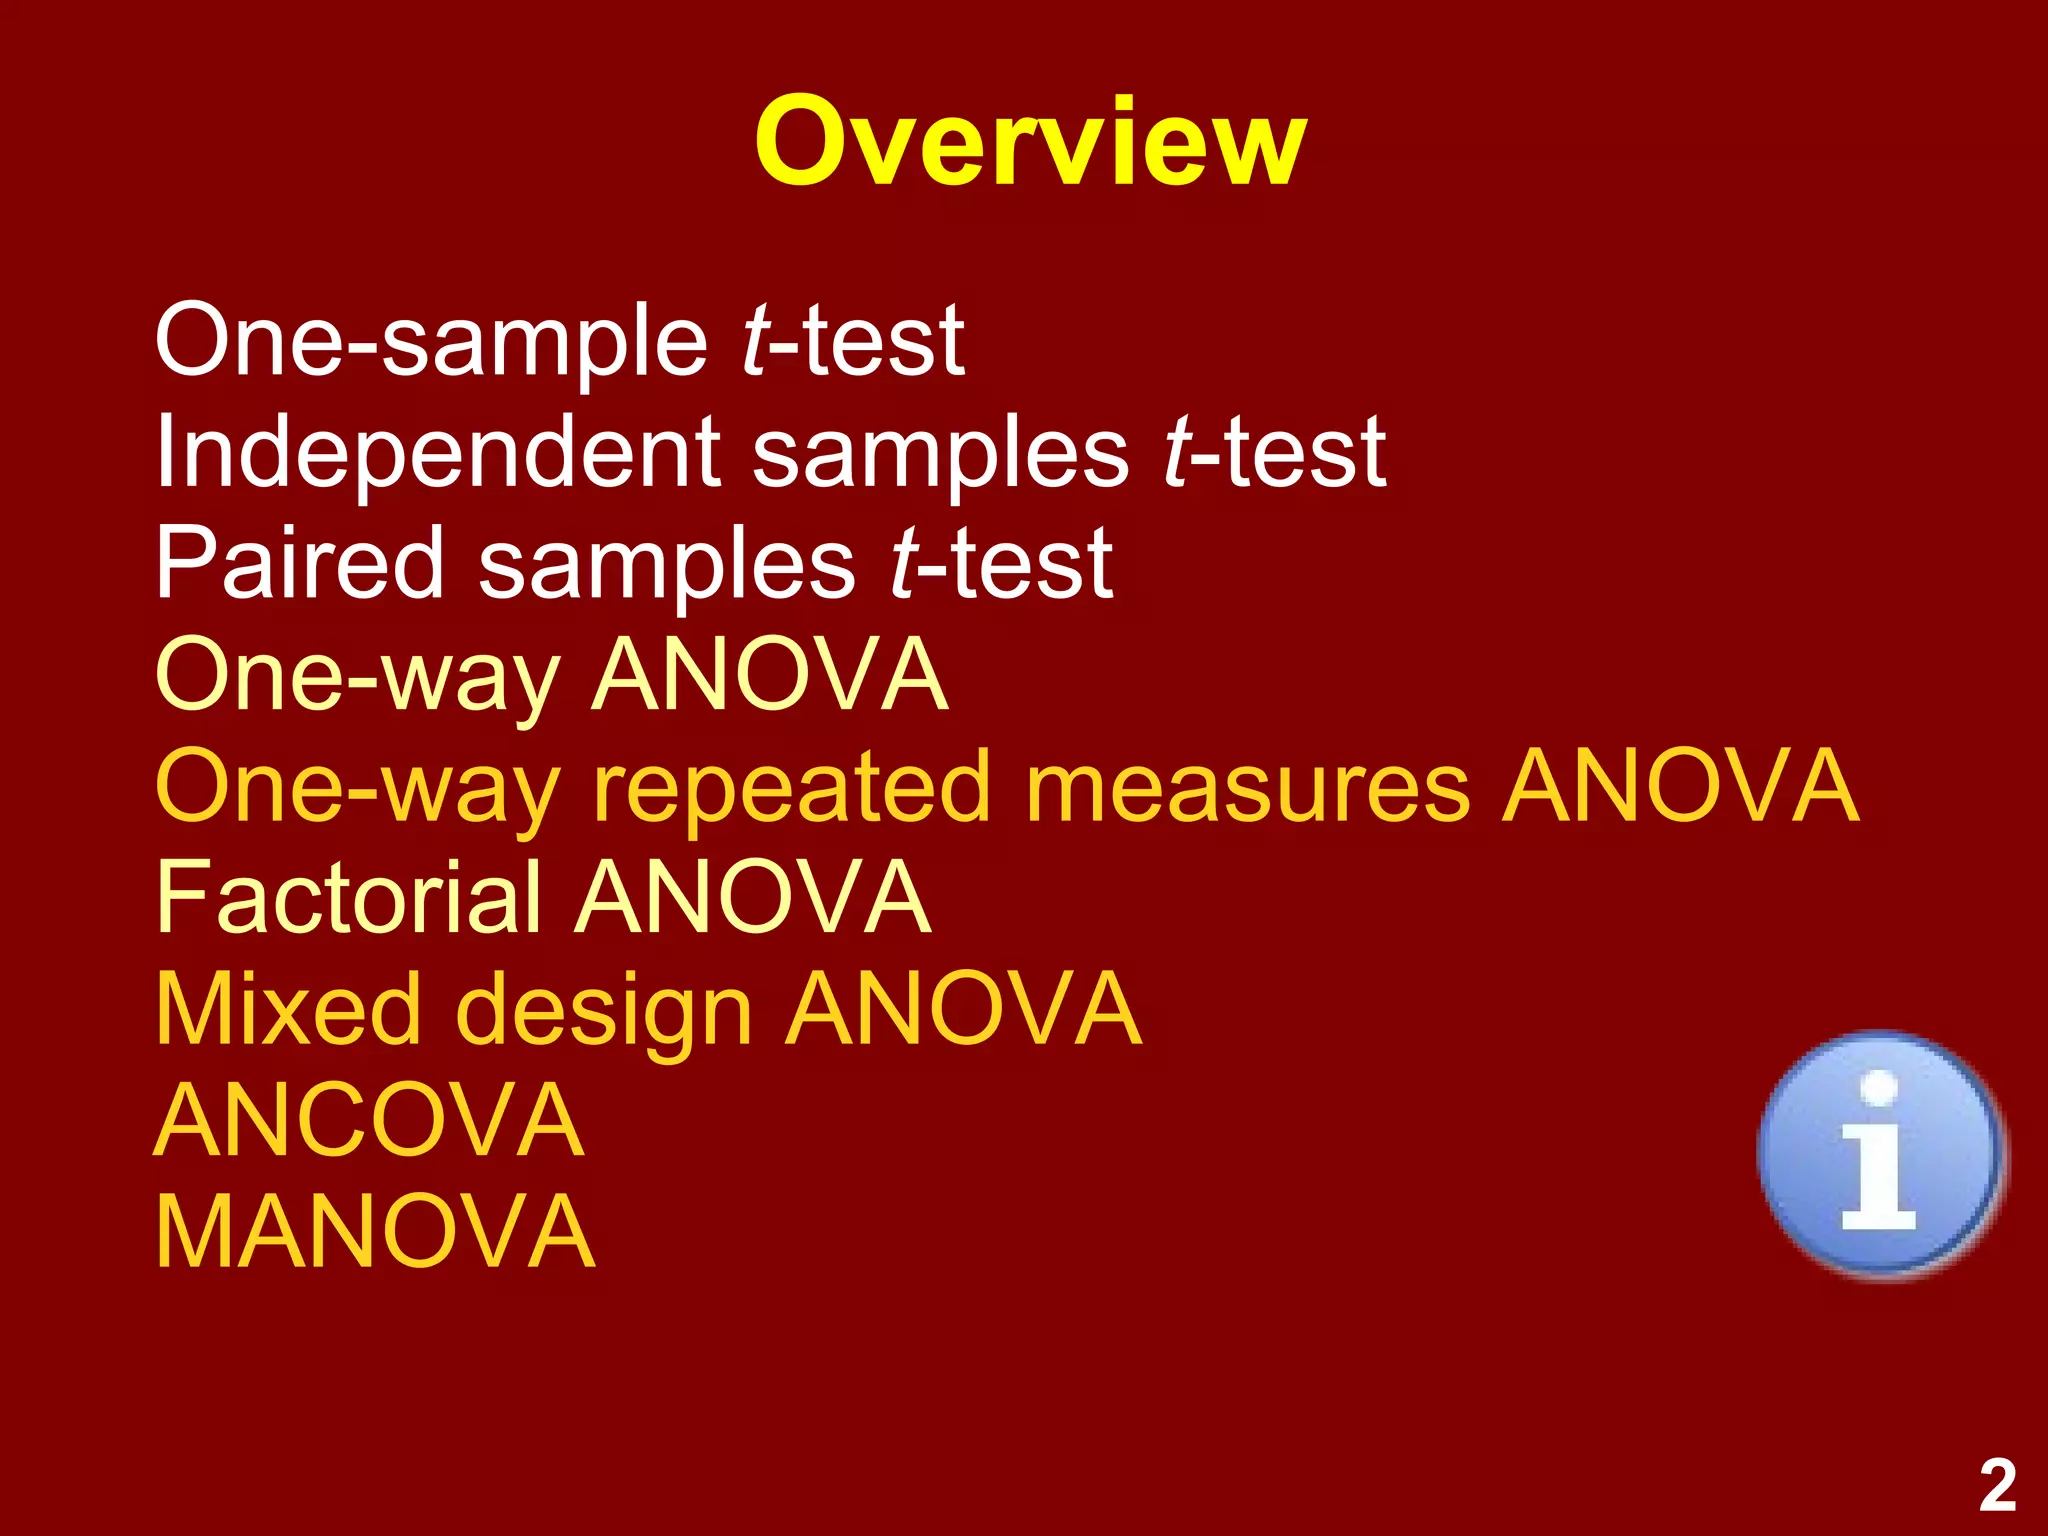


This document provides an overview of various statistical analyses that can be used in psychological research, including t-tests, analysis of variance (ANOVA), repeated measures ANOVA, factorial ANOVA, mixed ANOVA, analysis of covariance (ANCOVA), and multivariate analysis of variance (MANOVA). Examples of research questions that could be addressed with each type of analysis are provided. Key assumptions, procedures, and interpretations for each analysis are discussed at a high level.
Lecture on ANOVA and survey research design in psychology covering key statistical tests like one-sample t-test, factorial ANOVA, and mixed design.
Introduces variance analysis principles; distinctions between t-tests for different sample types; prior knowledge necessary for understanding ANOVA.
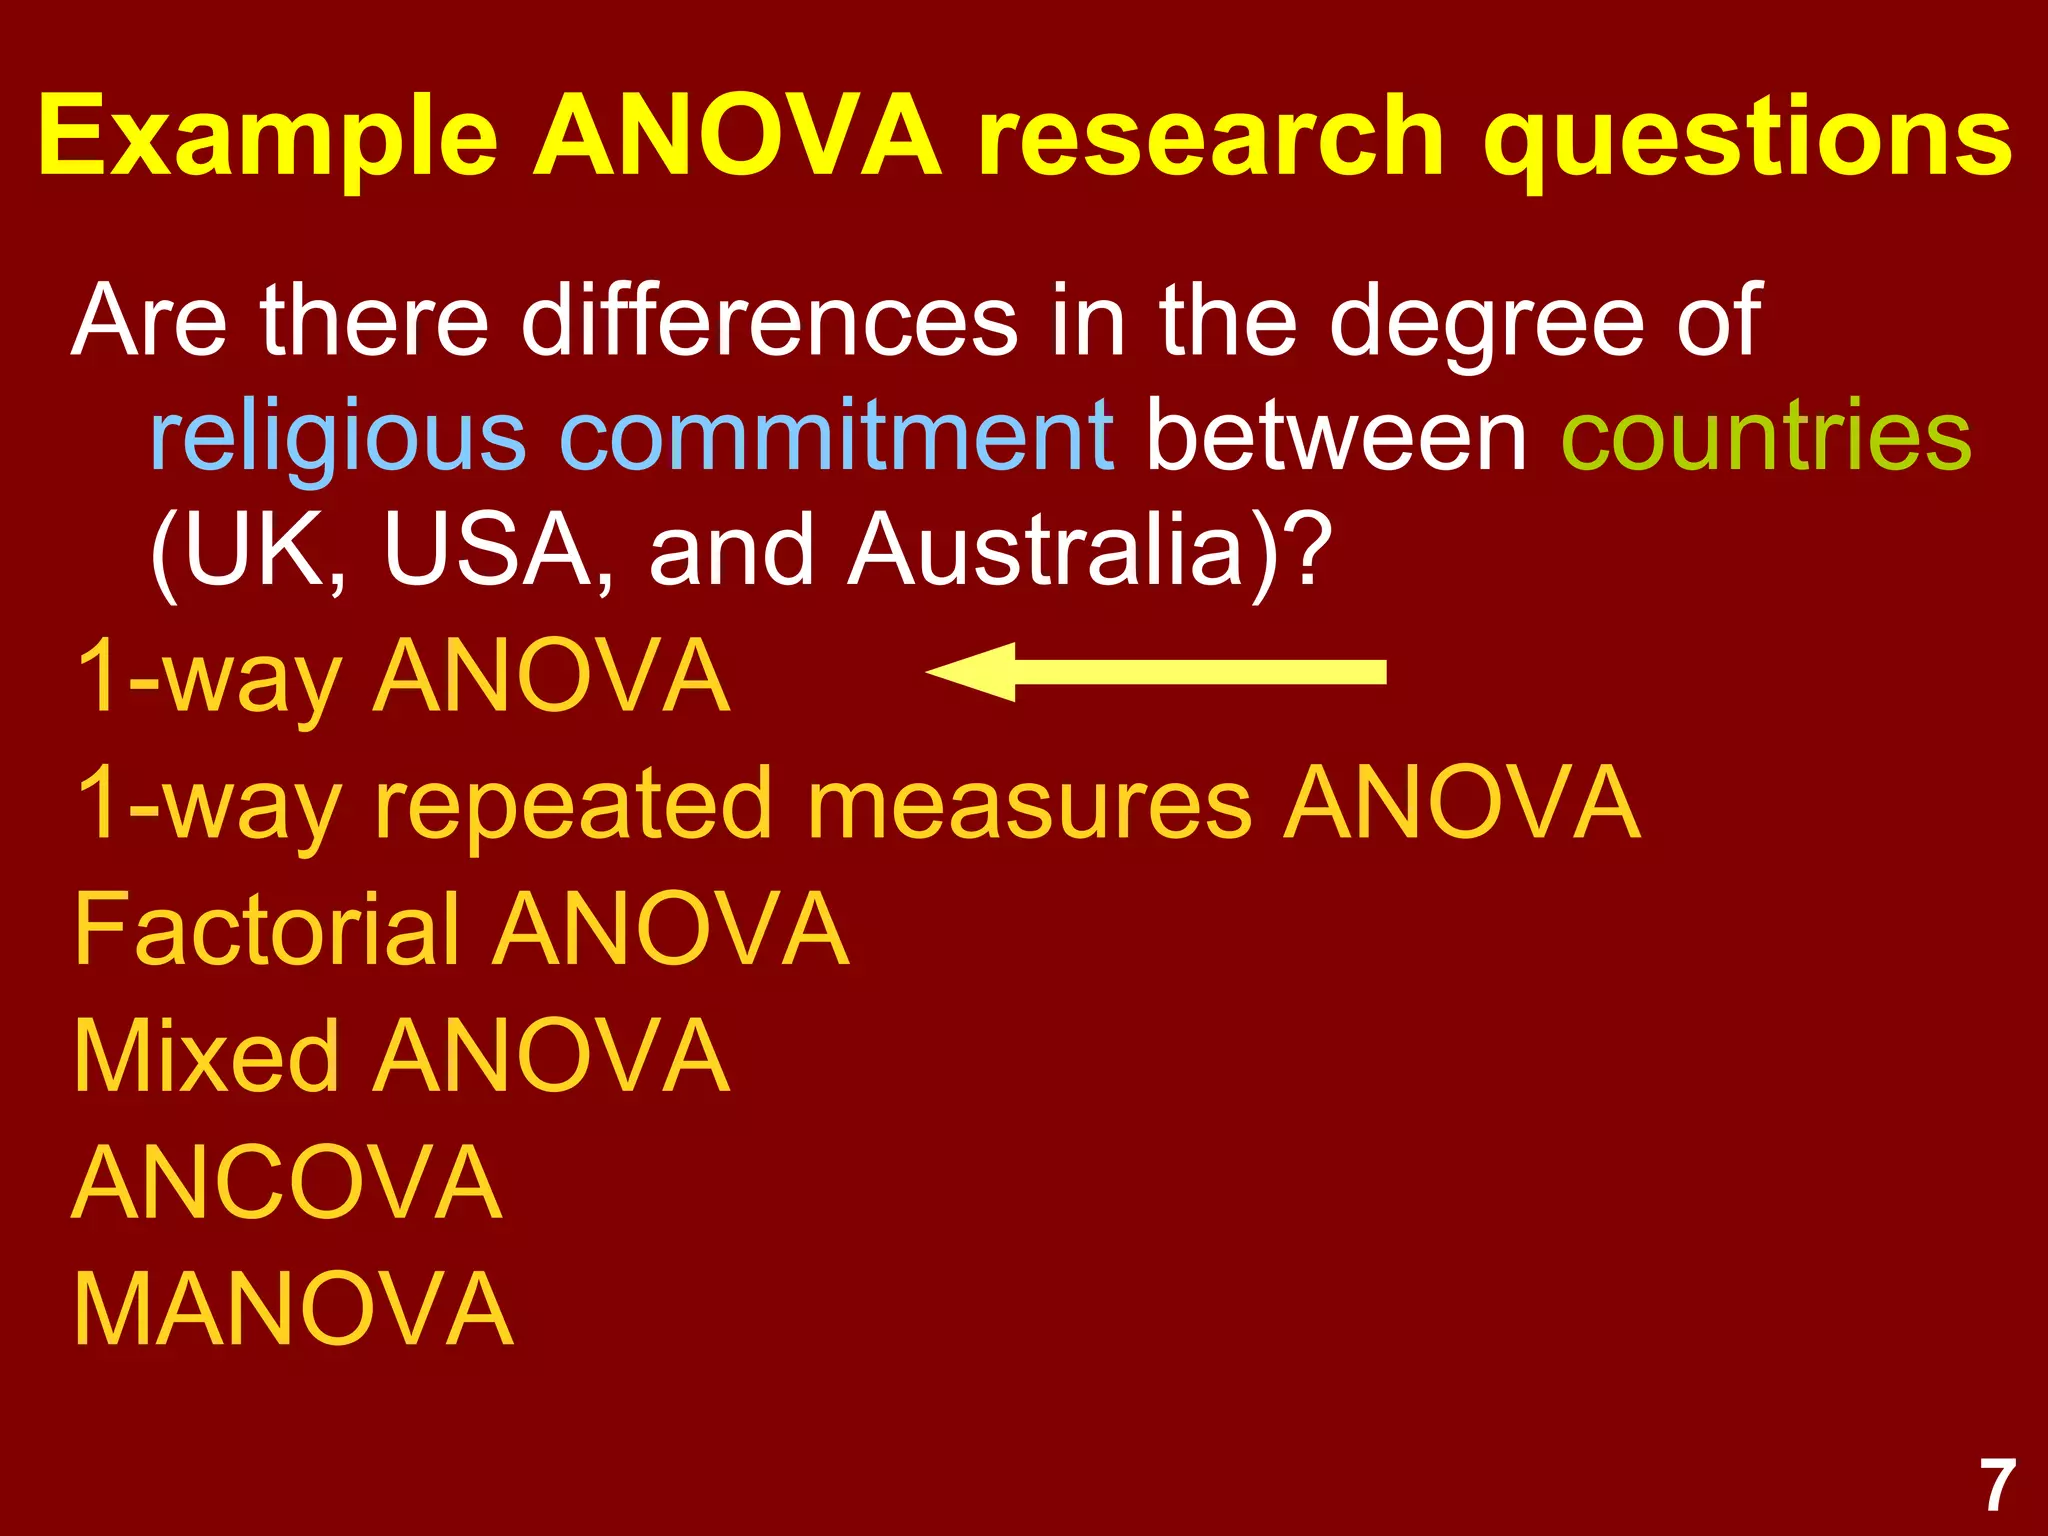
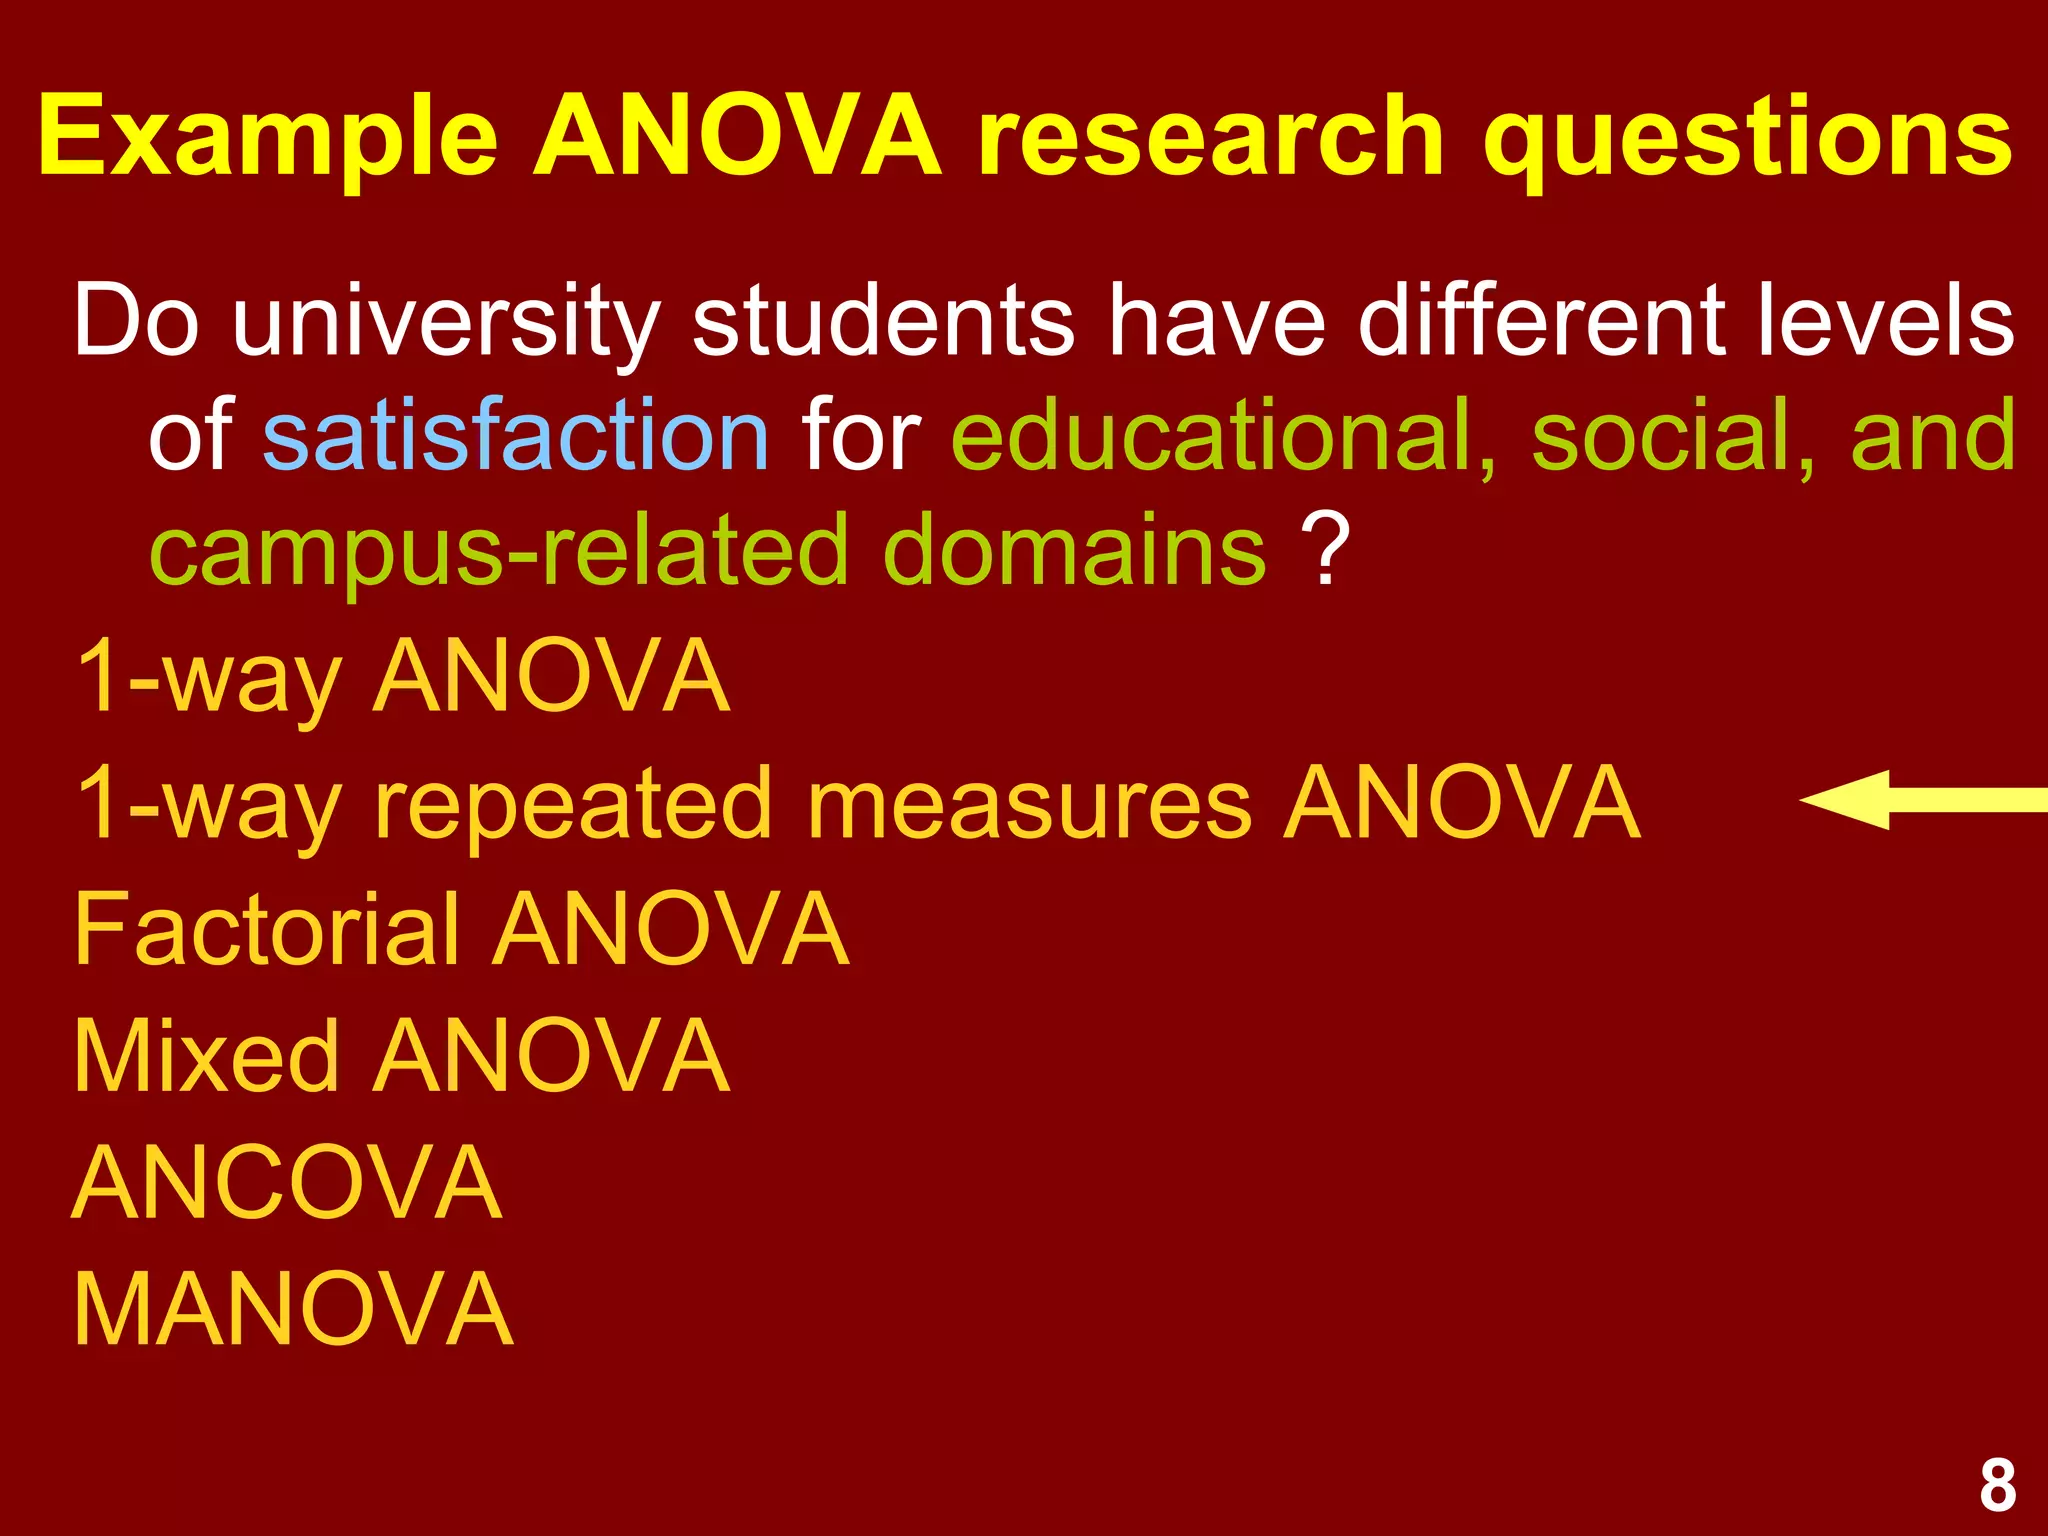
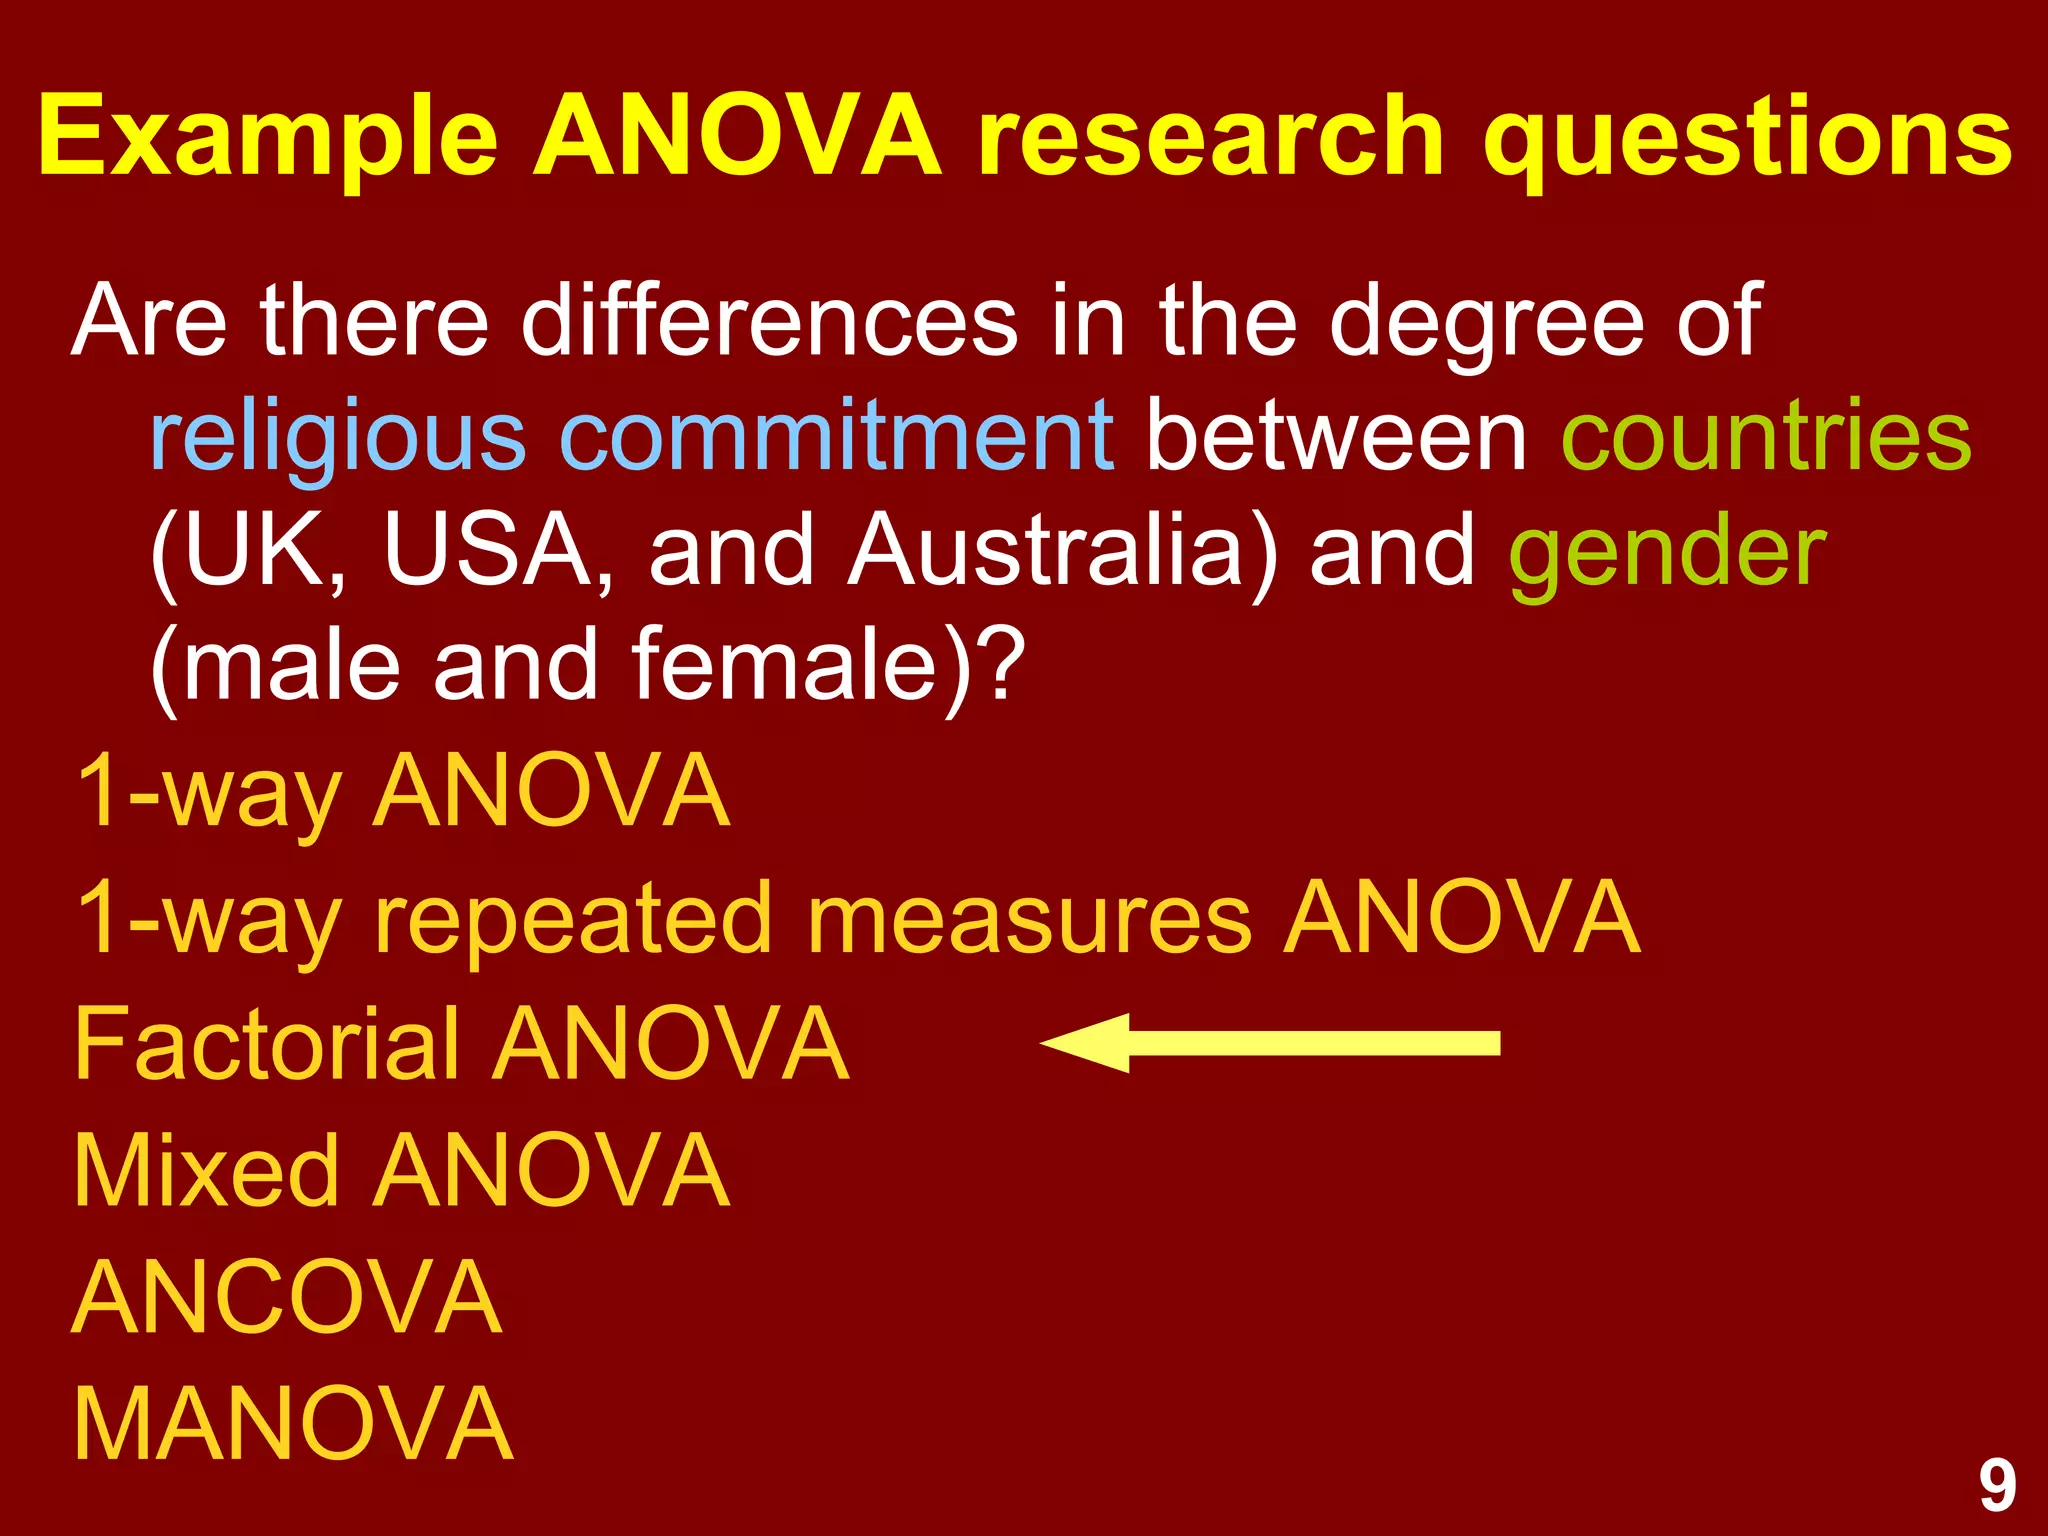
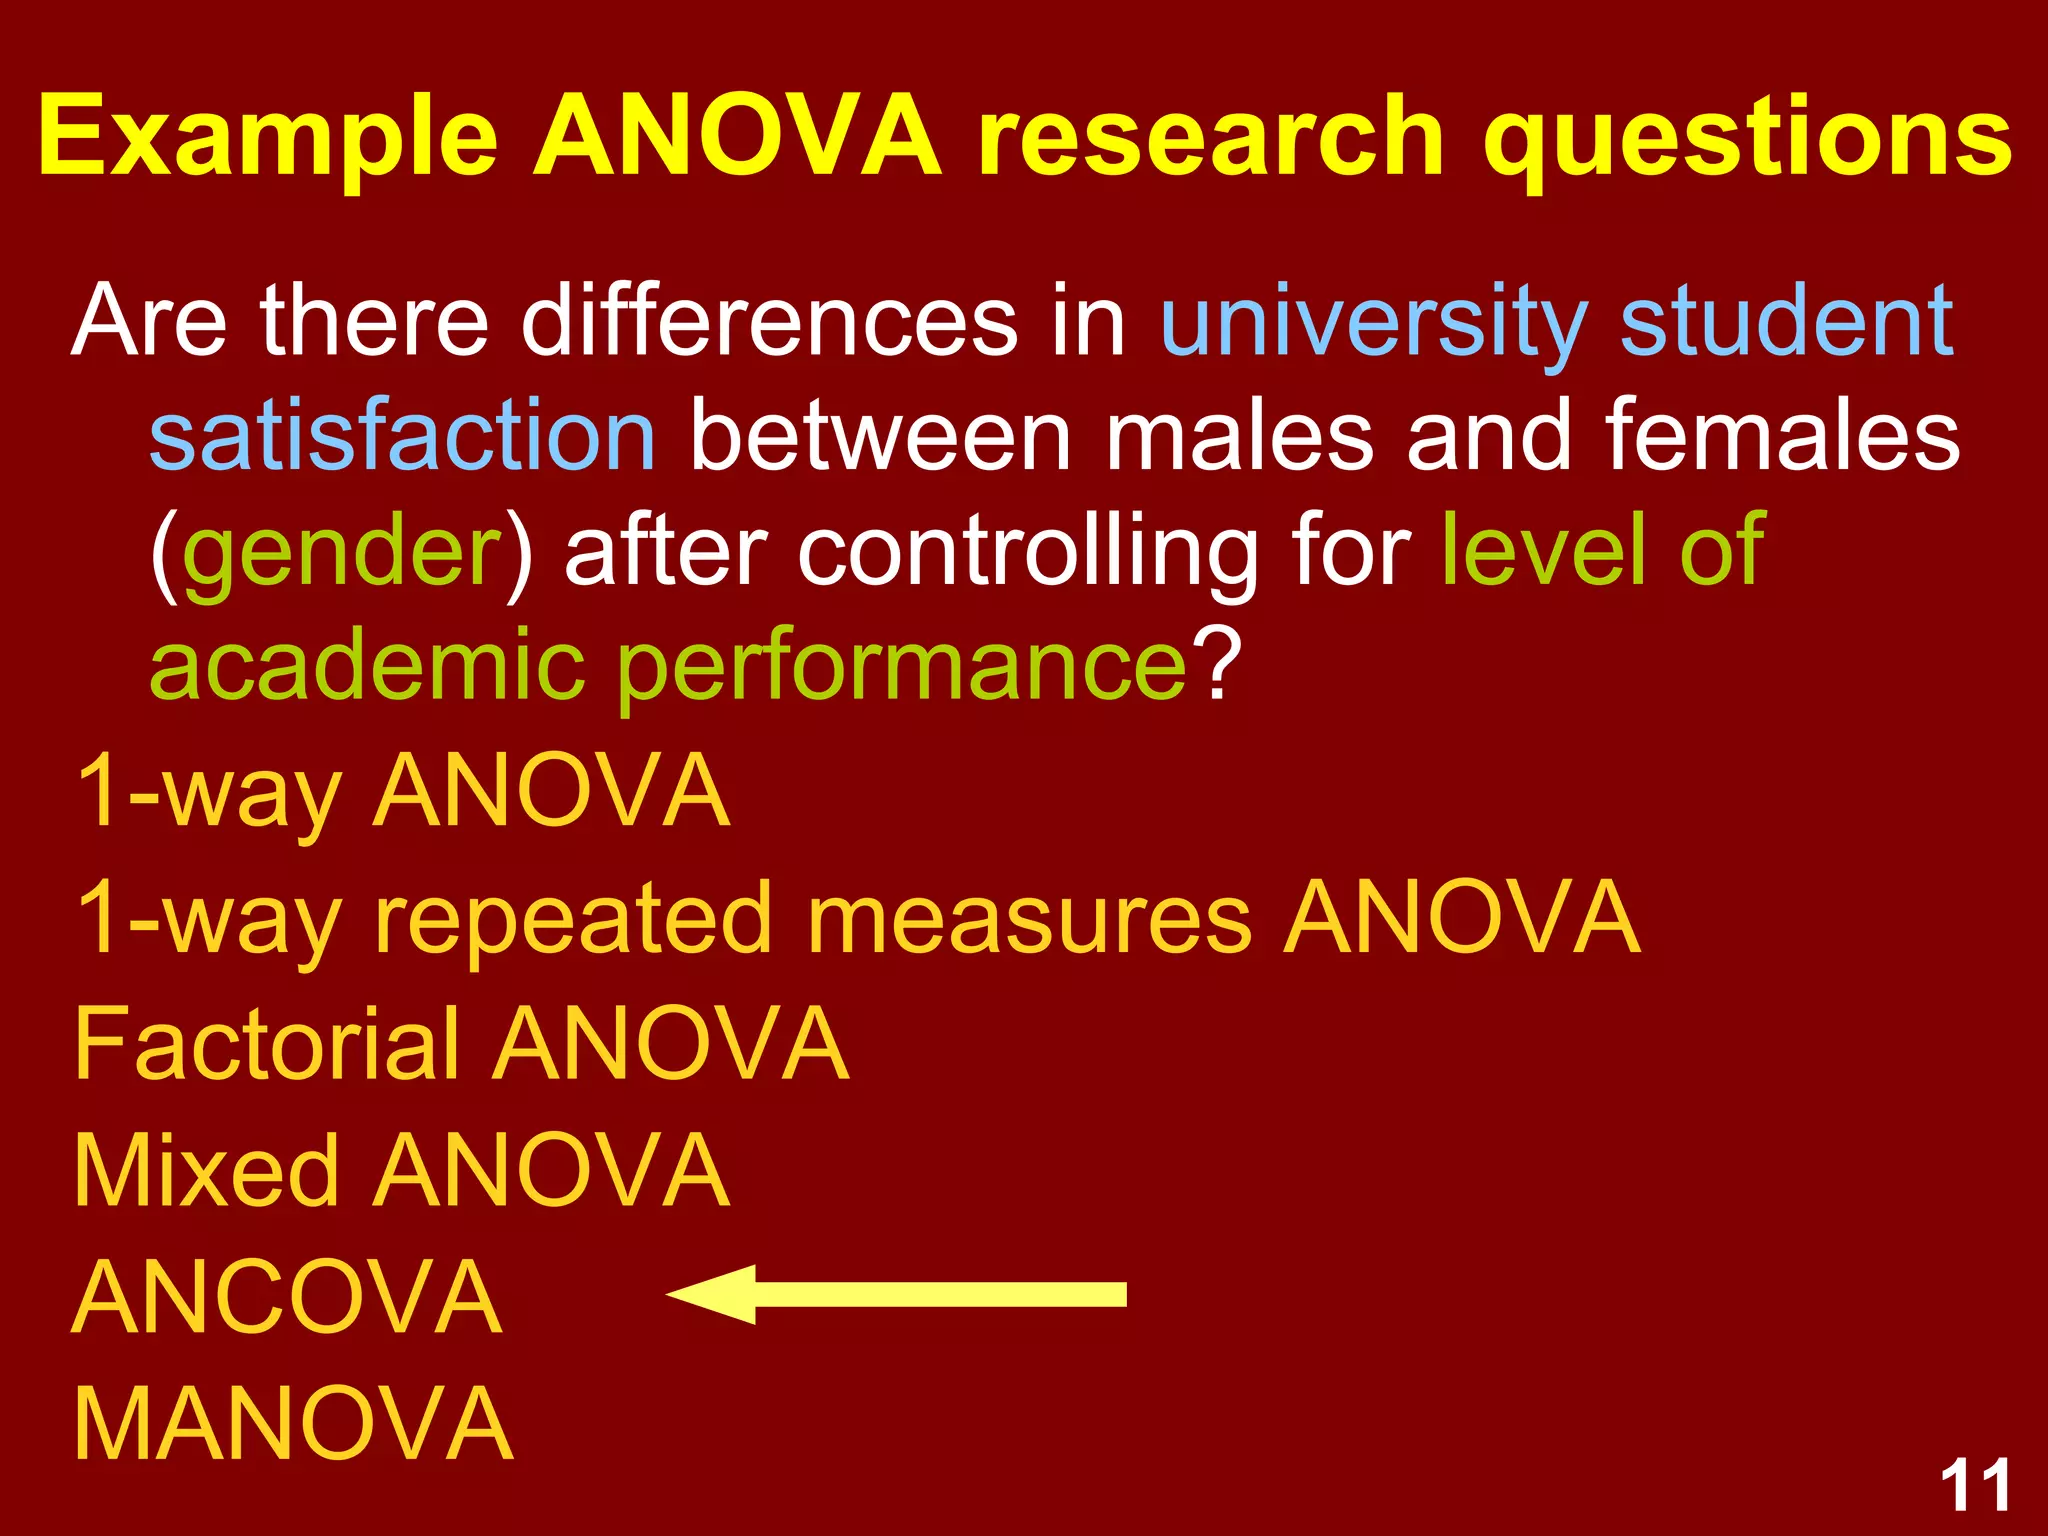
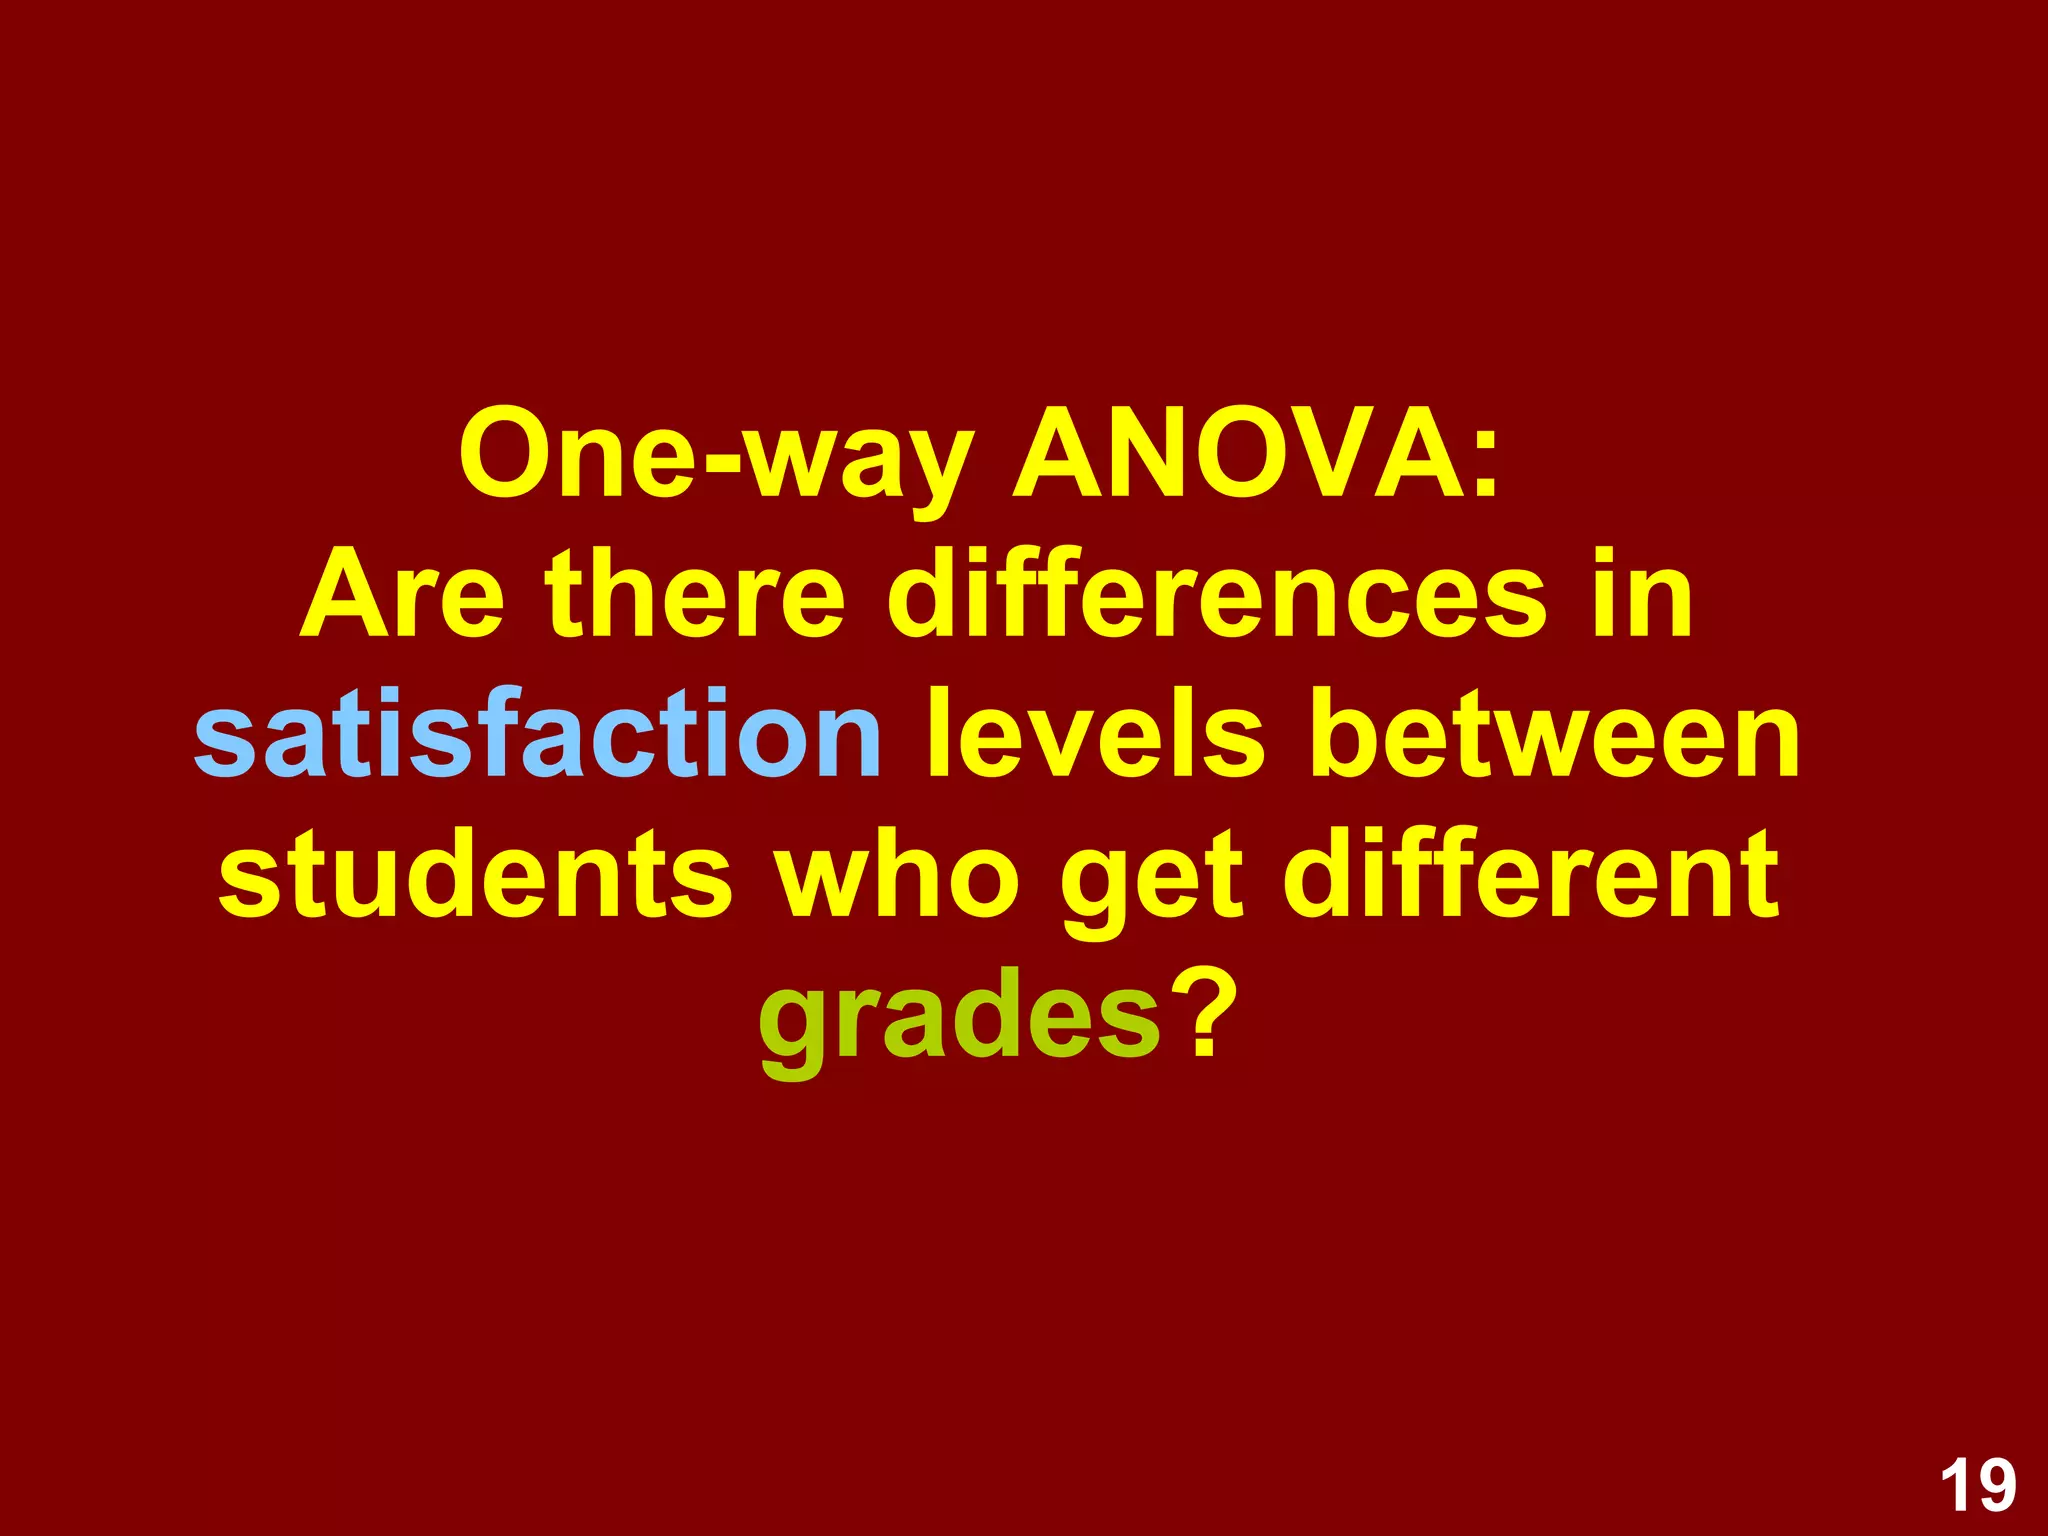
Examples of research questions suitable for ANOVA across different contexts; explores comparison of groups based on various factors.
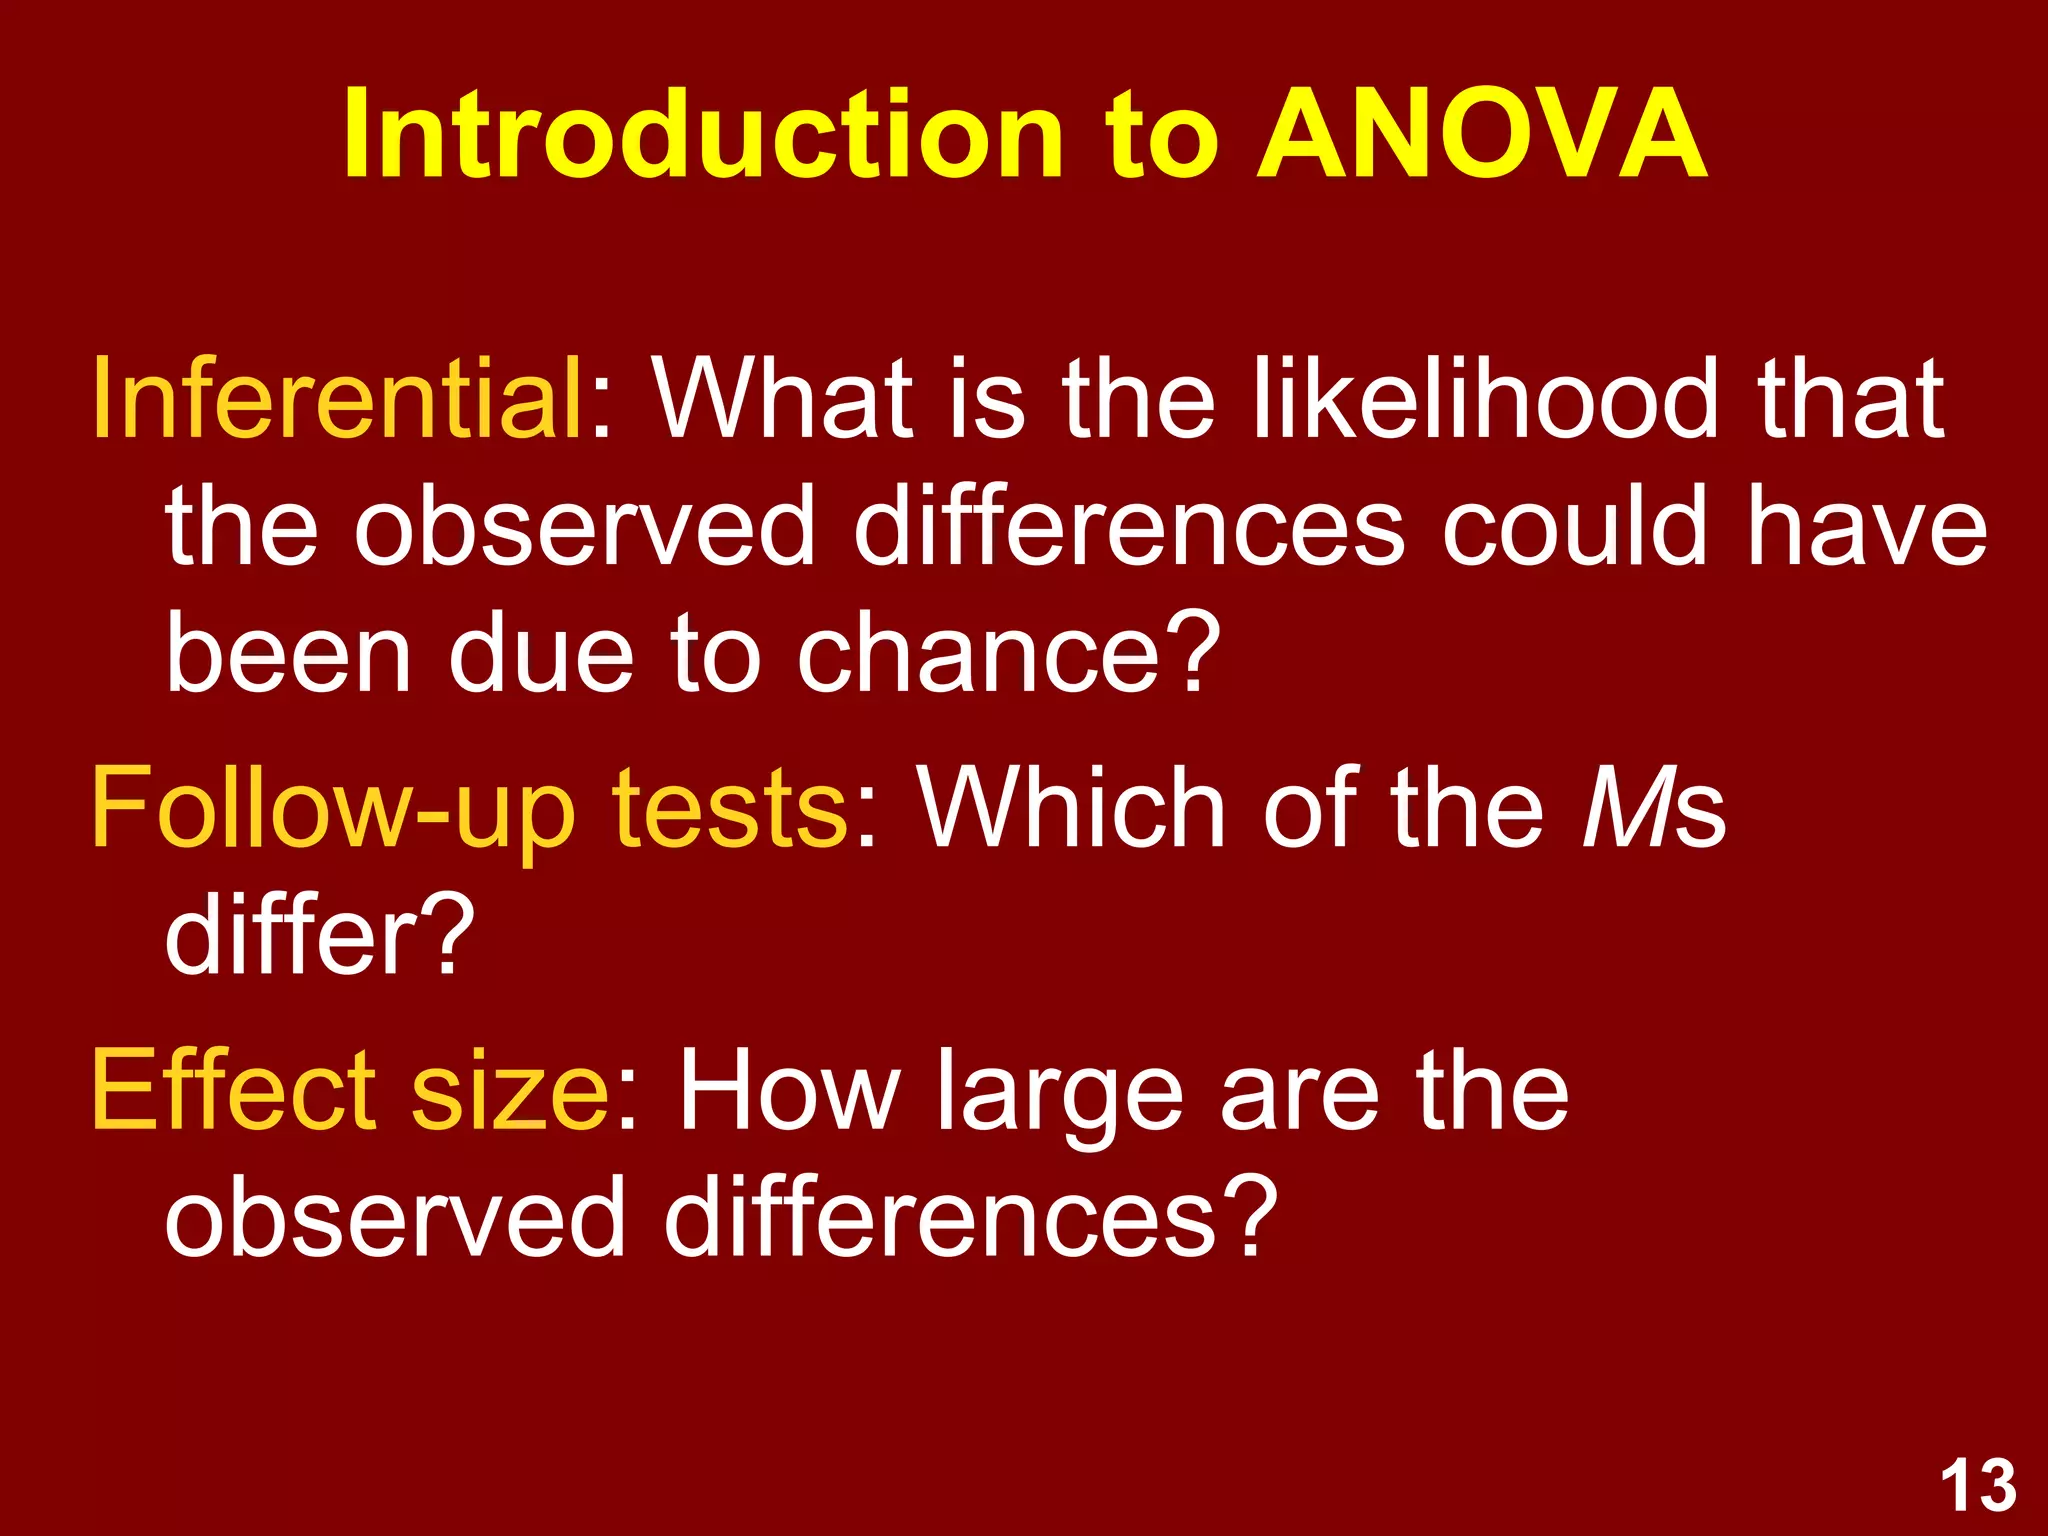
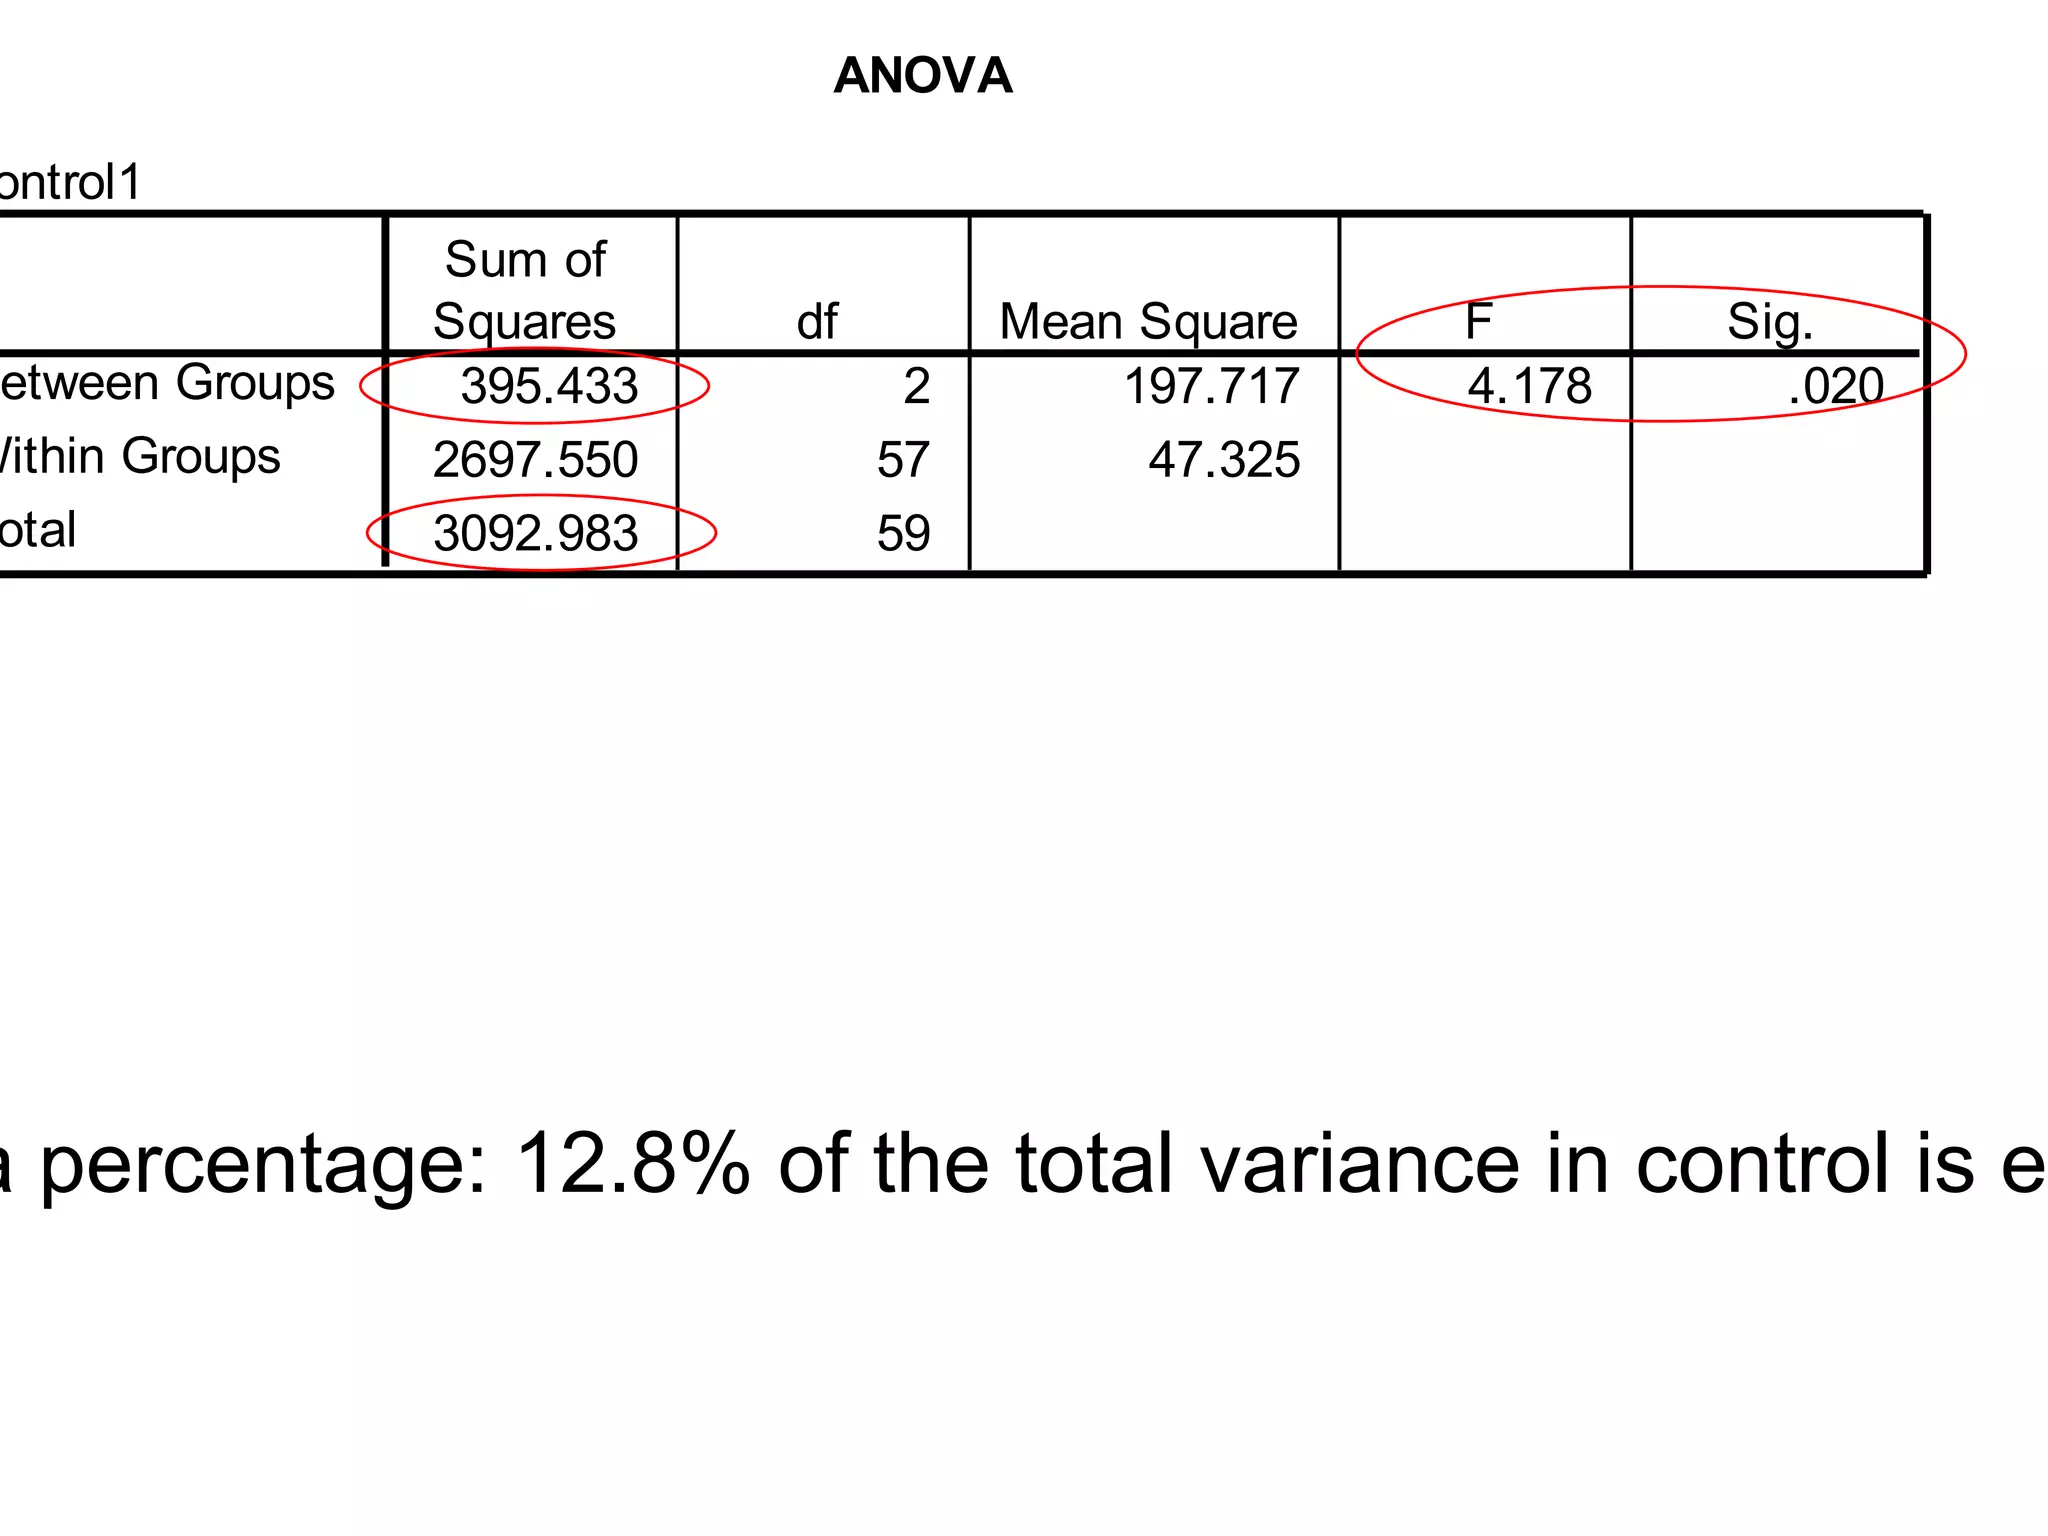
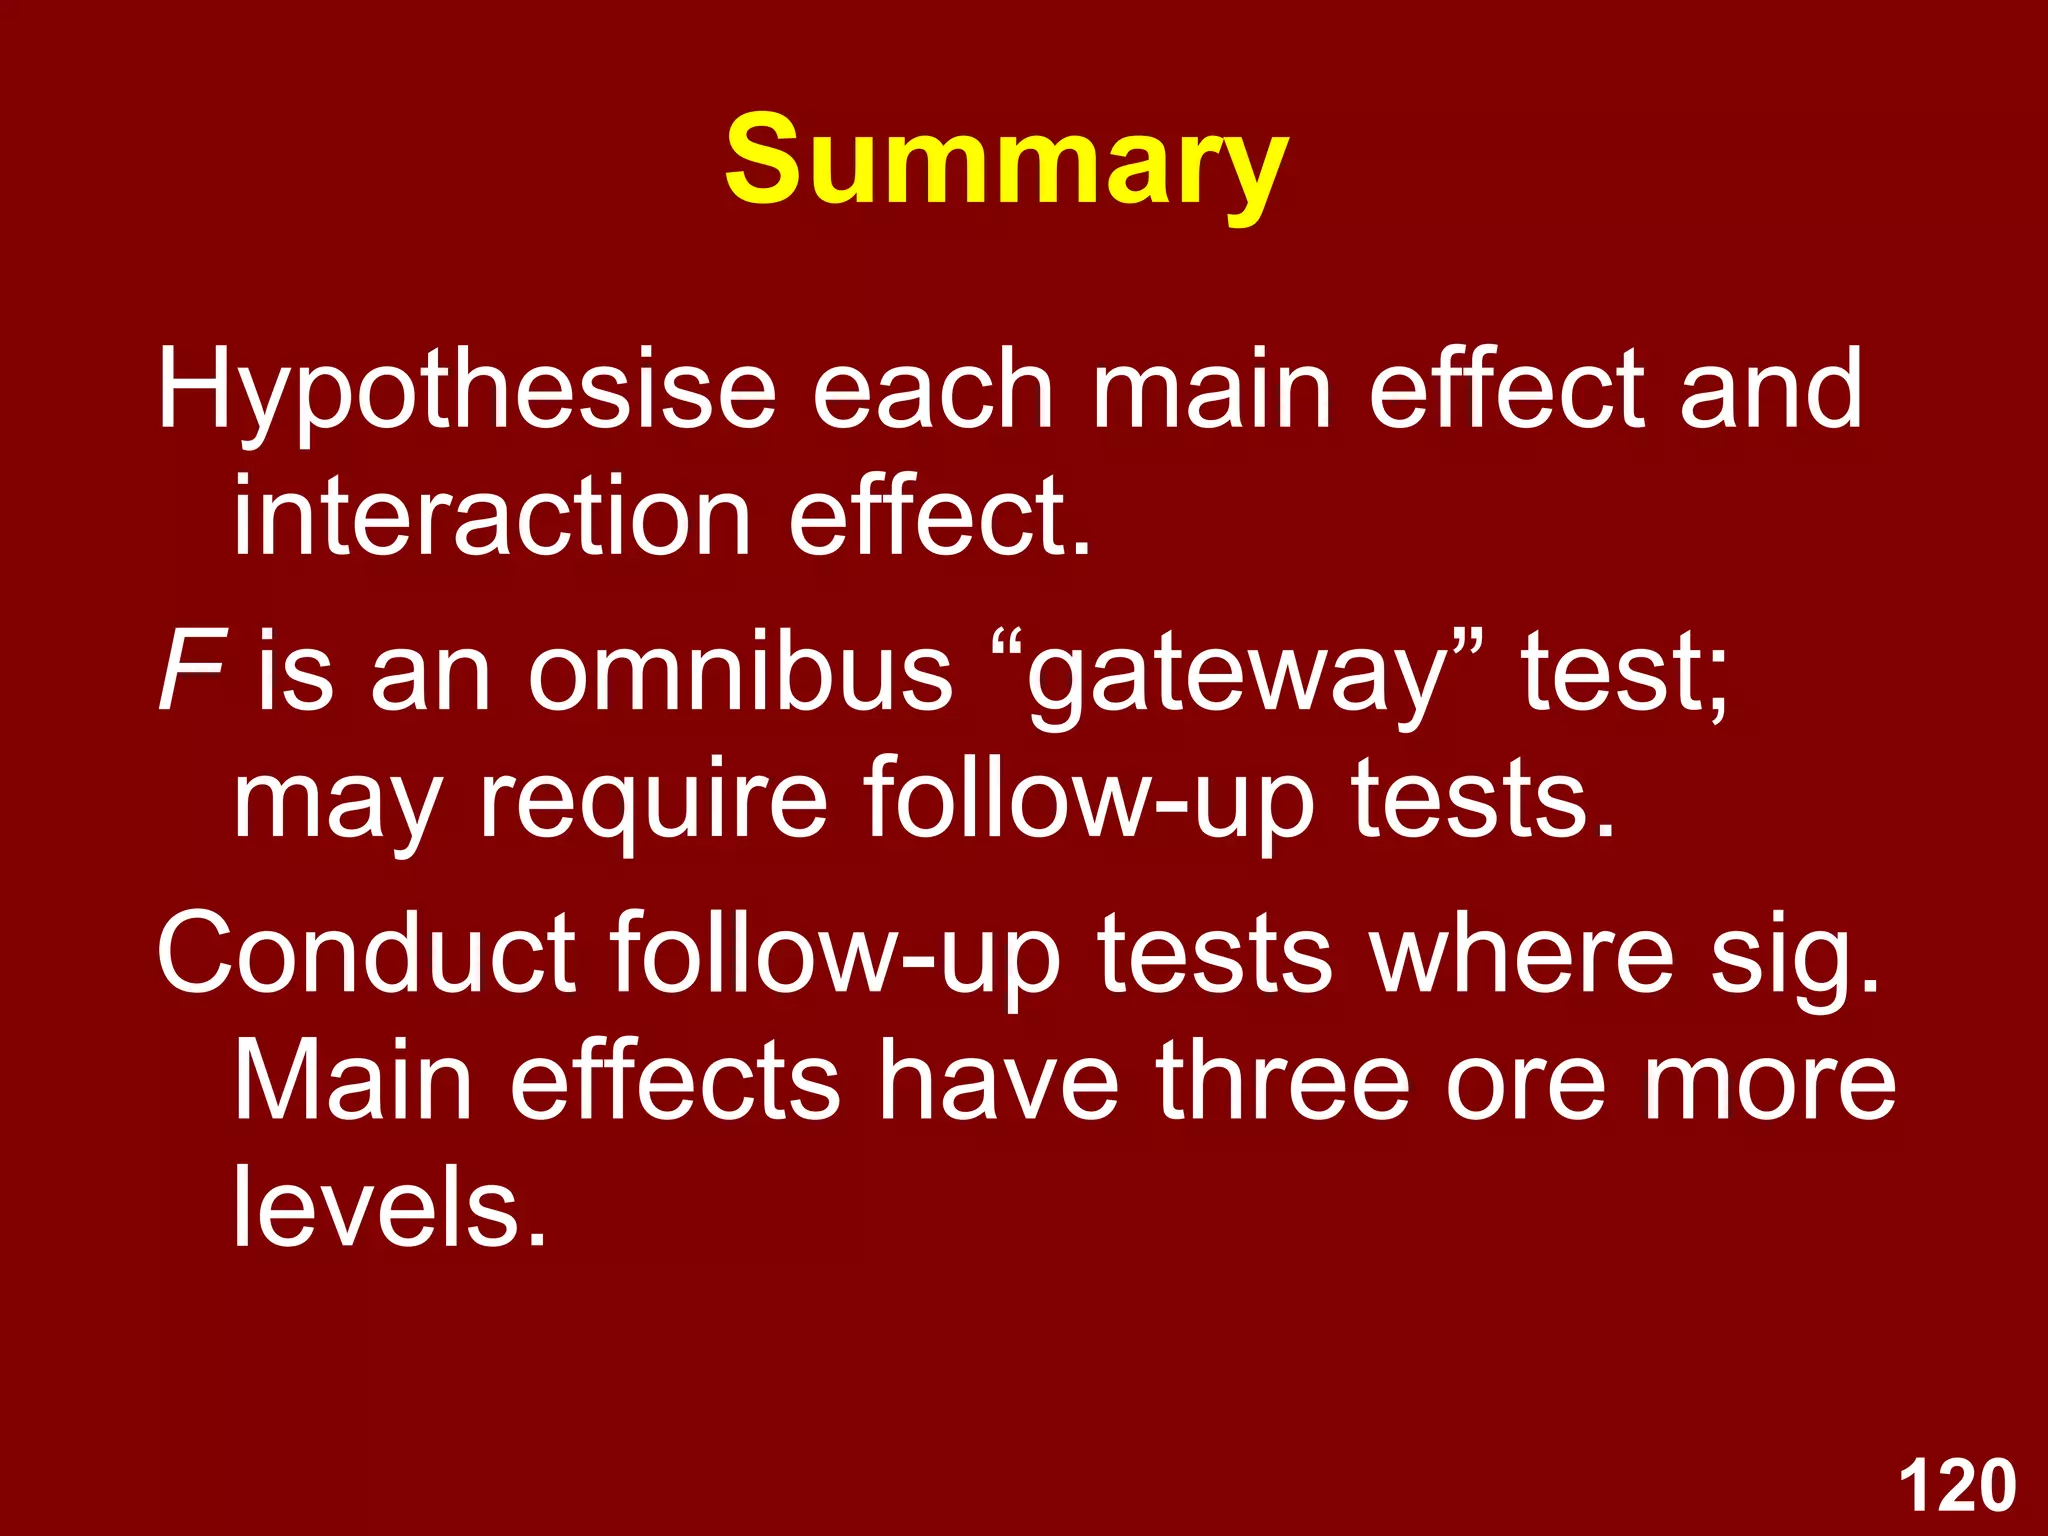
Description of F-test in ANOVA; explains variance partitioning between groups; significance of F-test in determining differences.
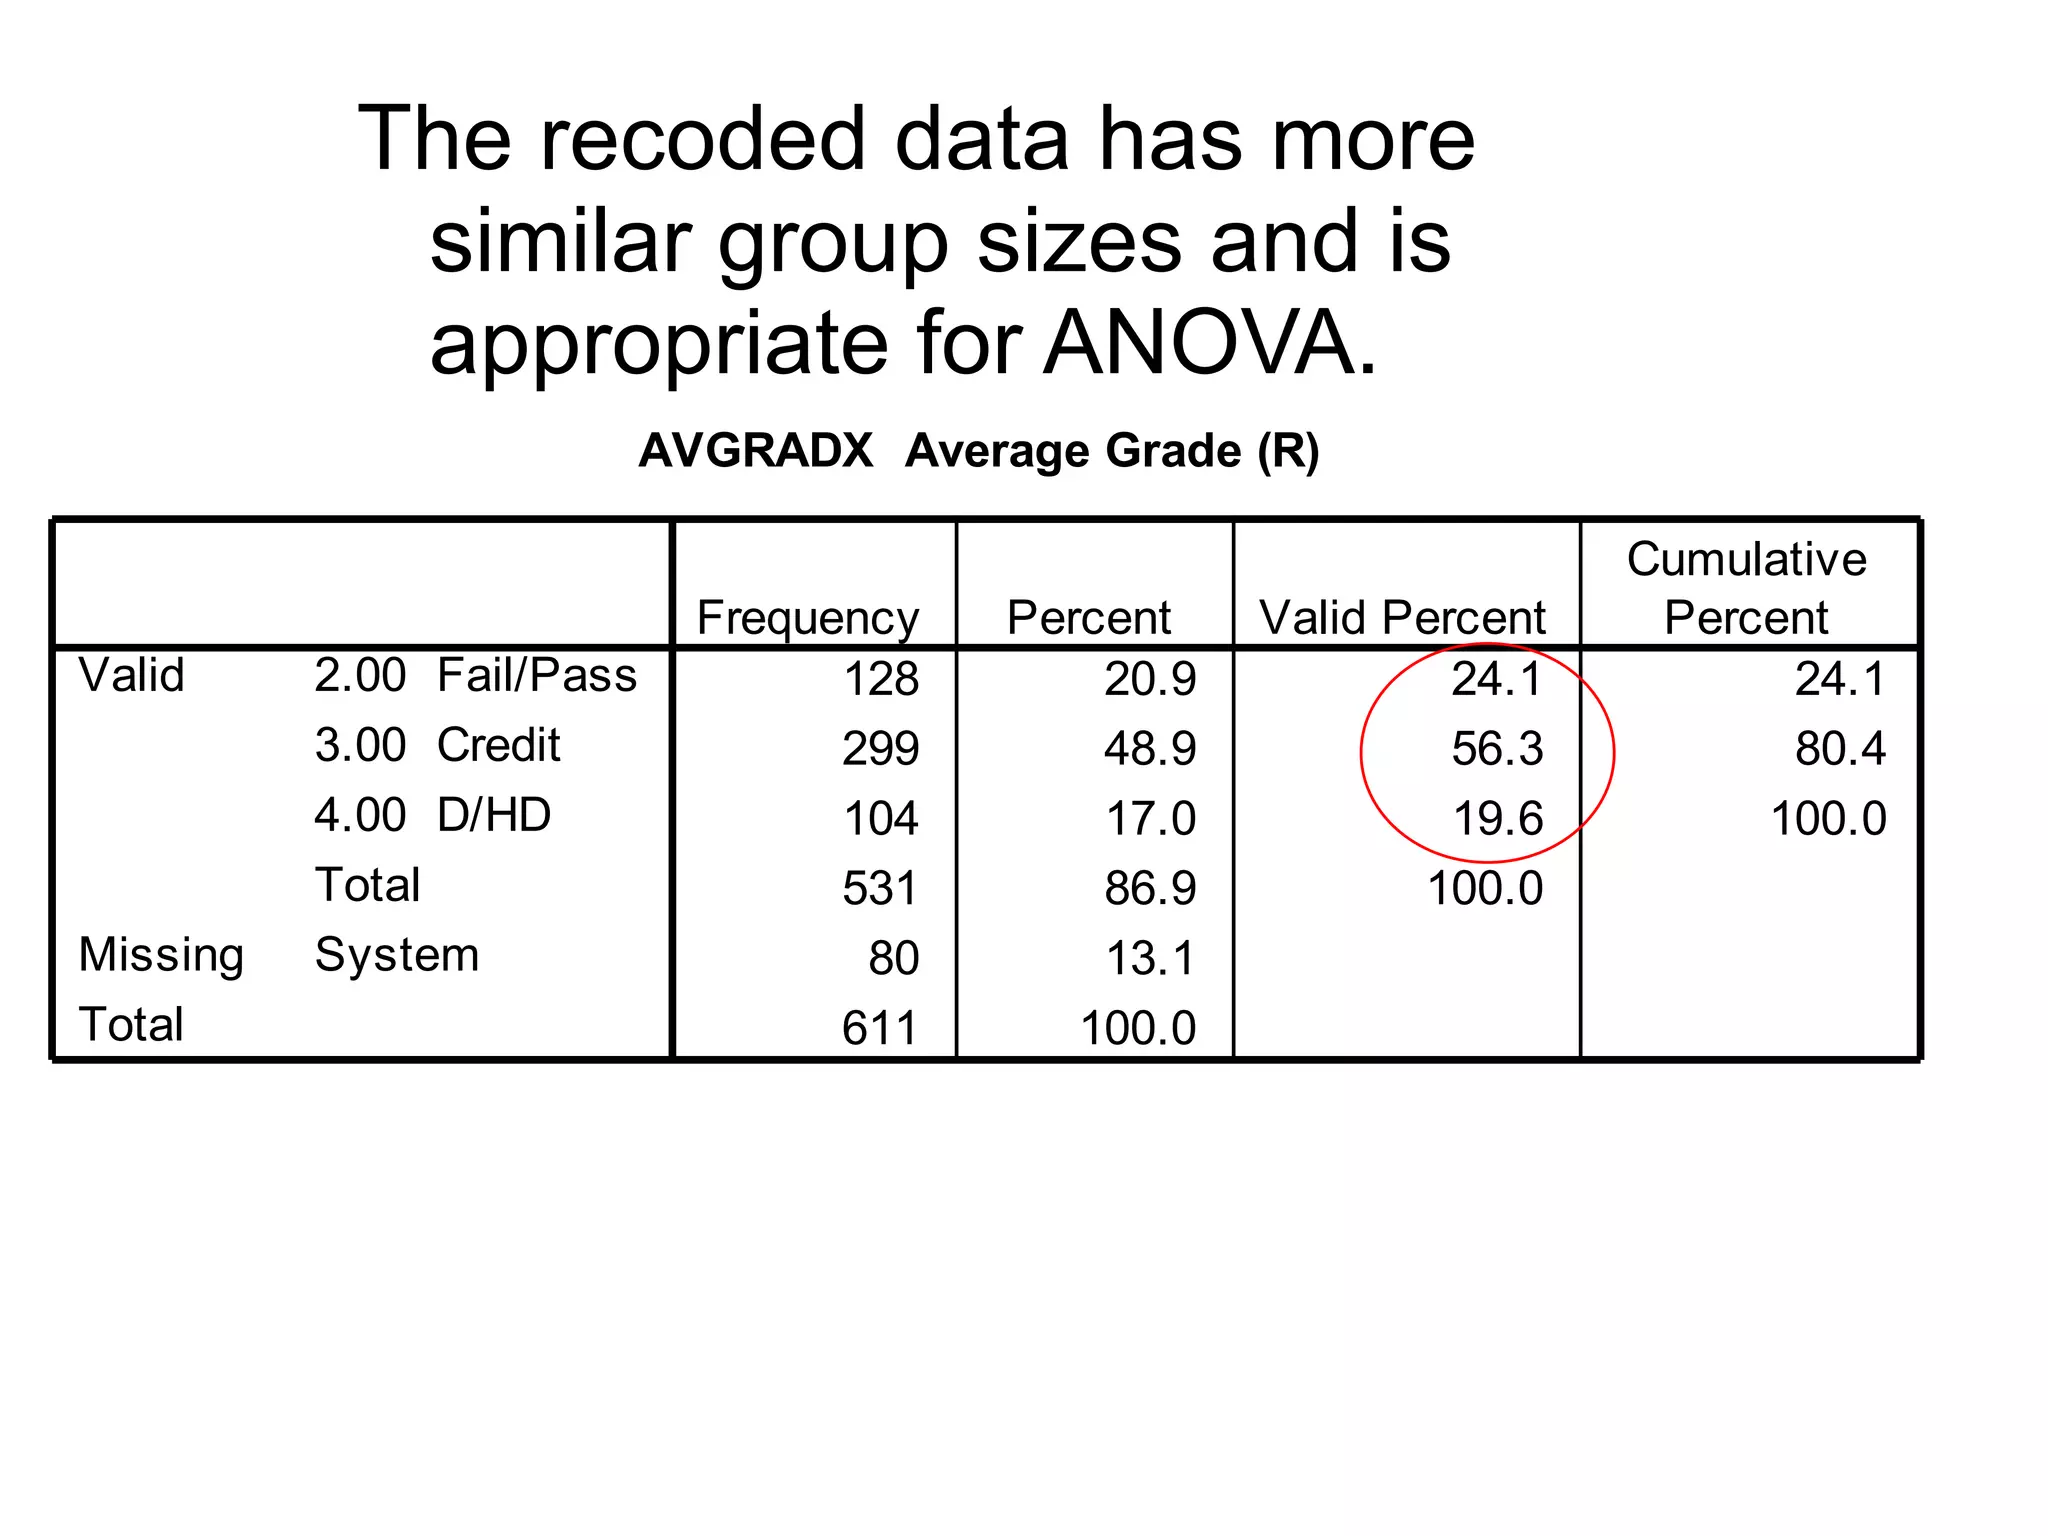
Assumptions for one-way ANOVA; examples of group comparisons; discussions on recoding data for variance homogeneity.
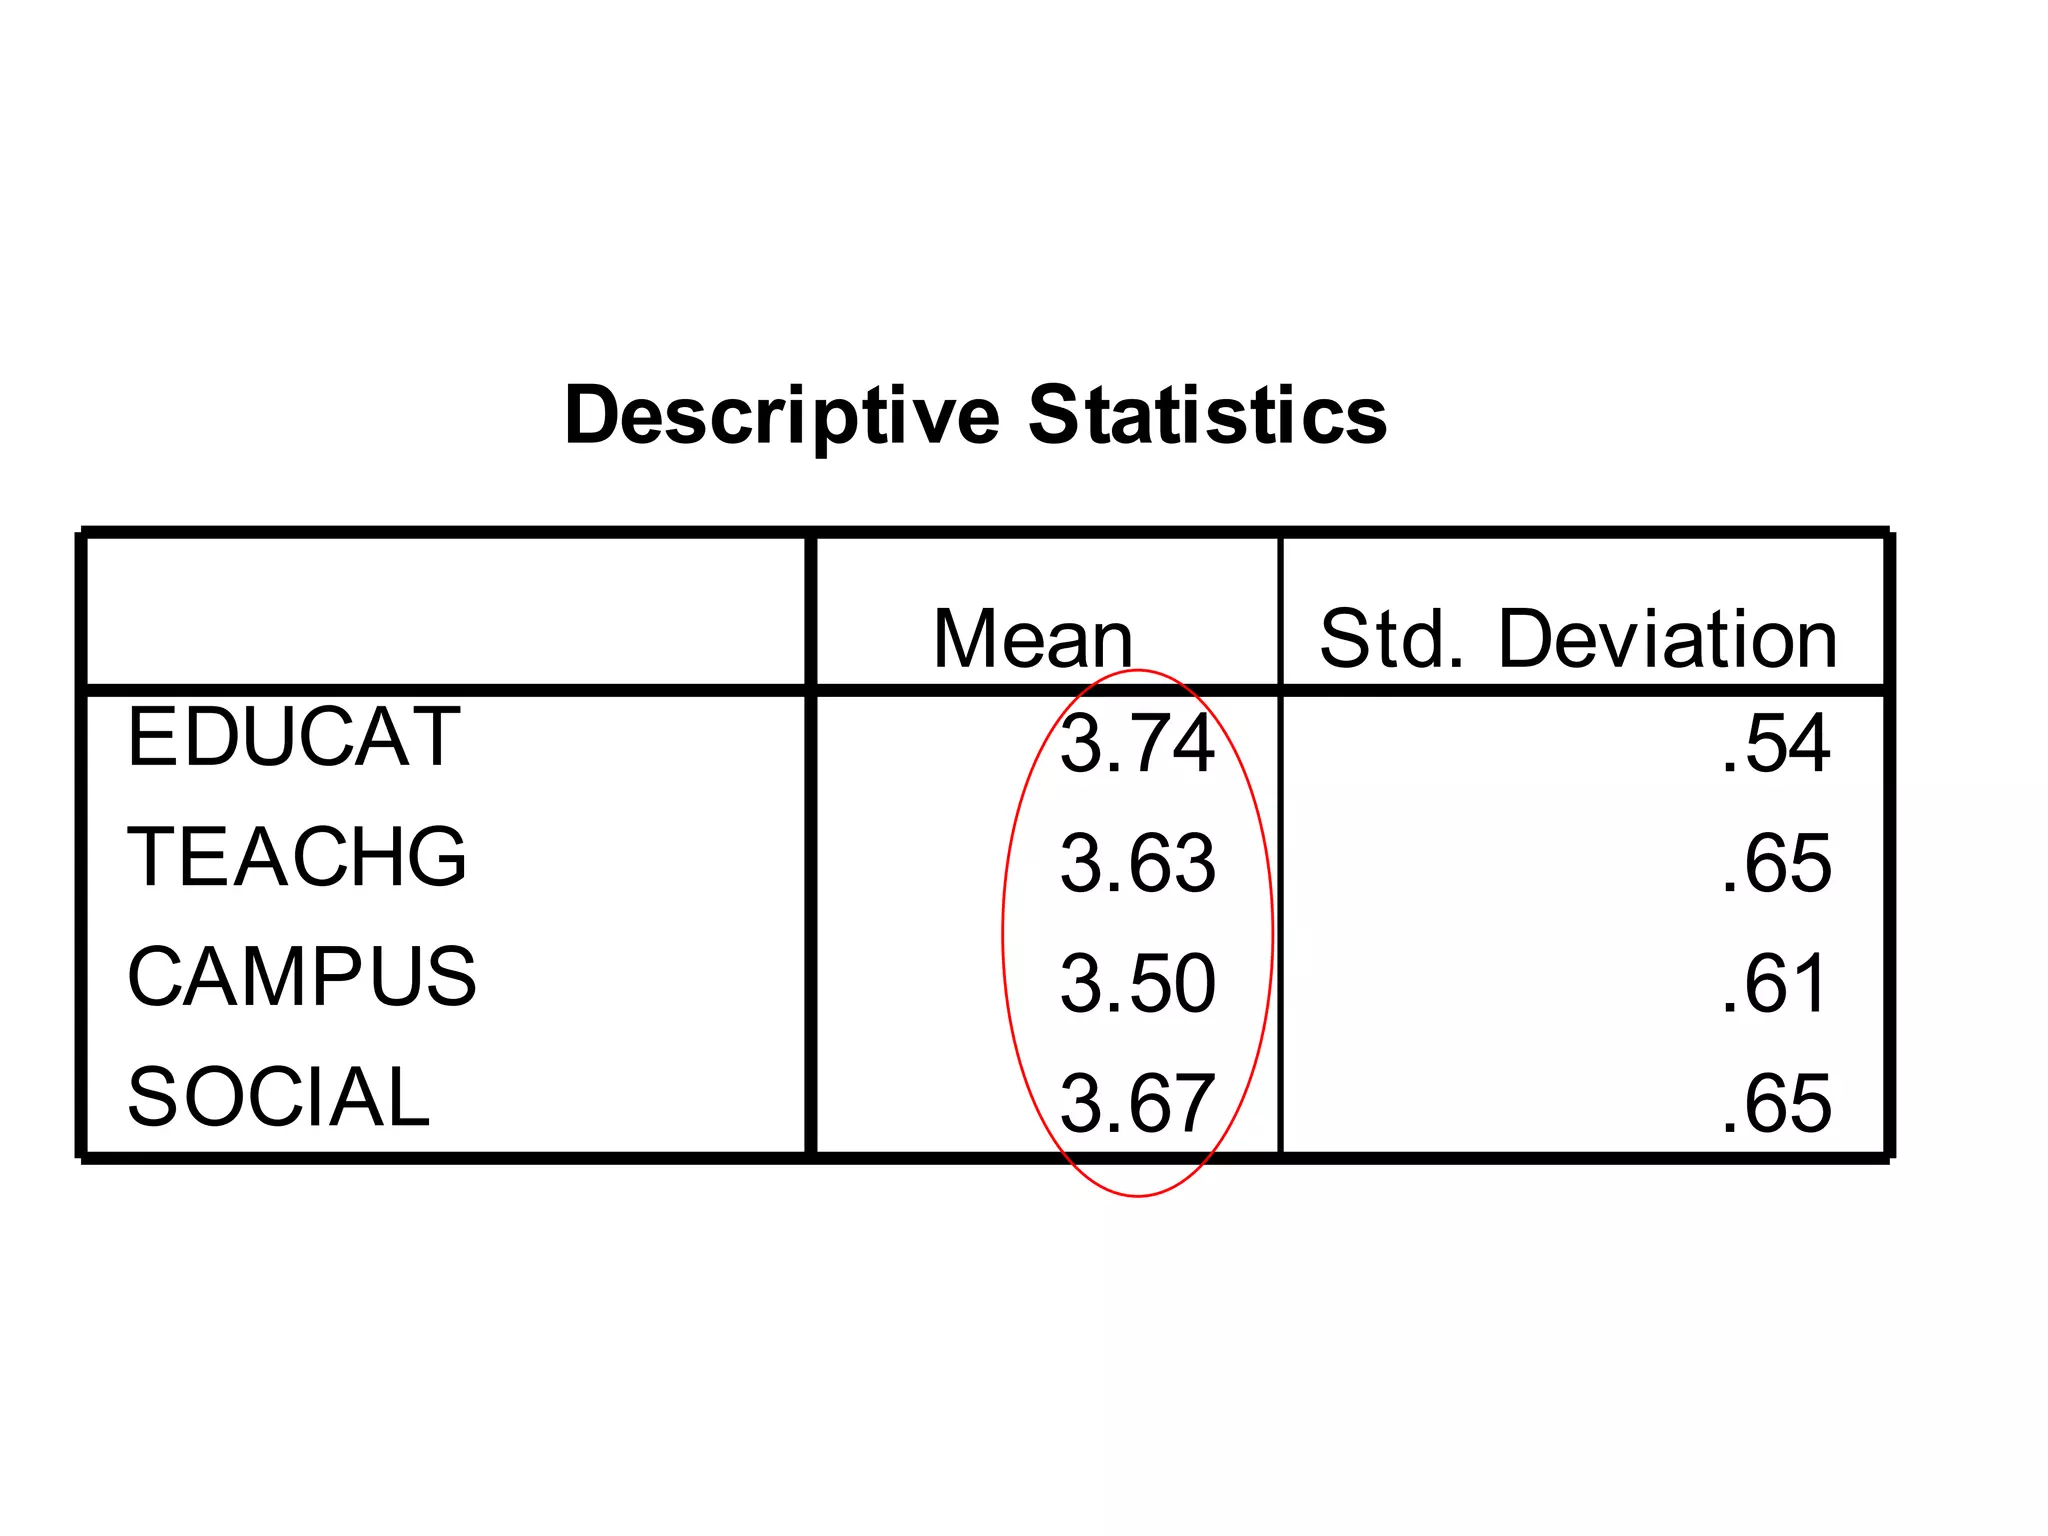
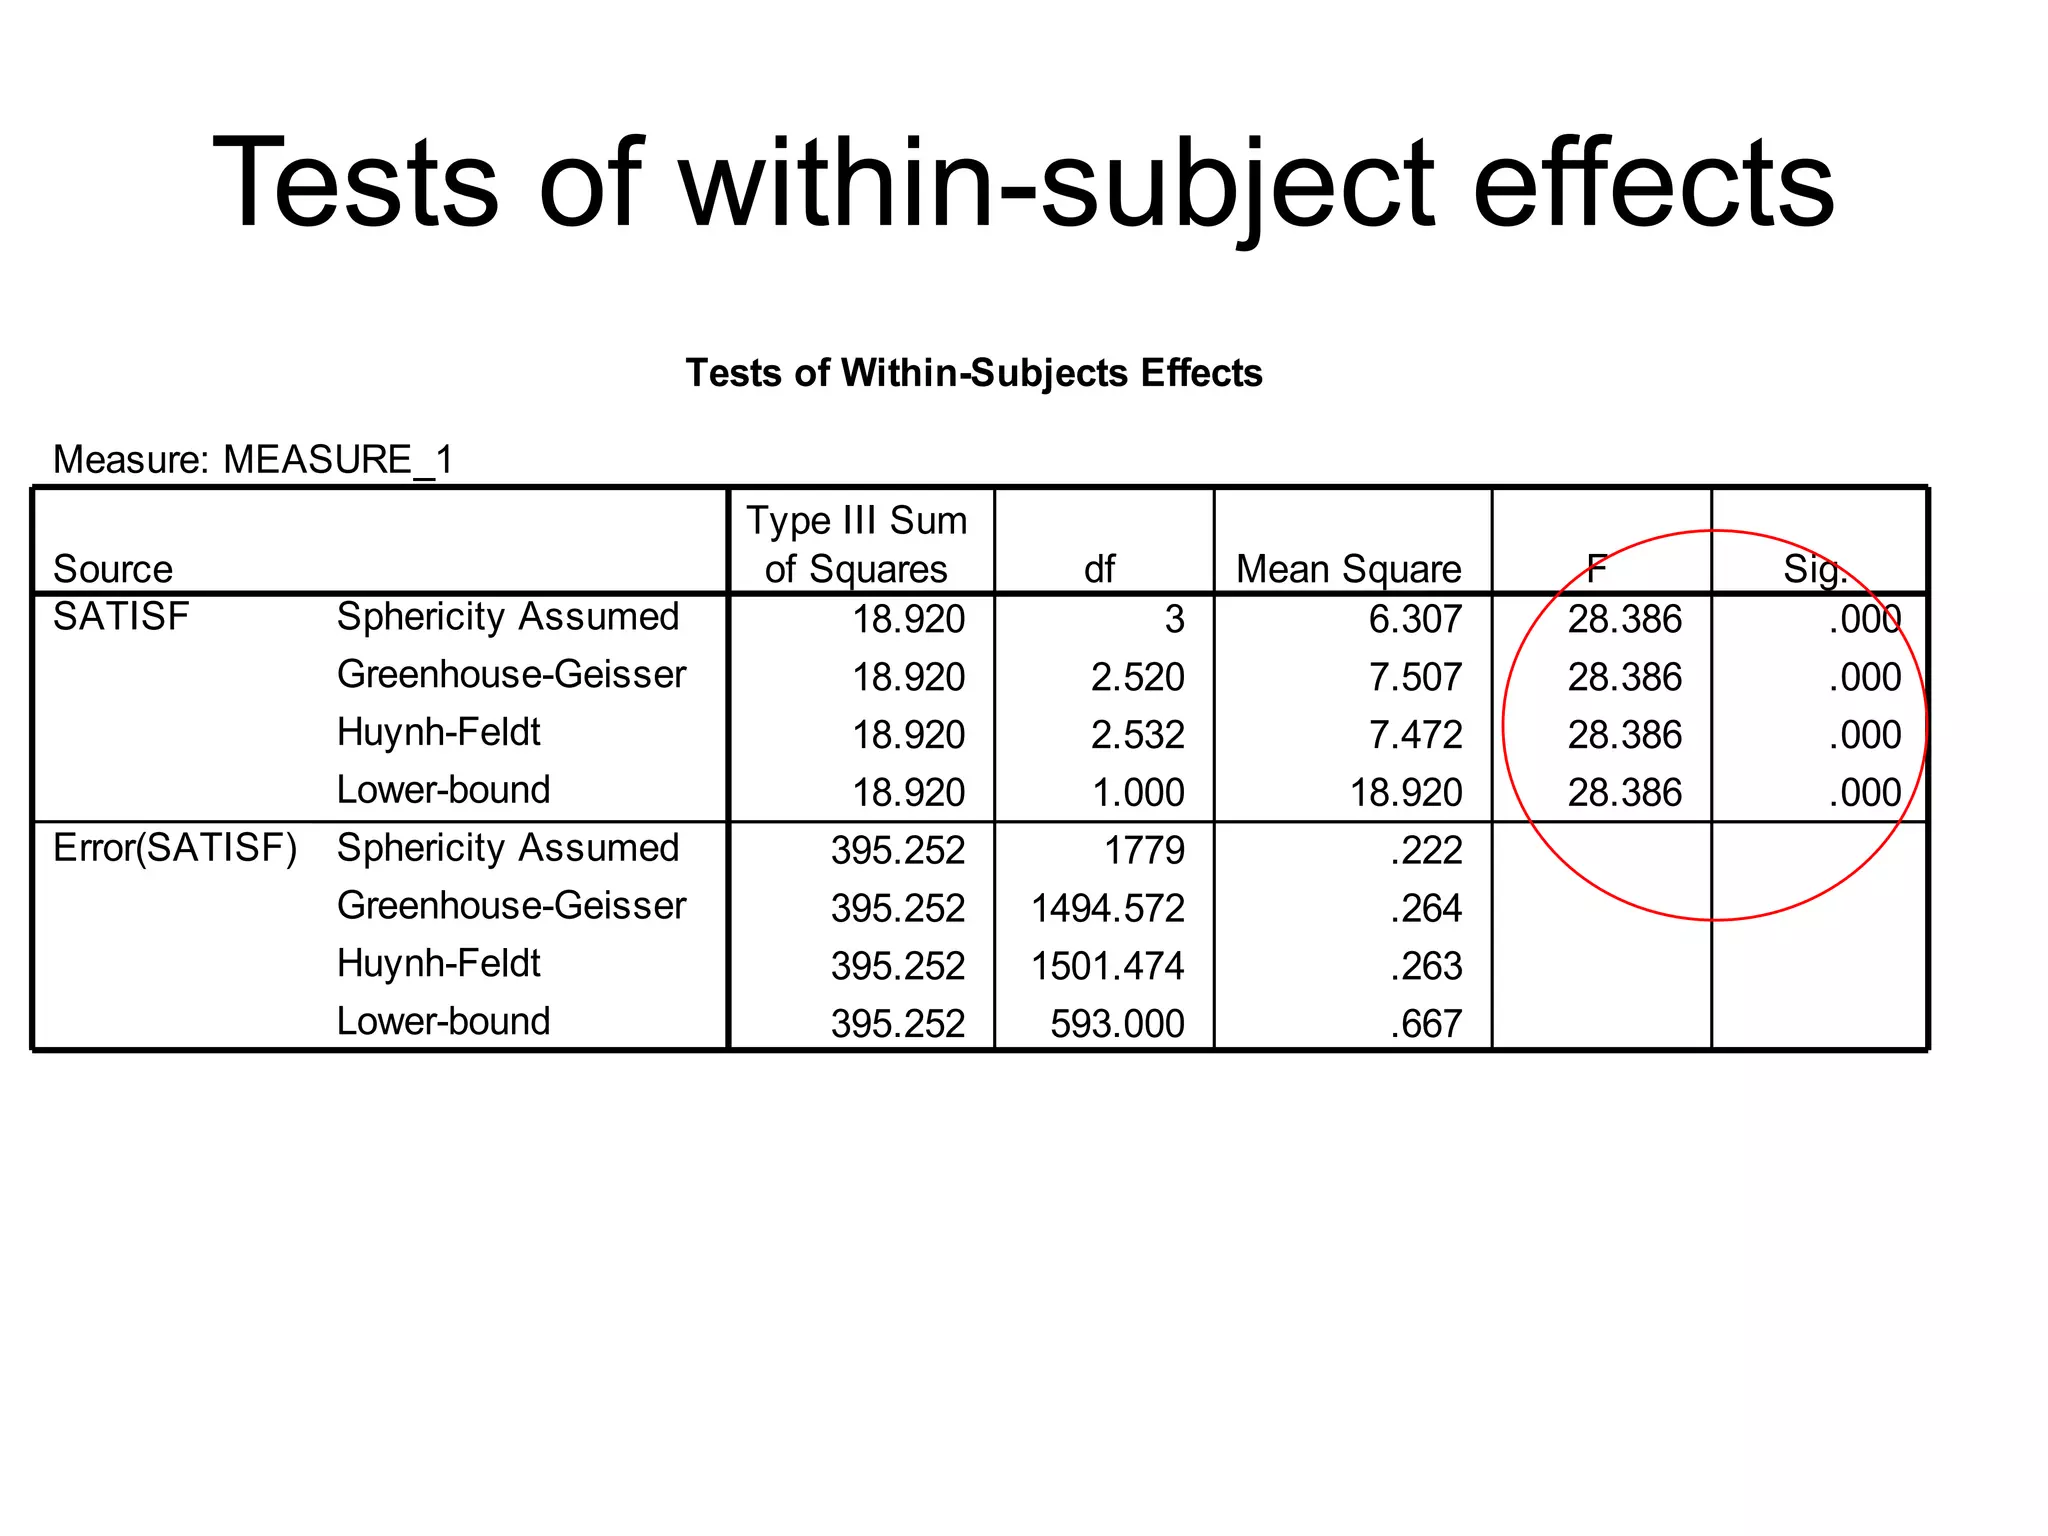
Evaluation of SDs, Levene's test for homogeneity, and significant effects in satisfaction related to grades and locus of control.
Details on performing post-hoc tests after significant results; describes methods for controlling Type I error.
Assumptions for repeated measures ANOVA; examples of data comparisons; considerations for variability and significance.
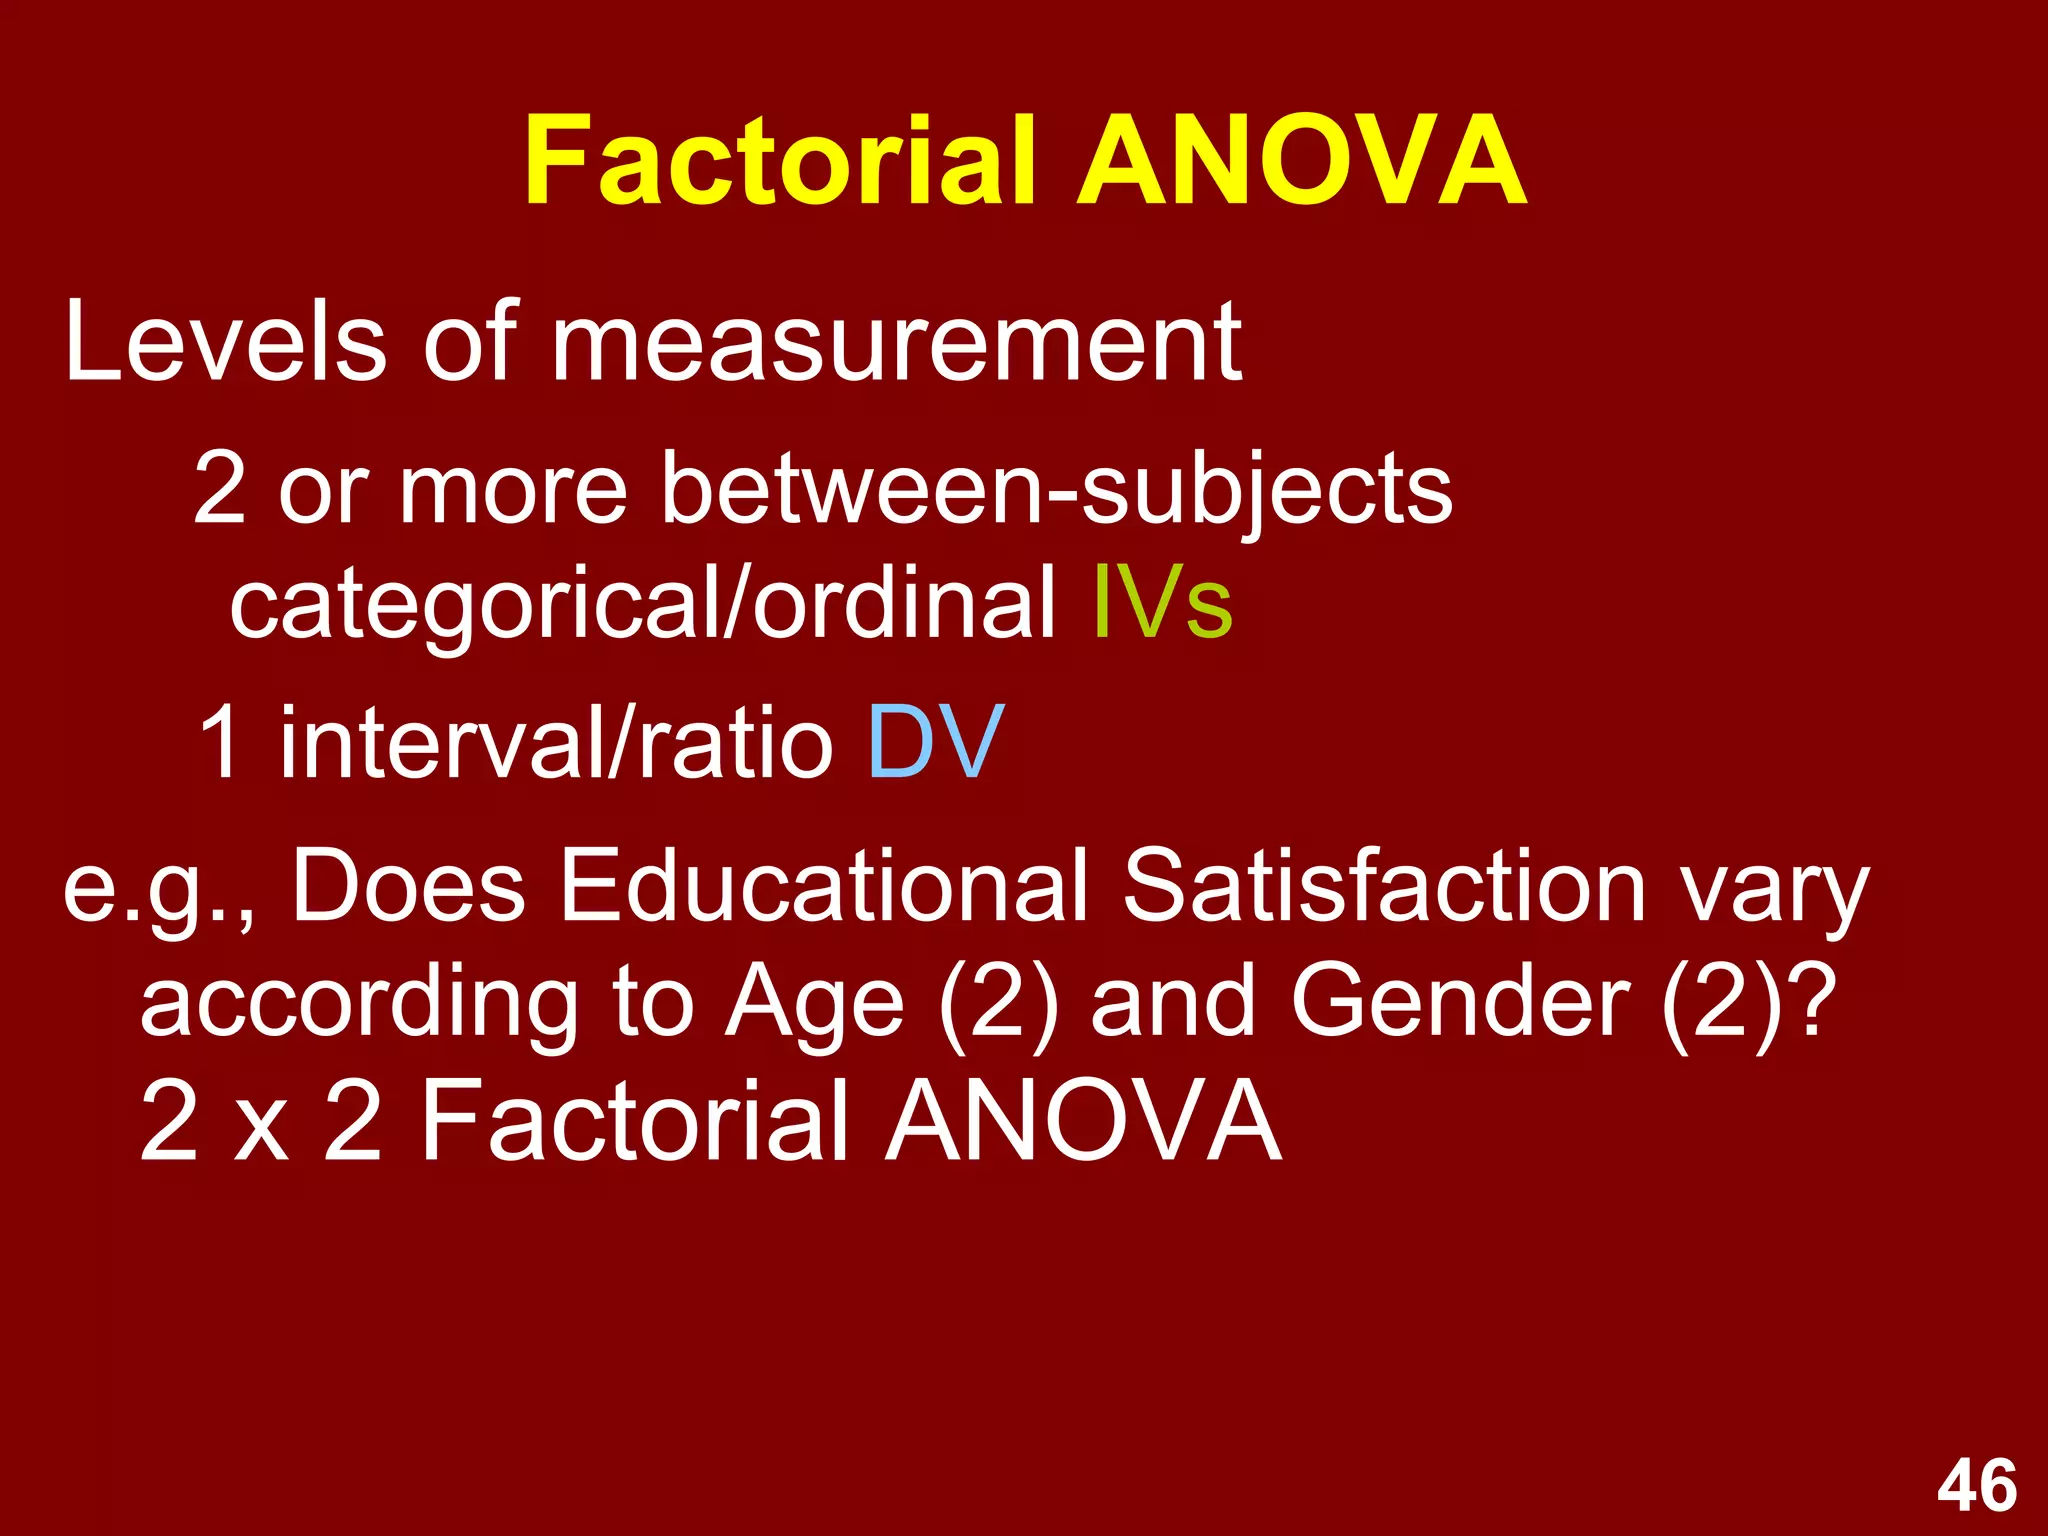
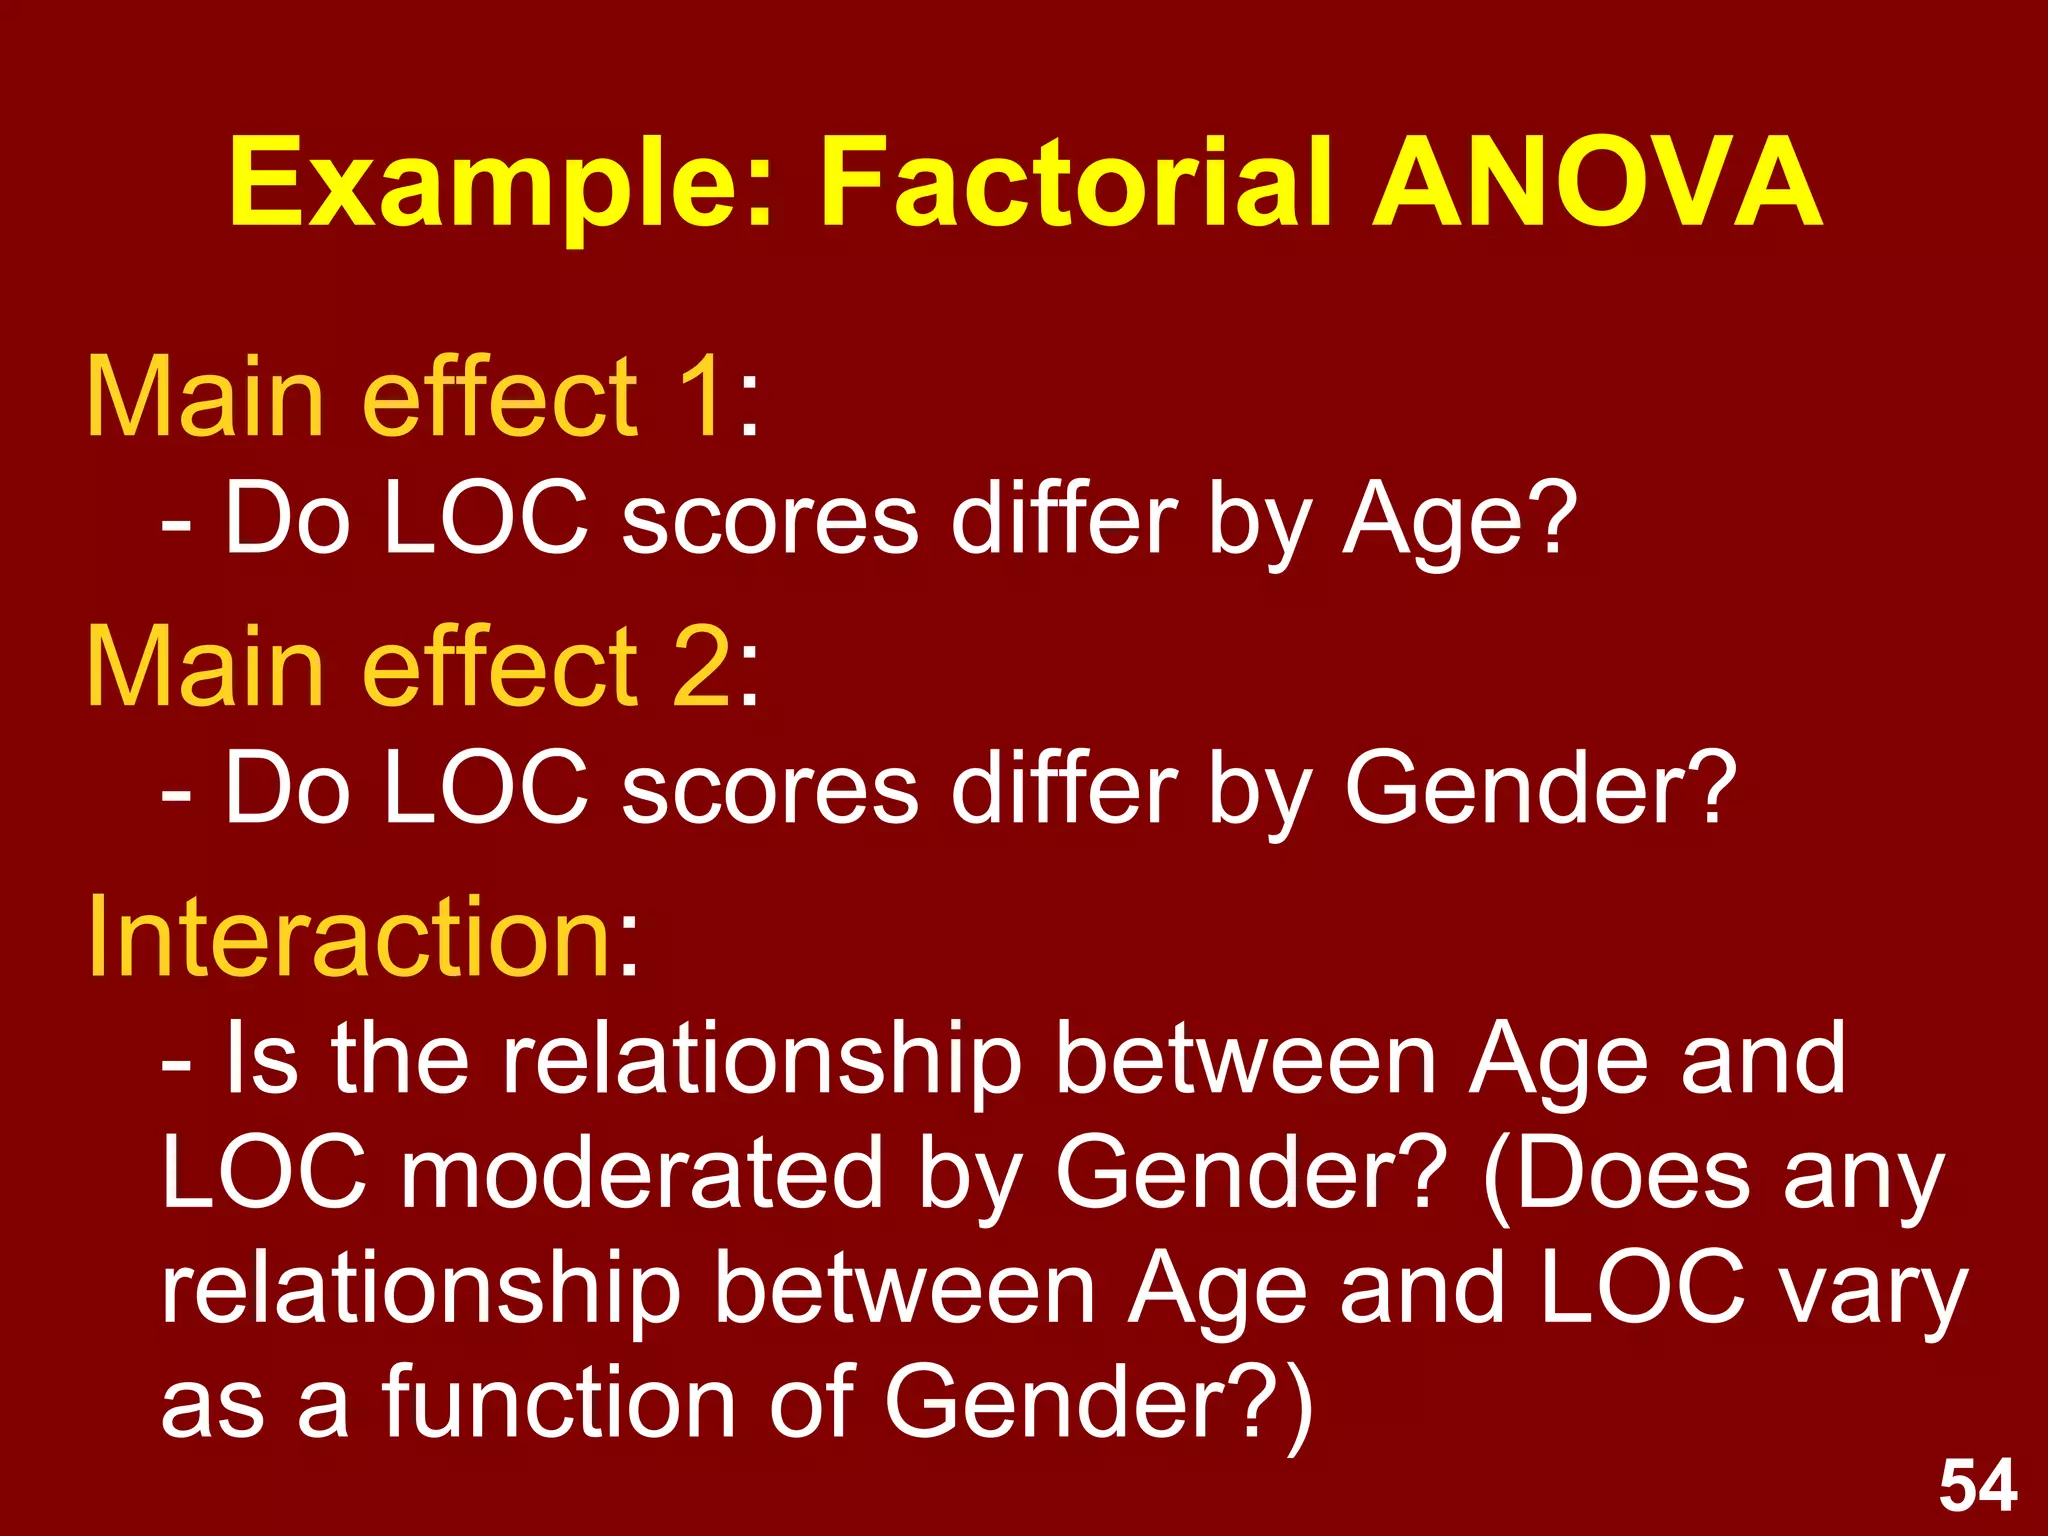
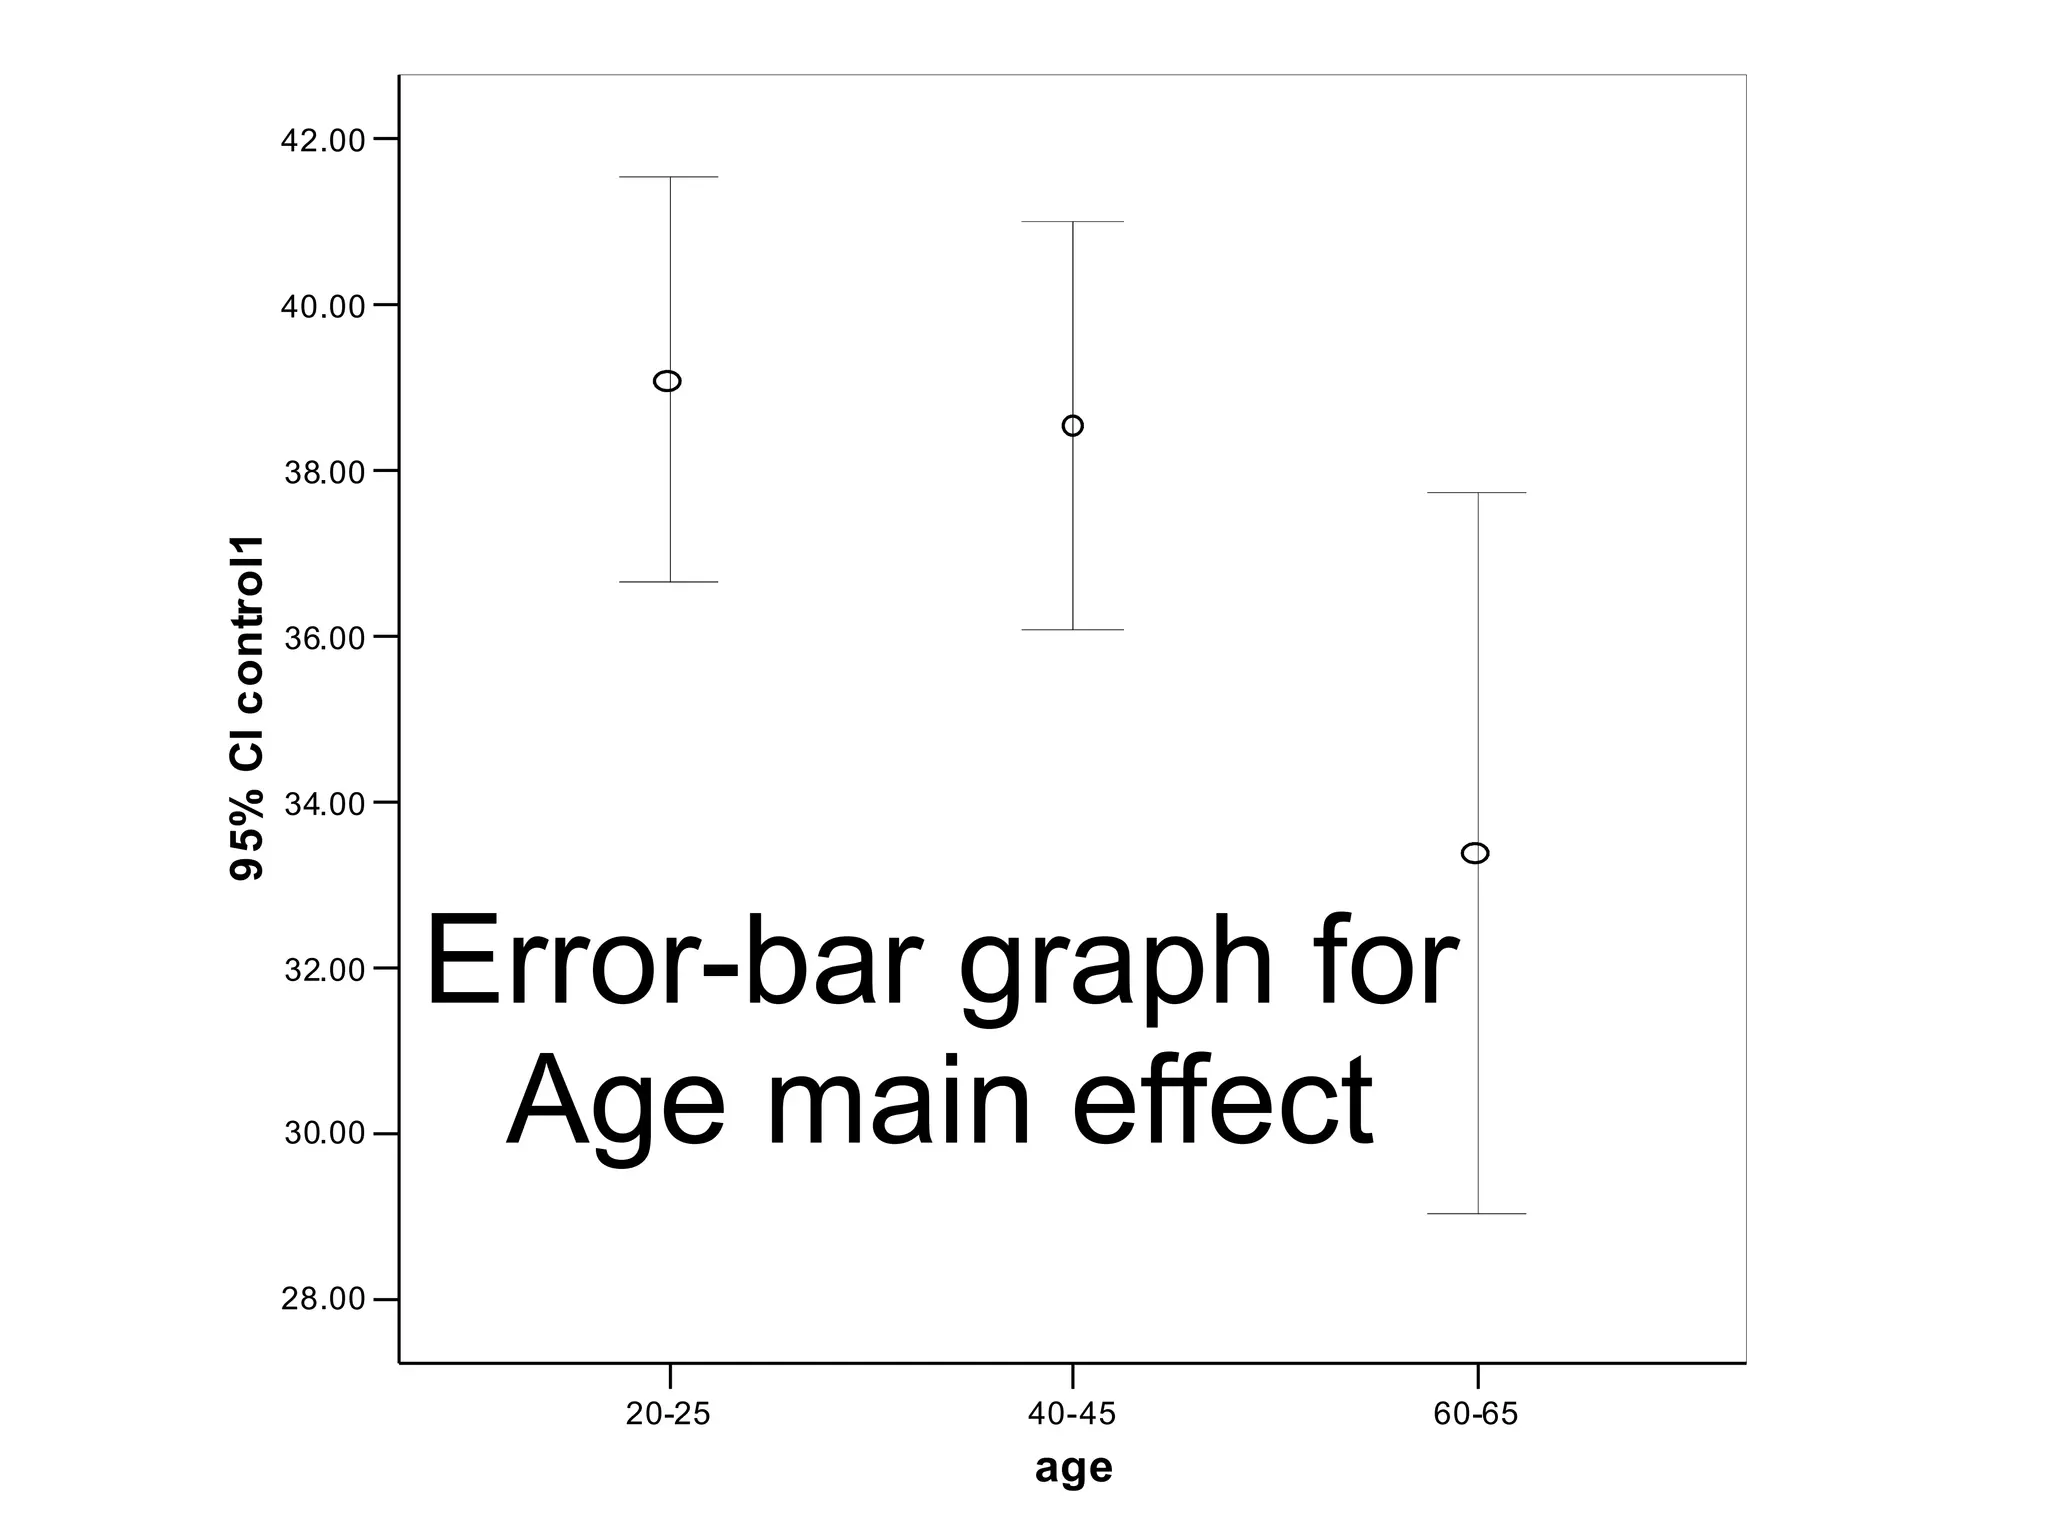
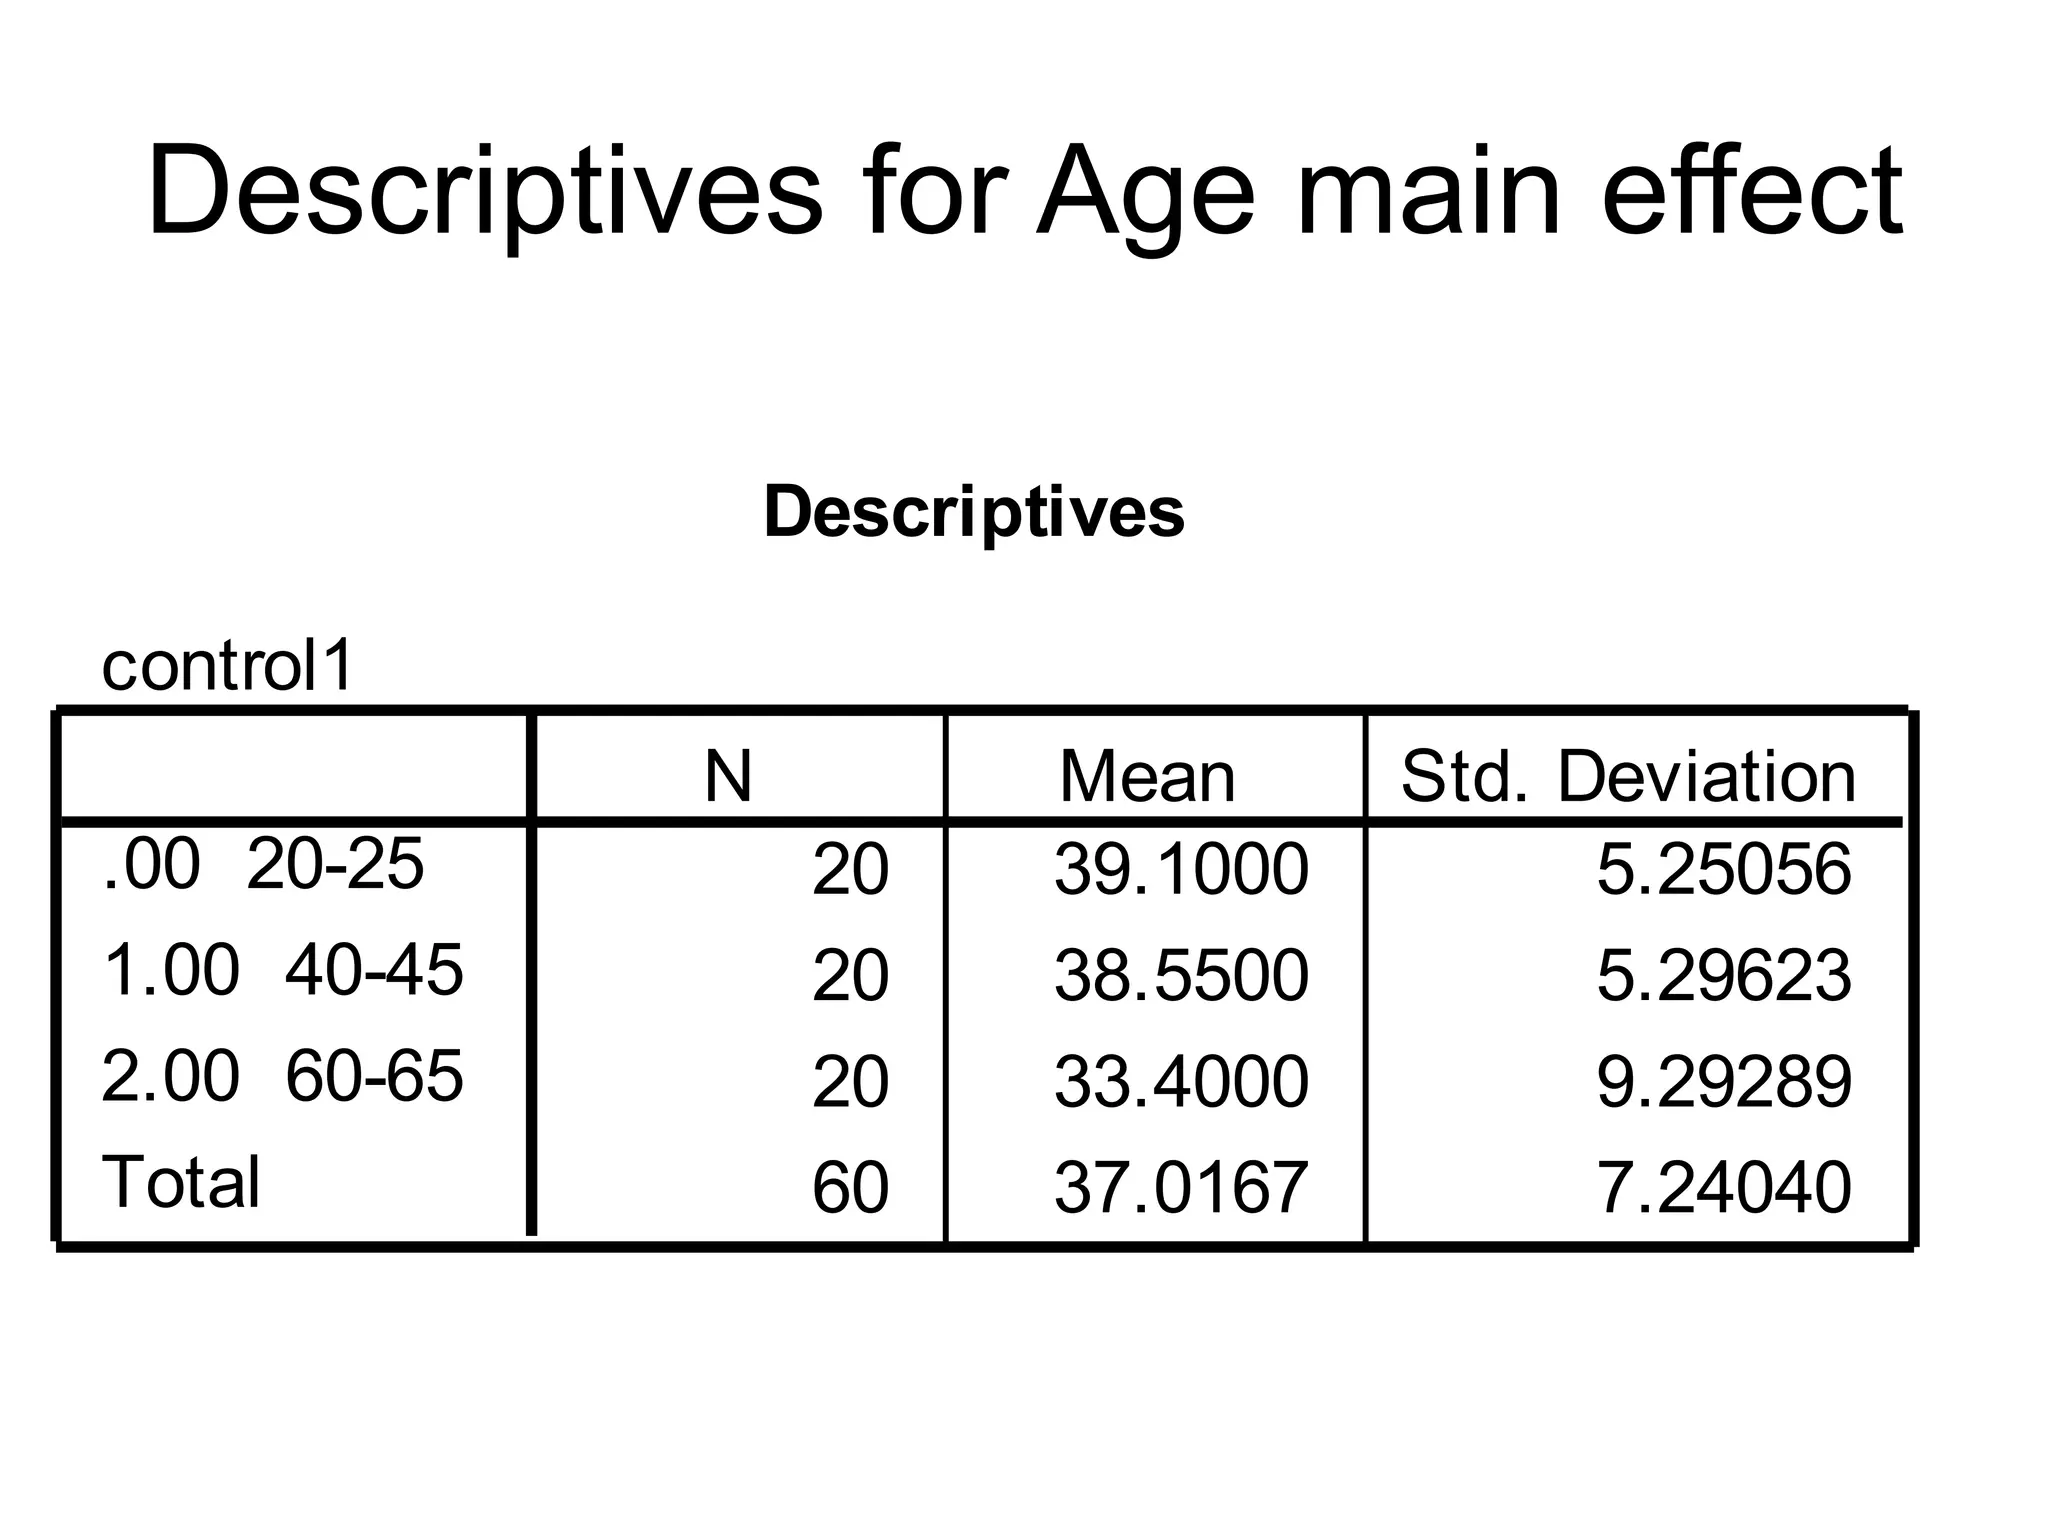
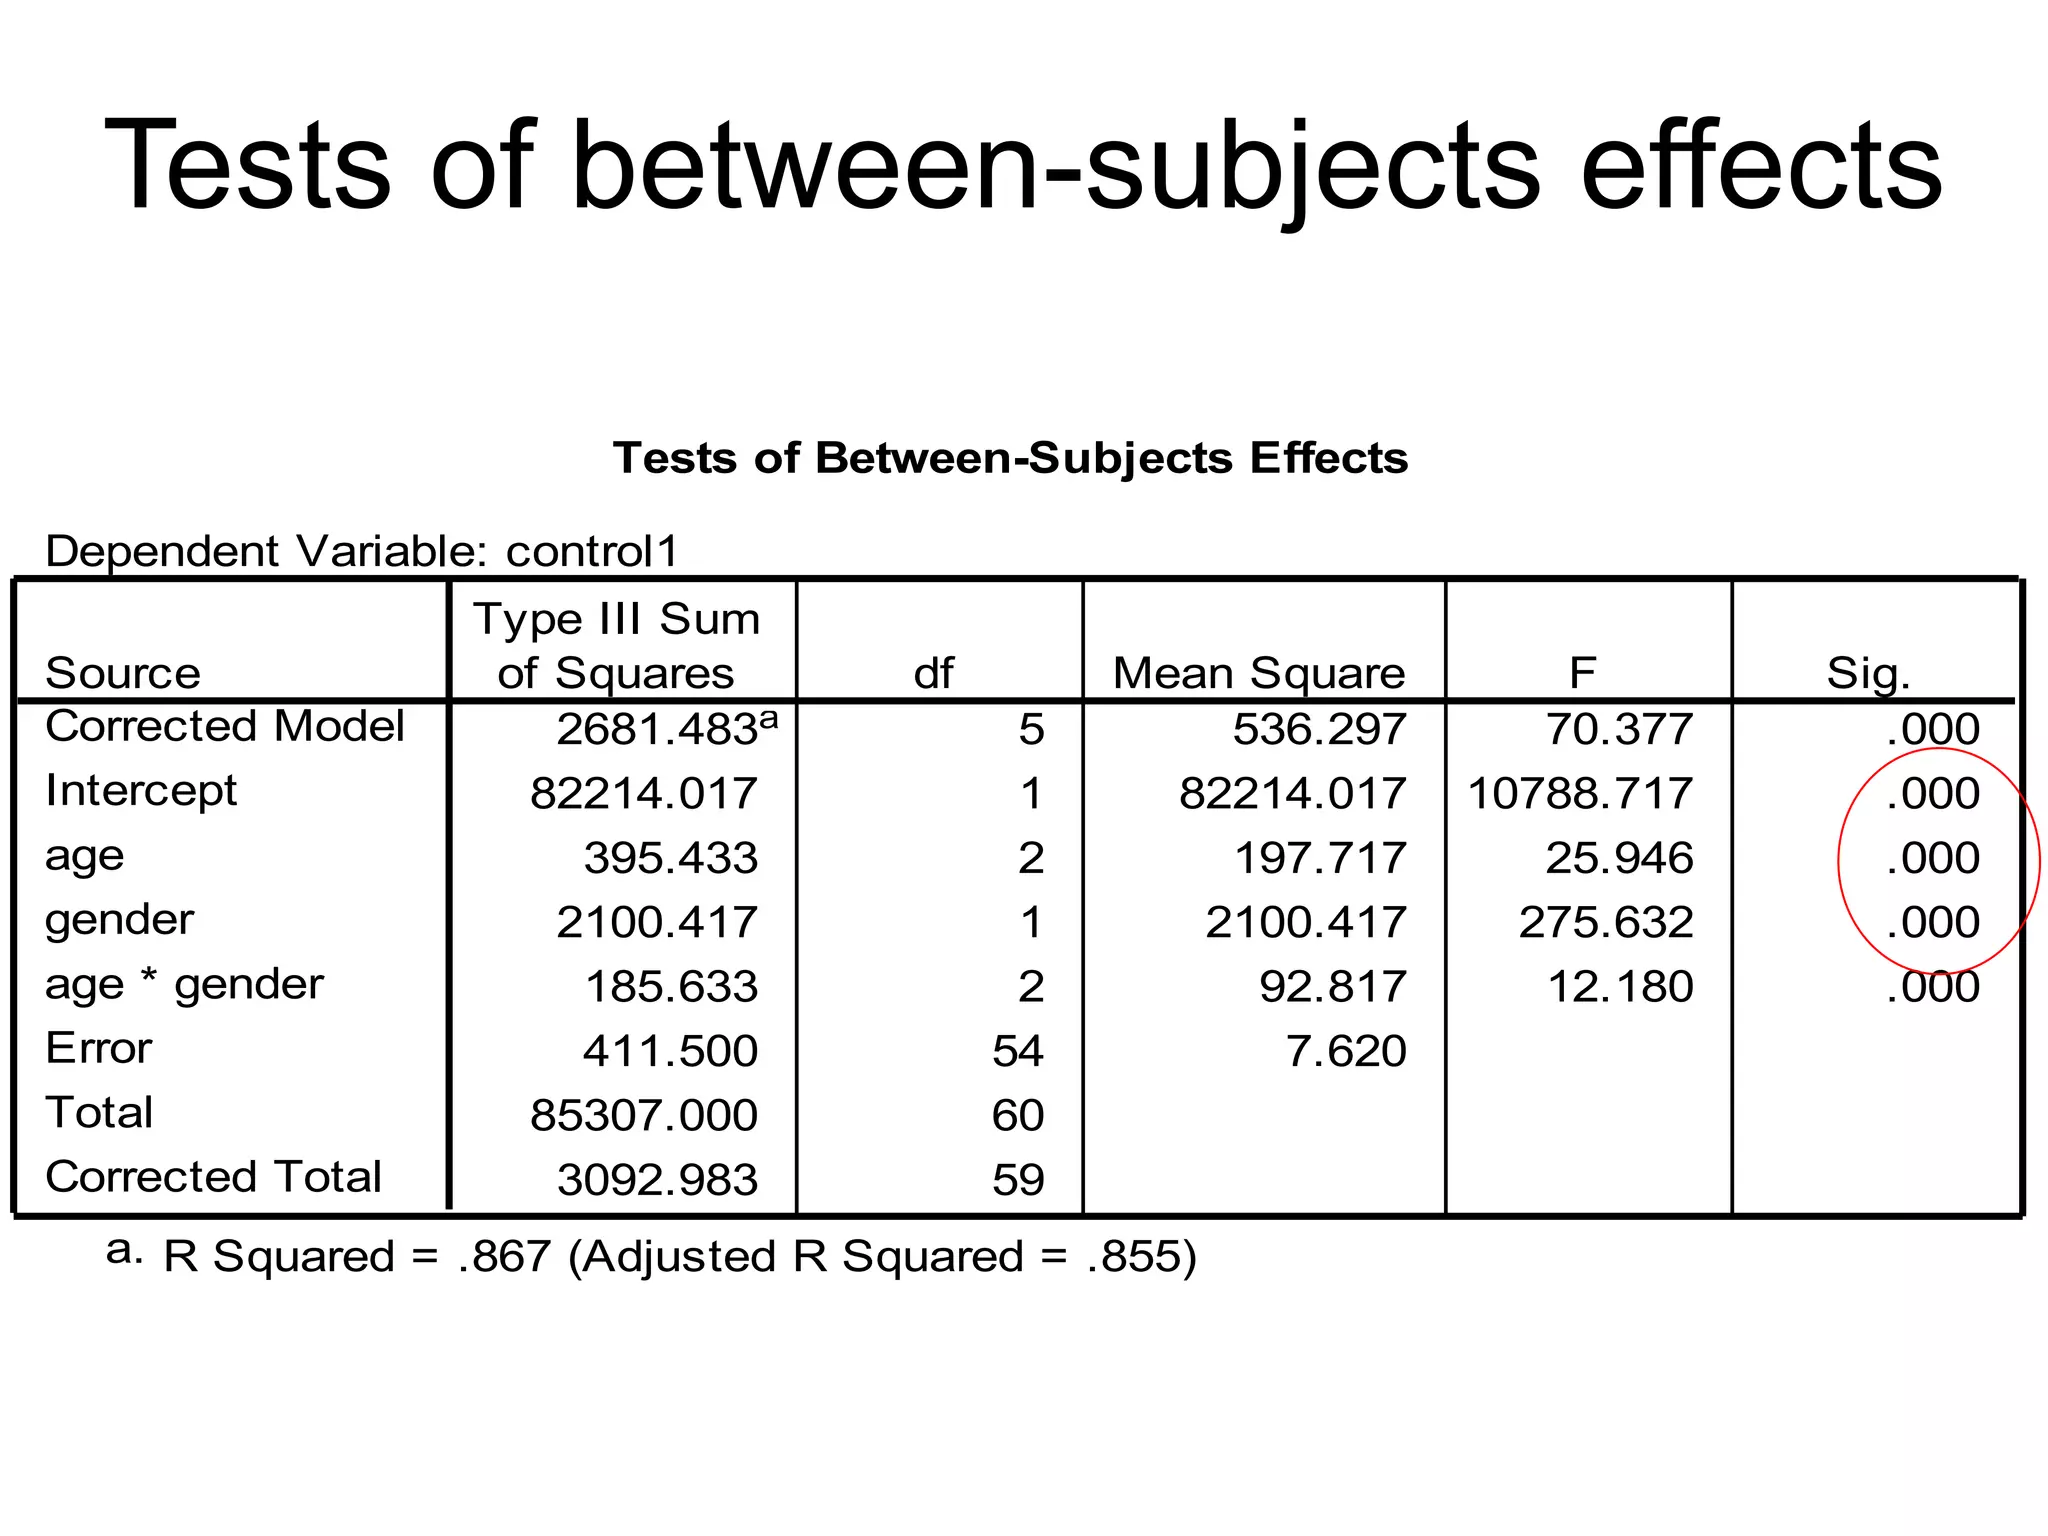
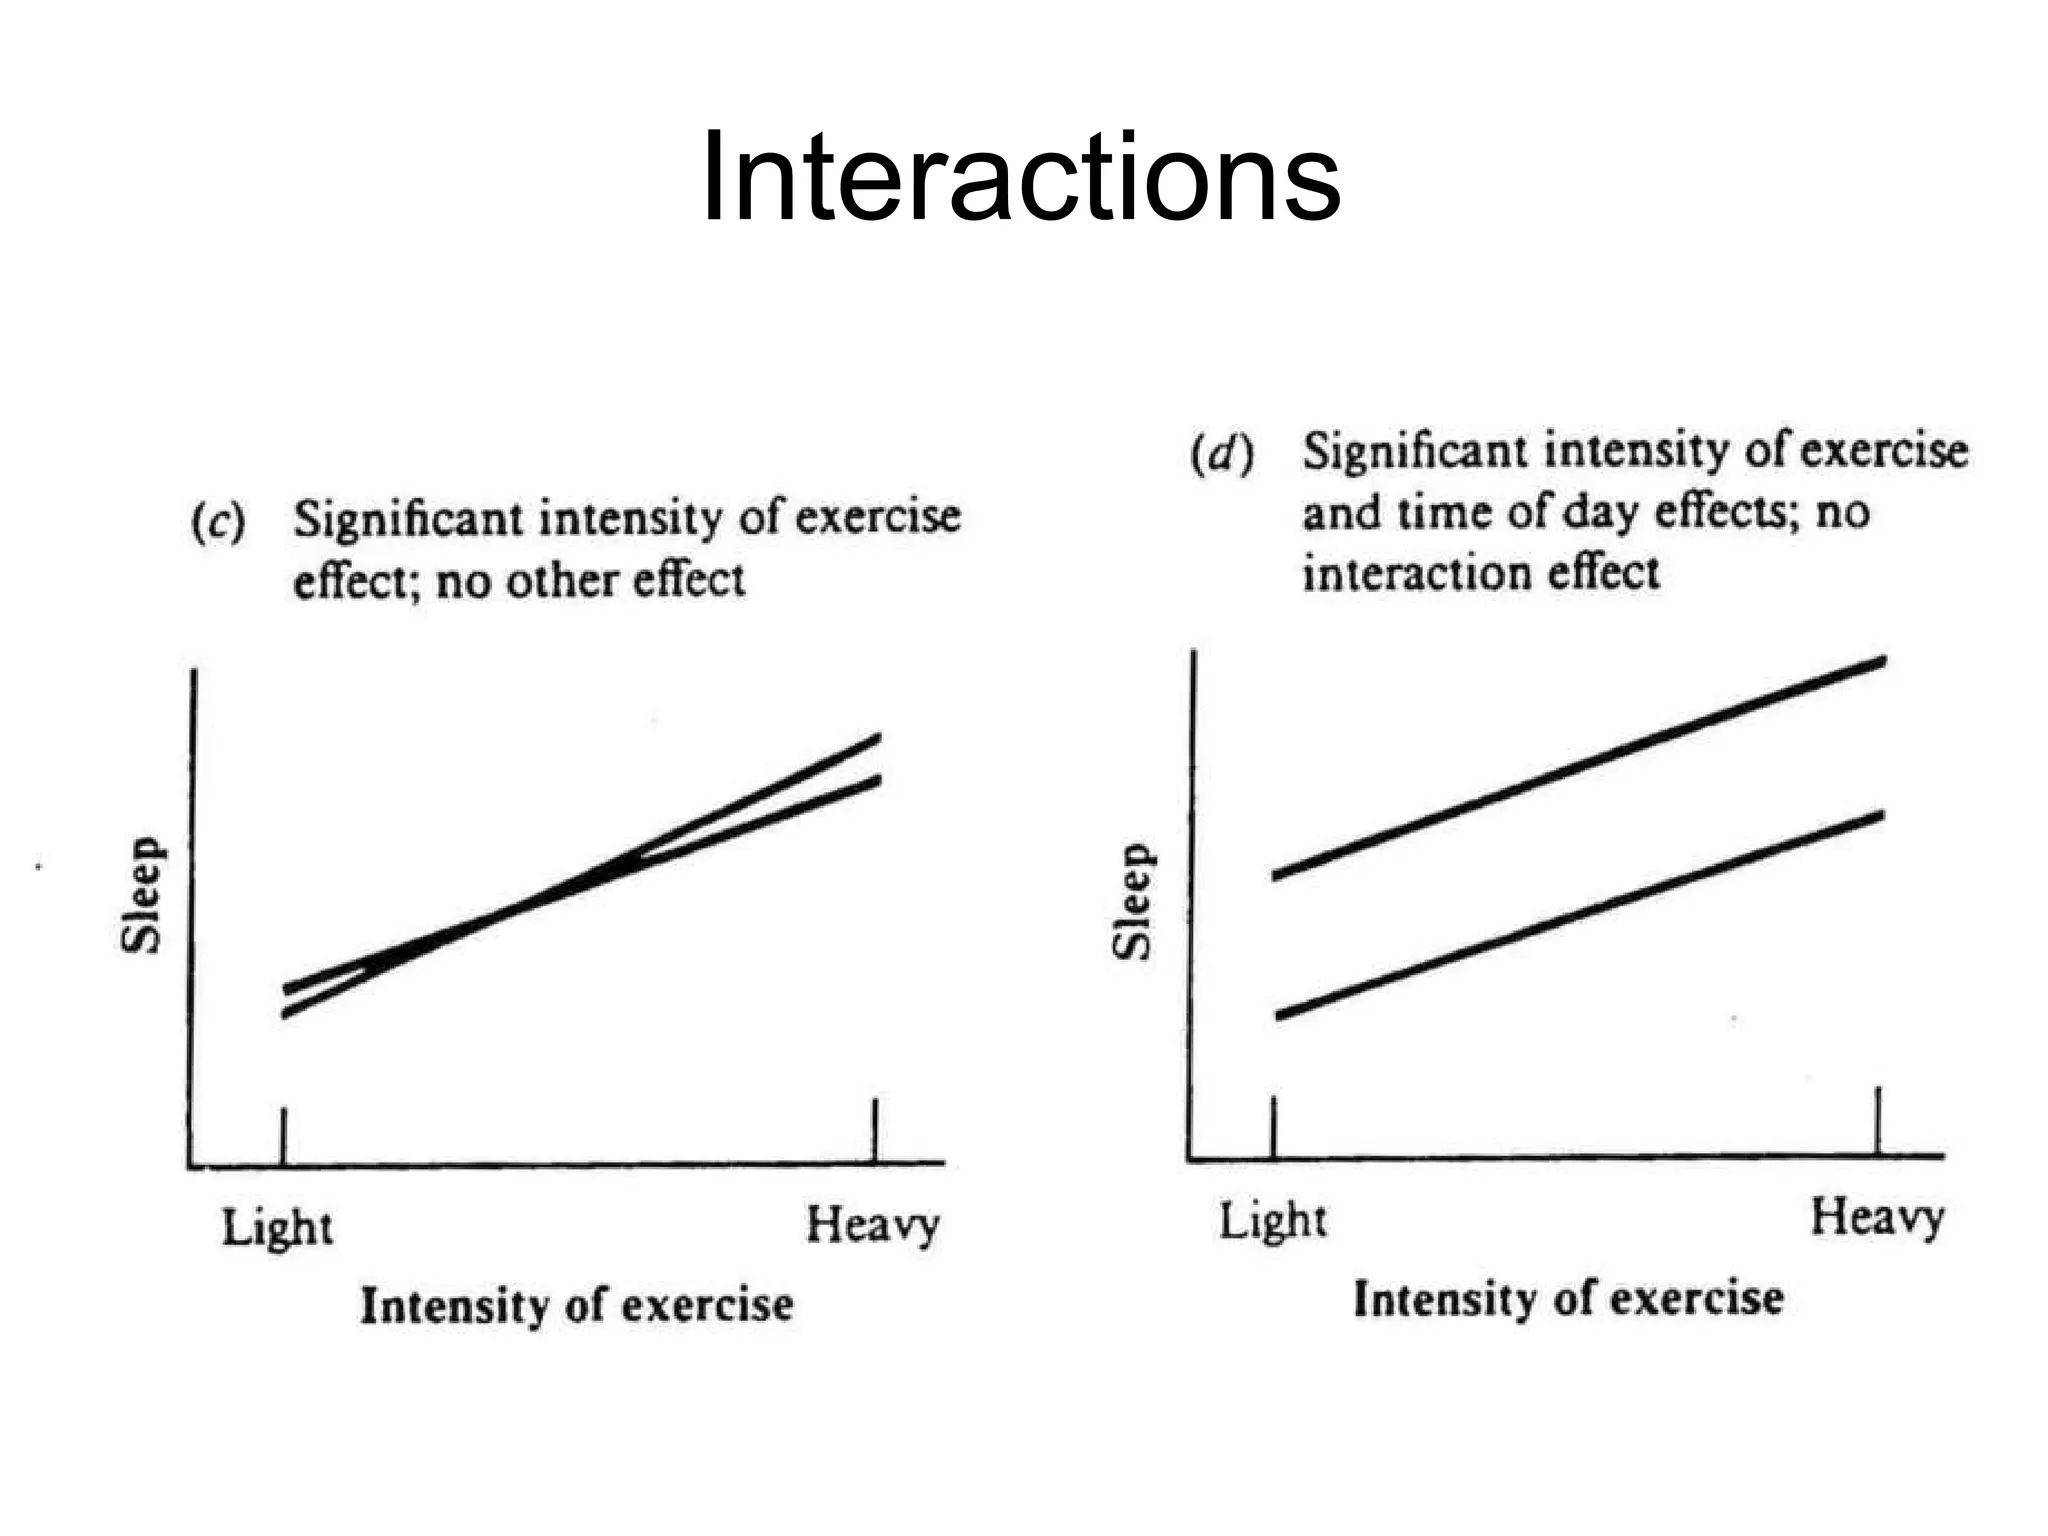
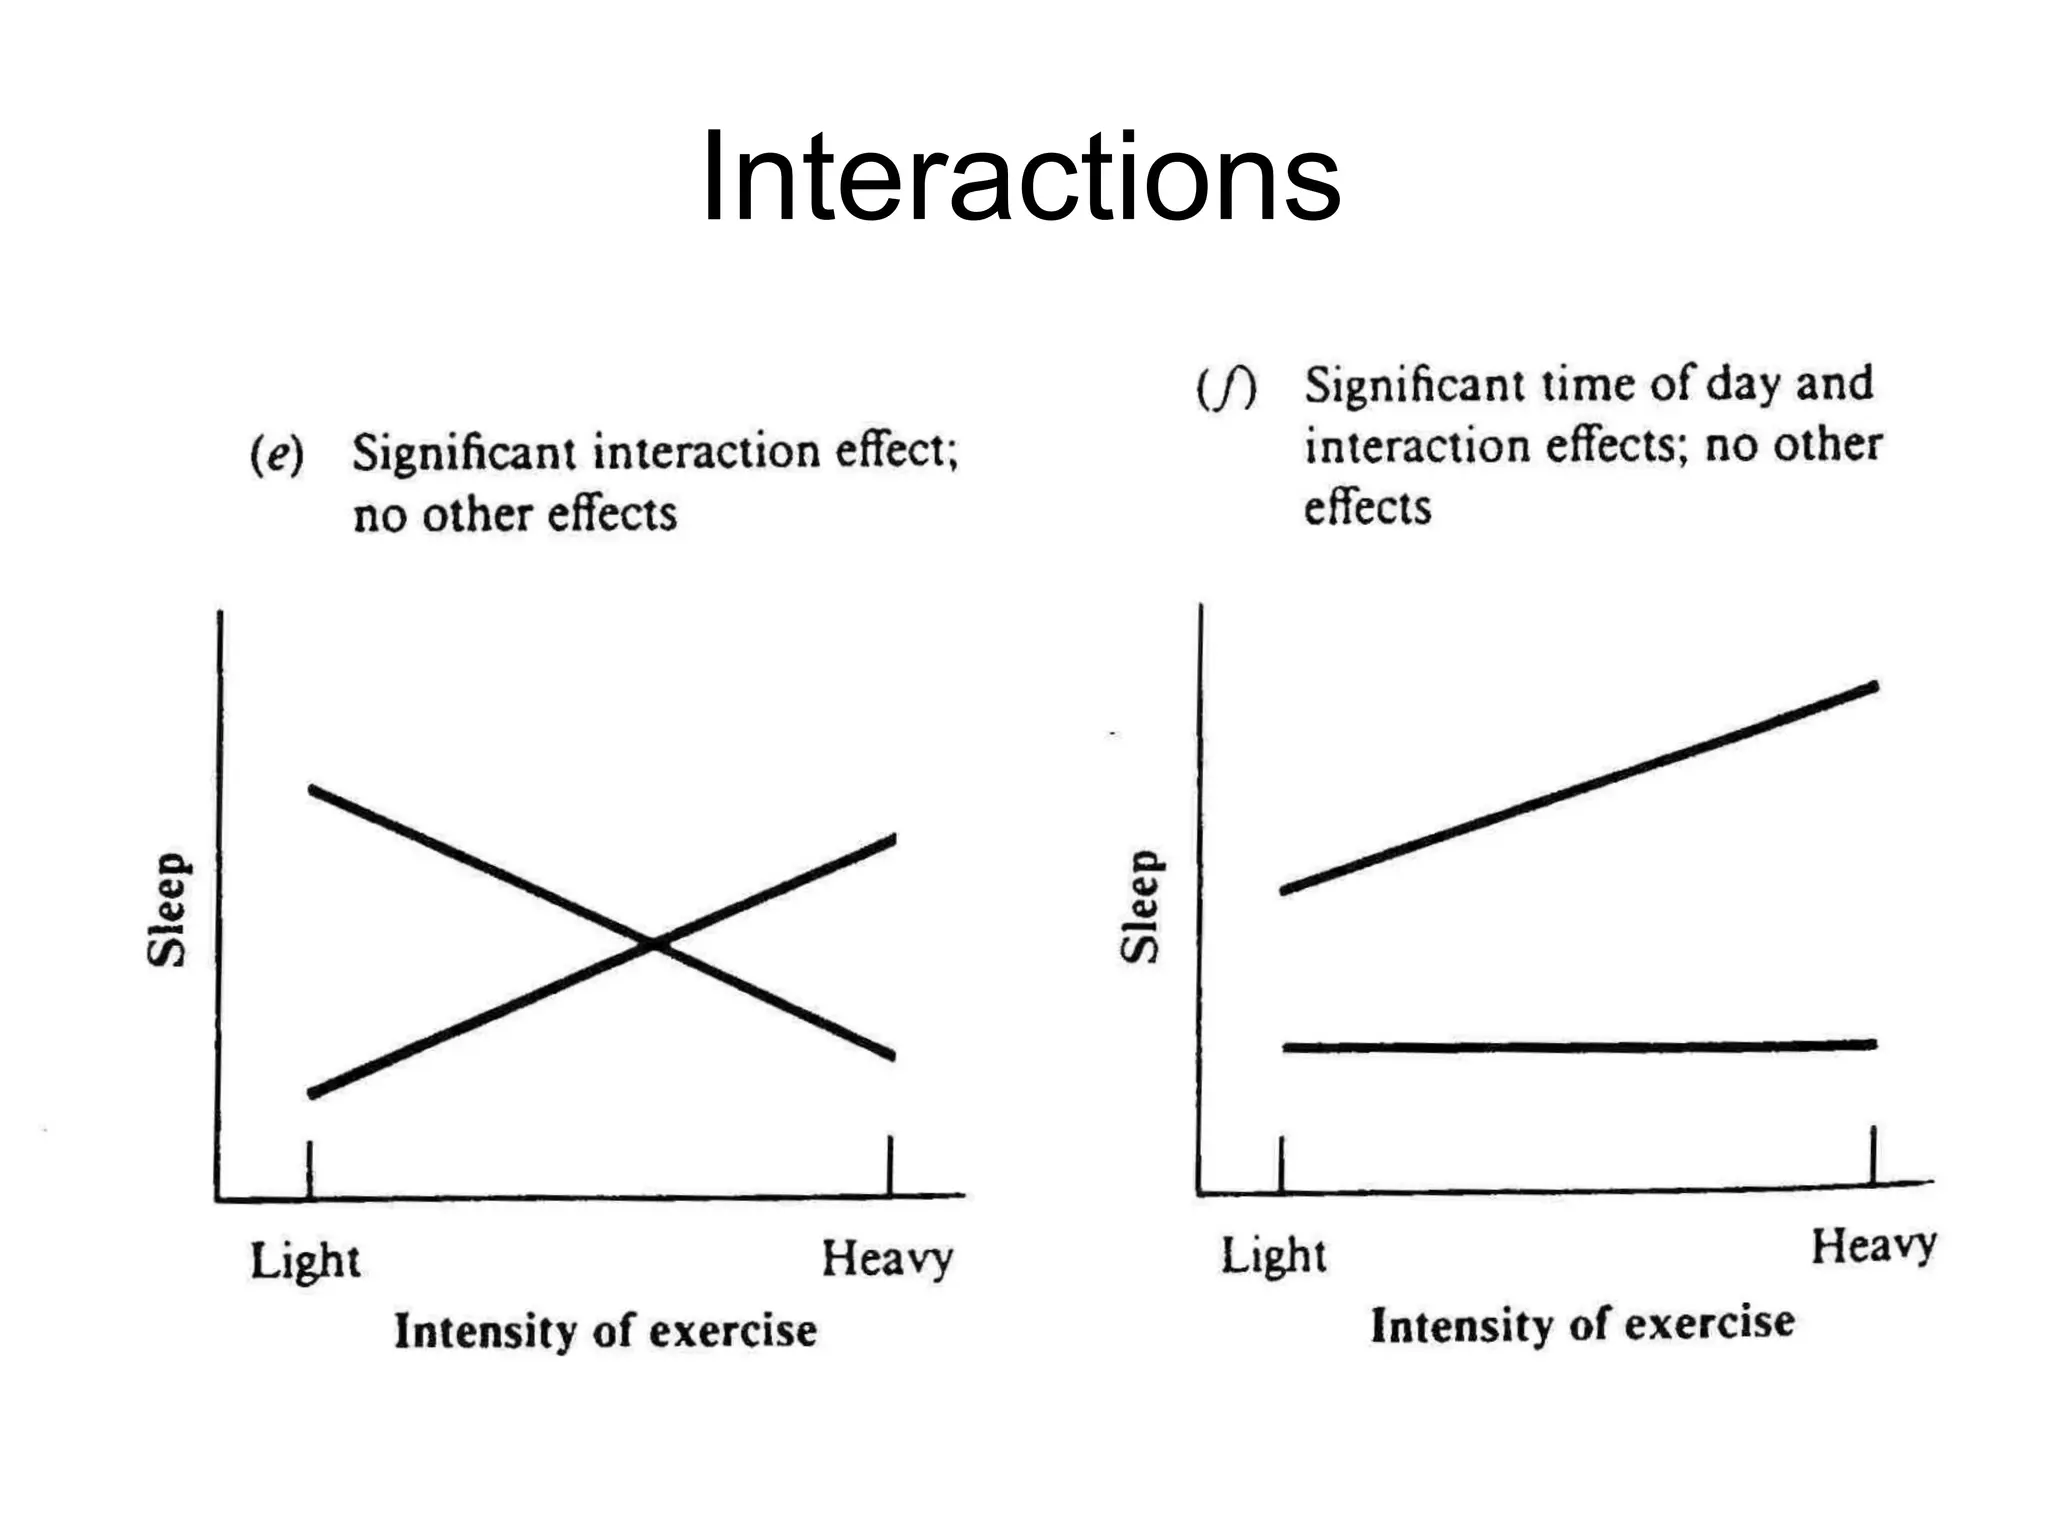
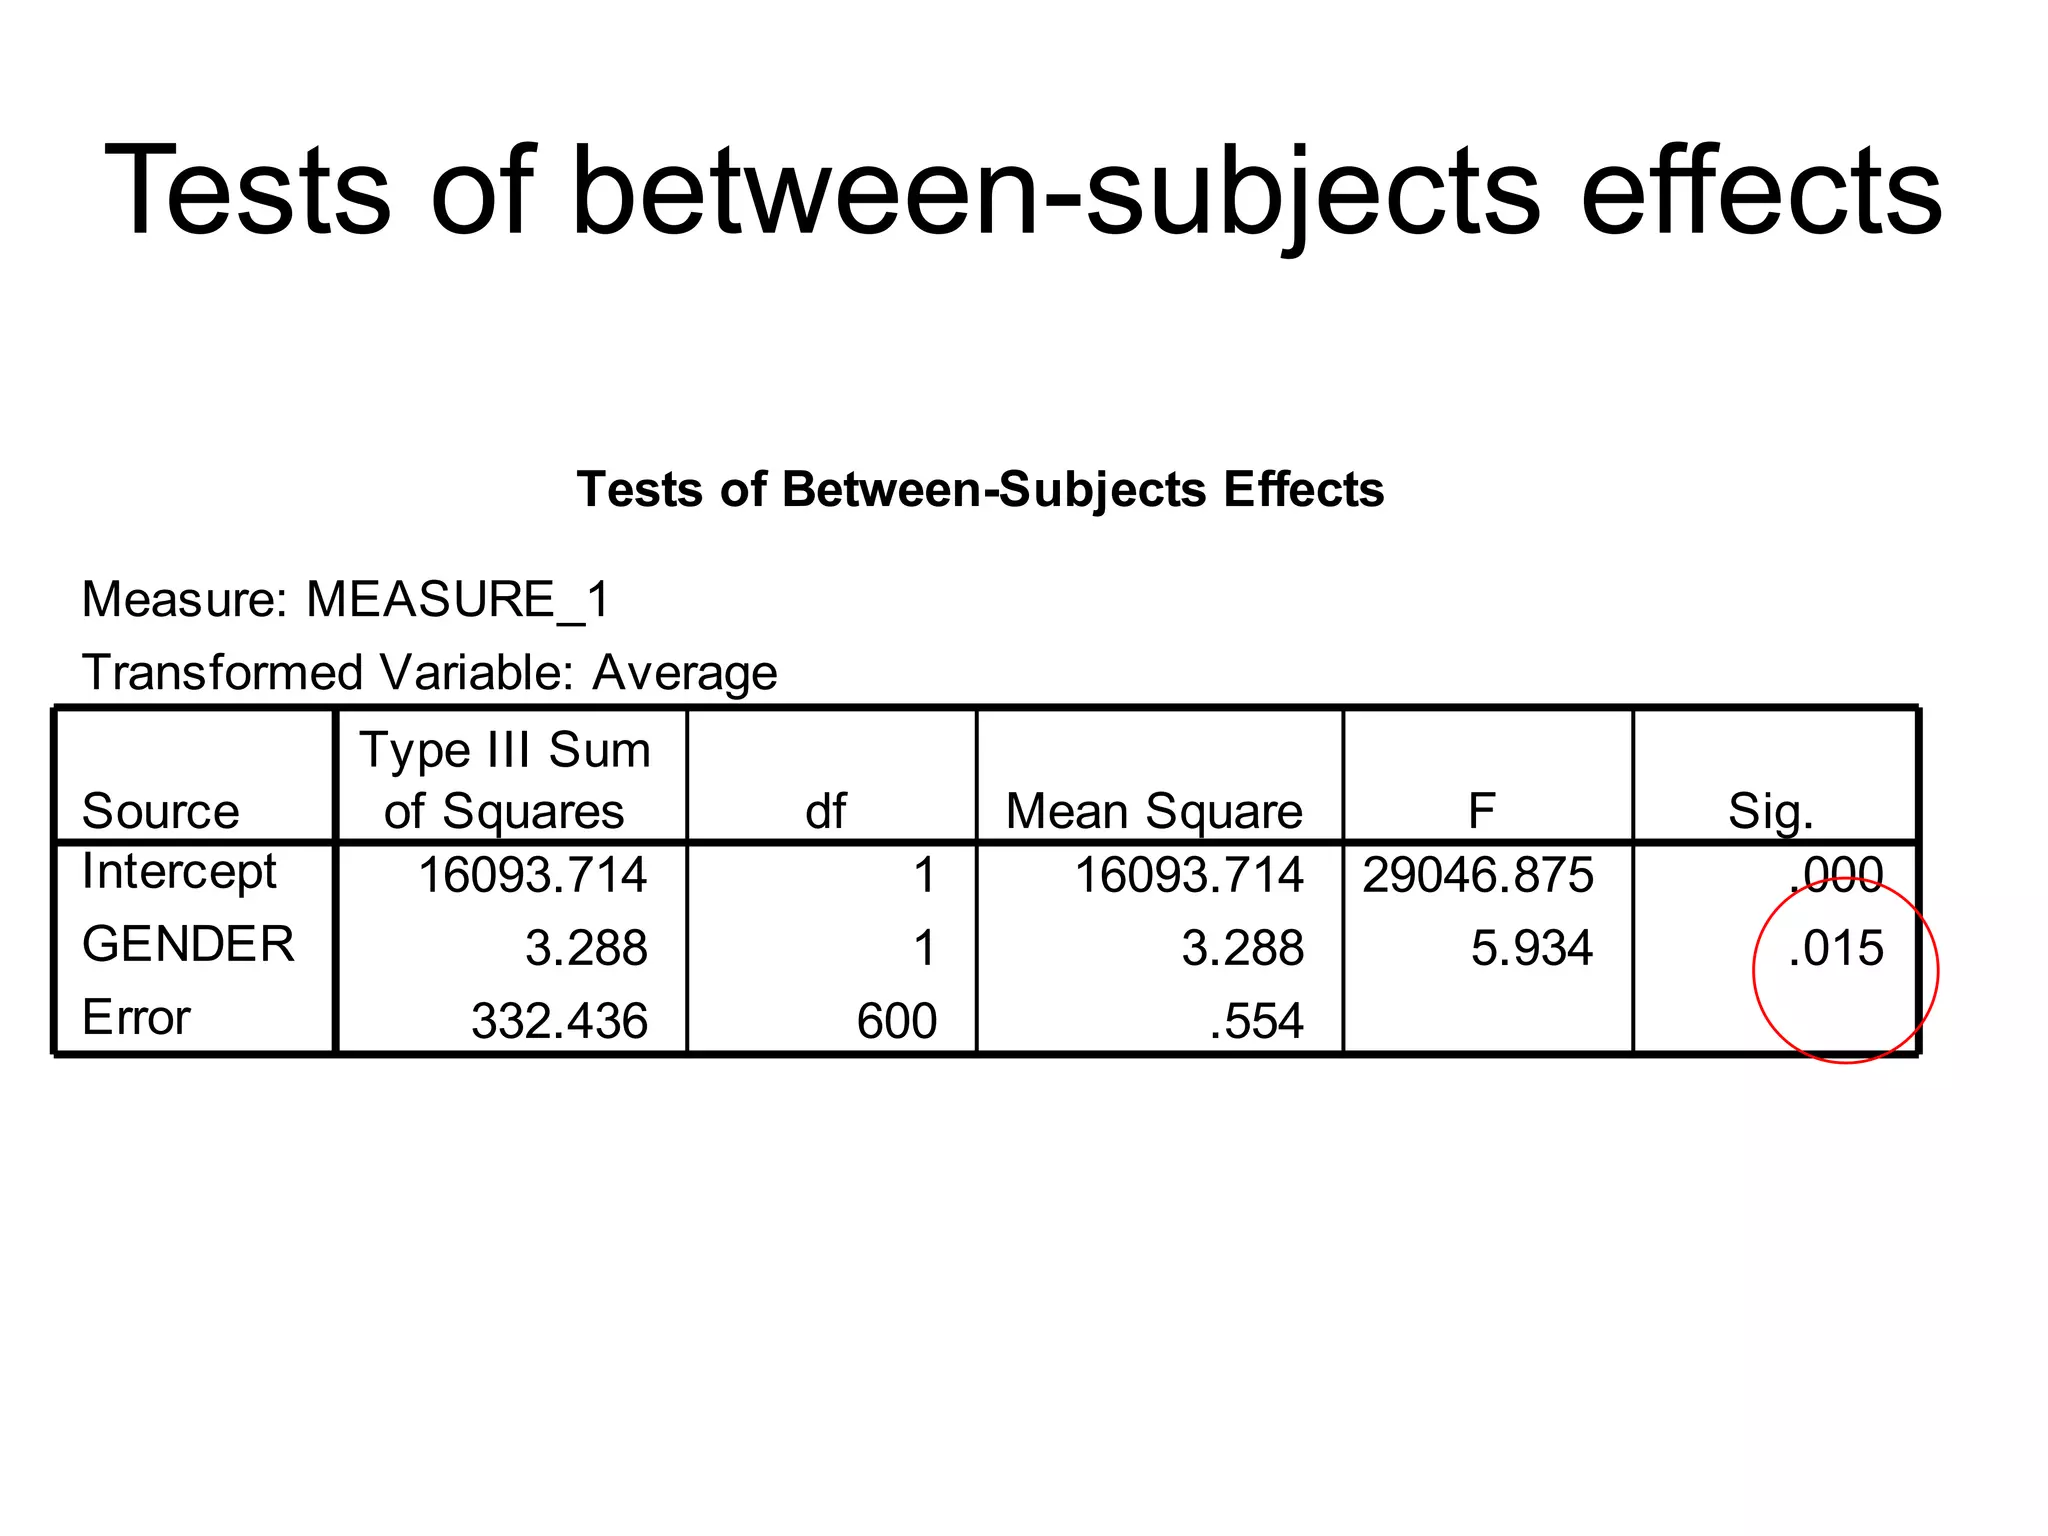
Explanation of factorial ANOVA including main effects and interactions; examples related to gender and age satisfaction levels.
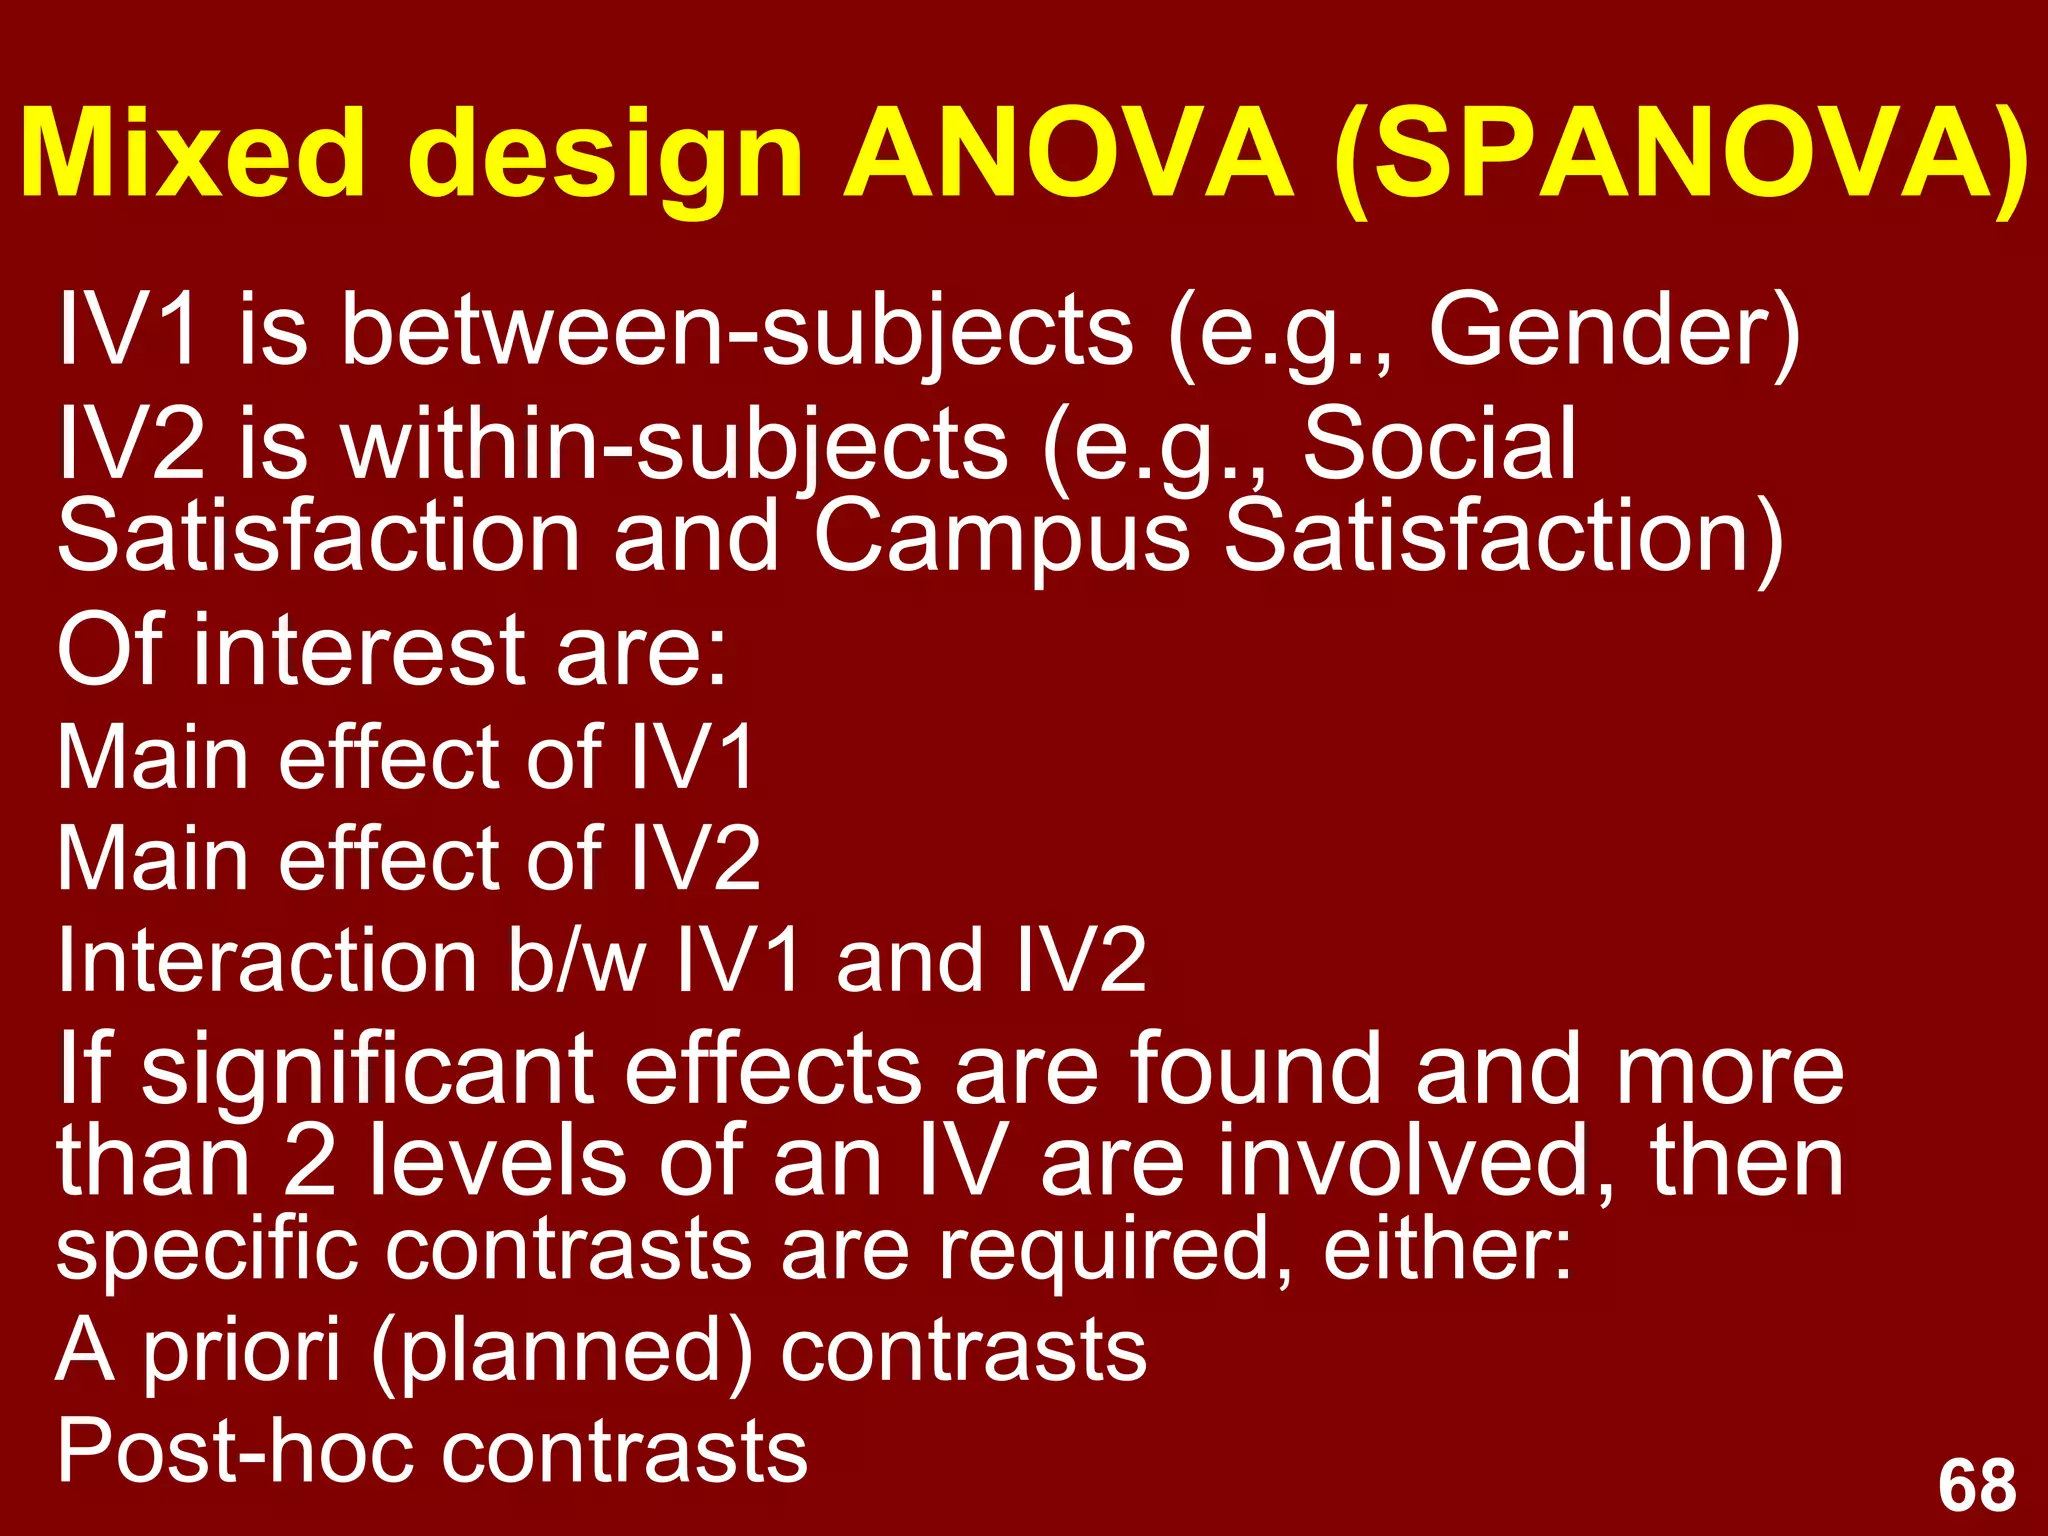
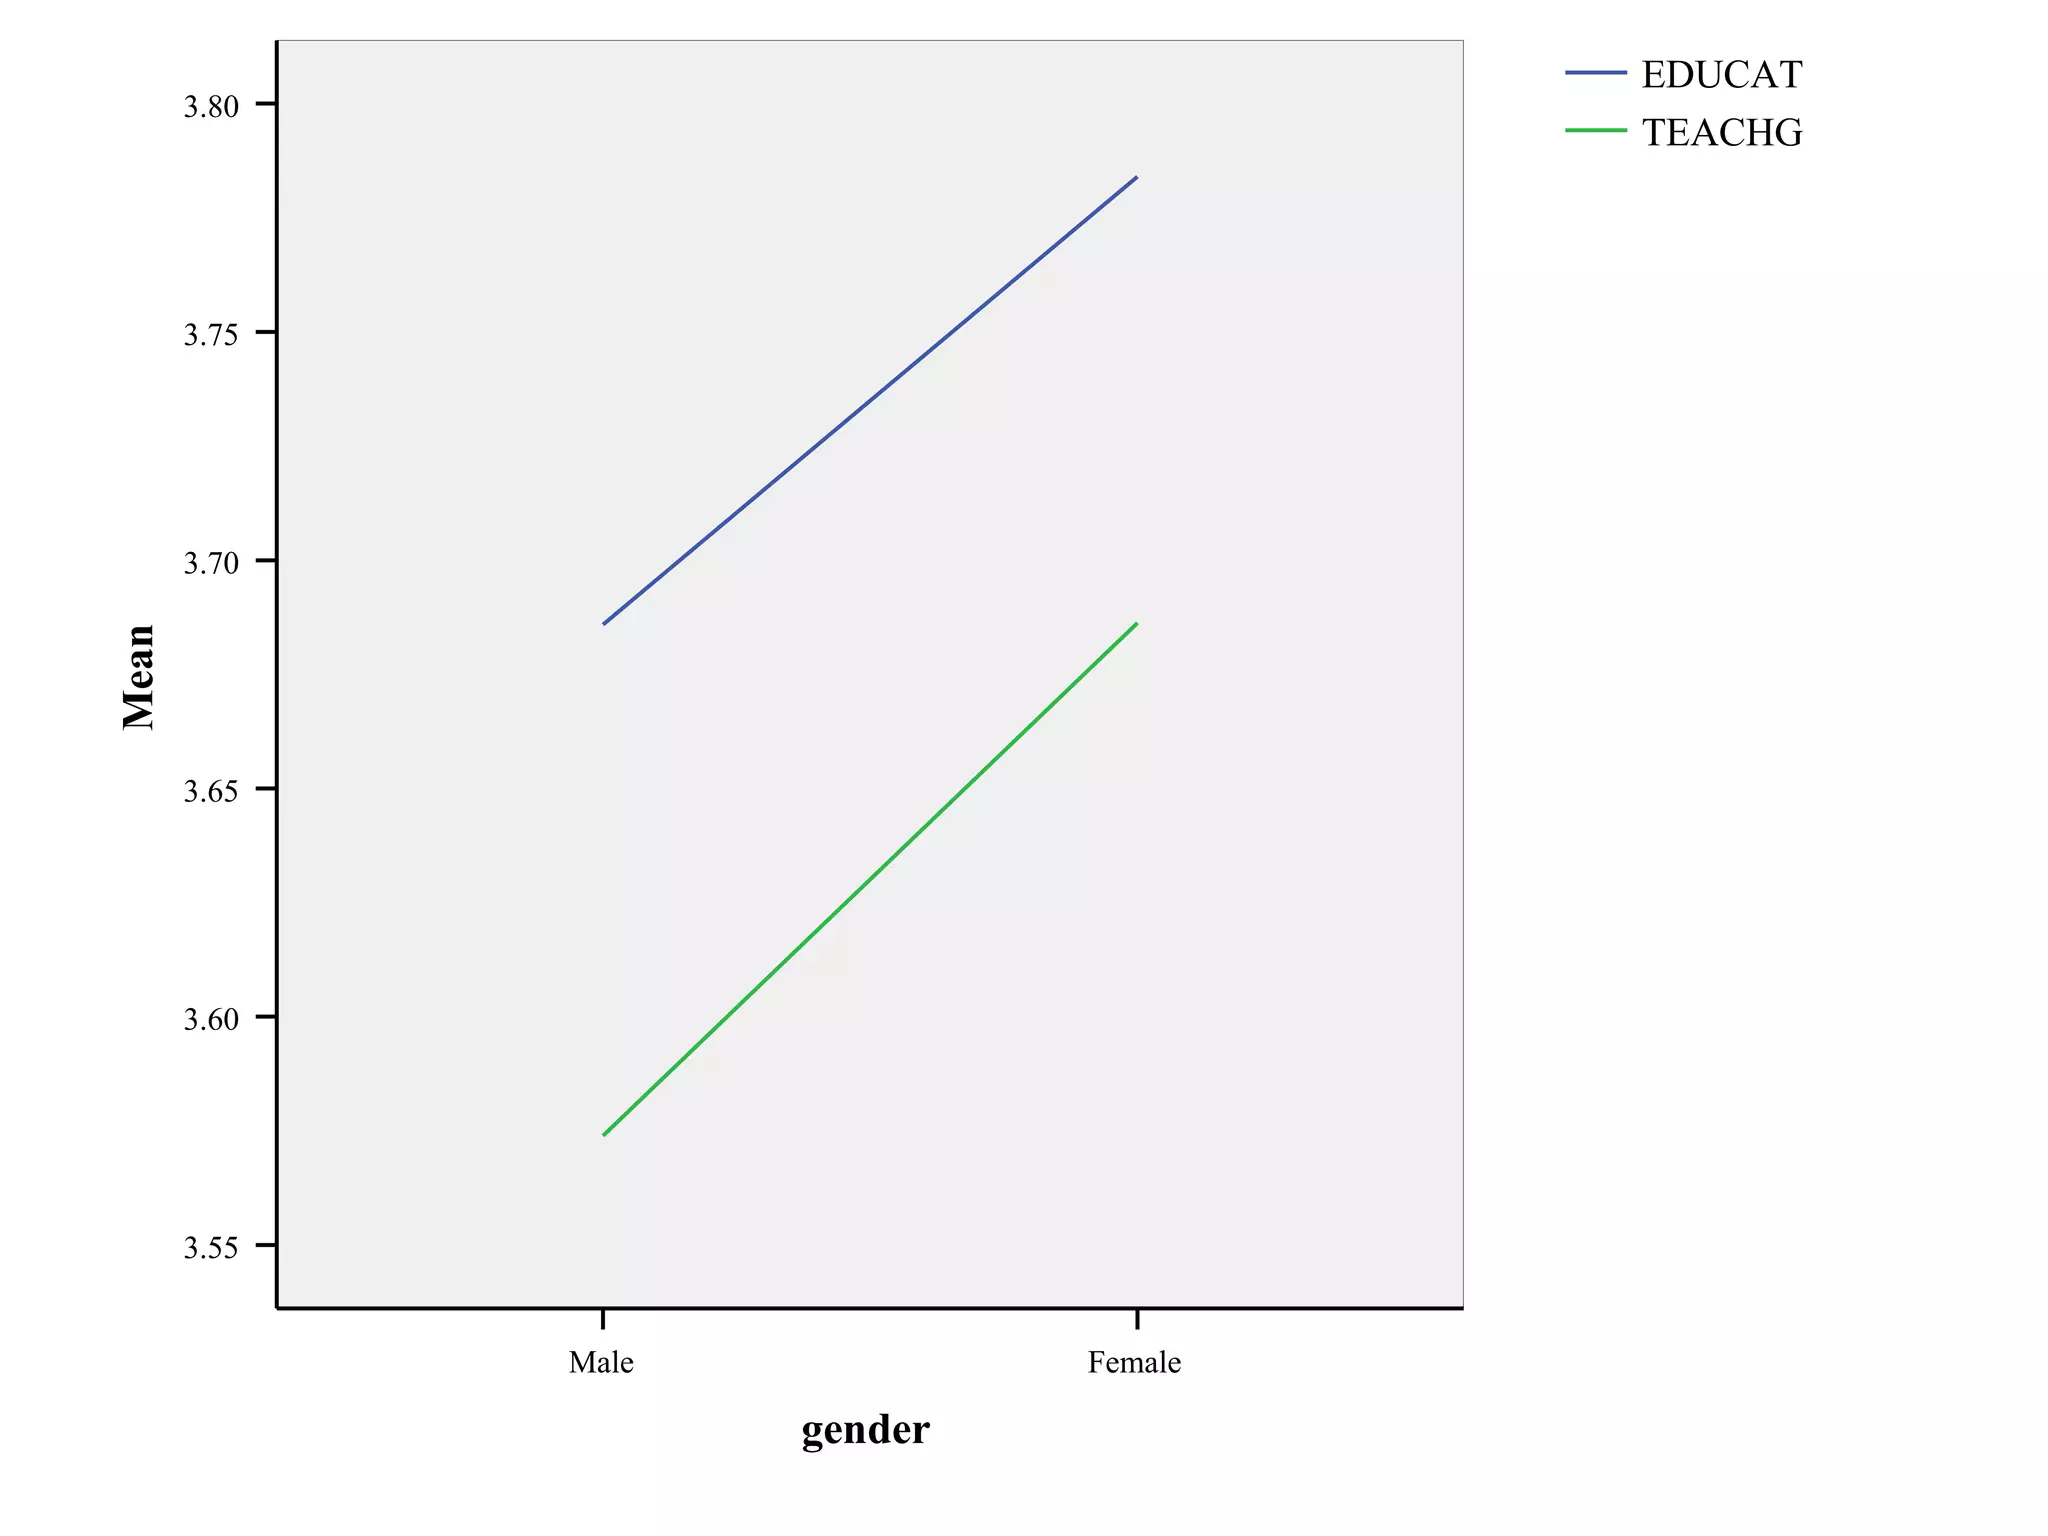
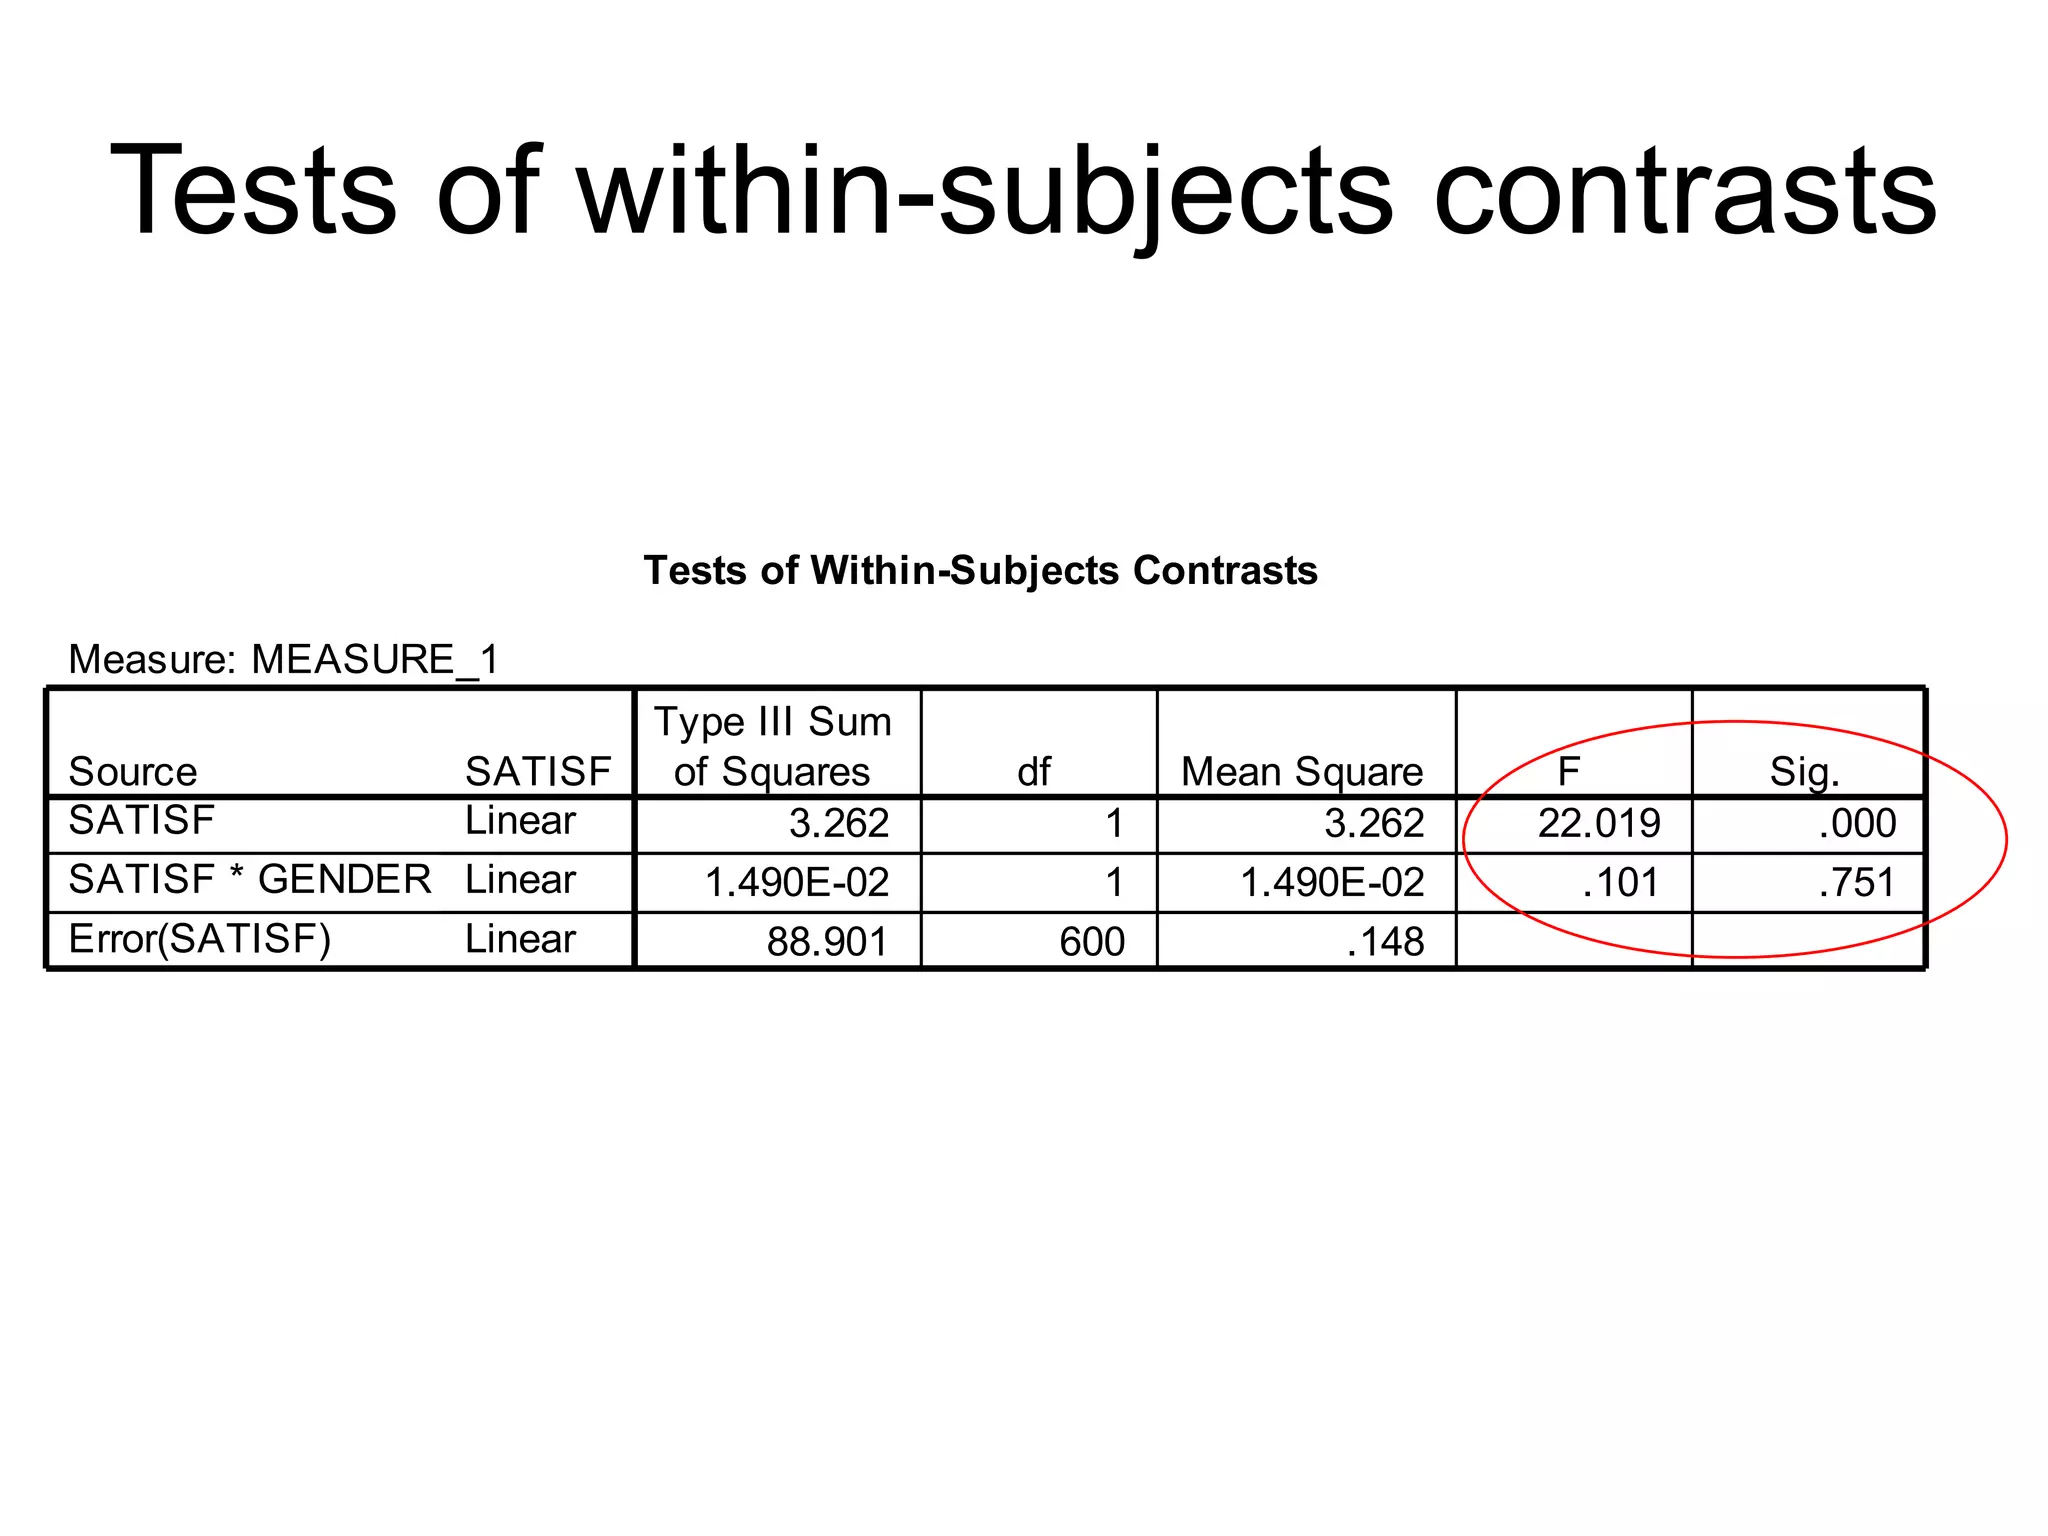
Introduction to mixed design ANOVA; example studies of satisfaction affected by both within and between-subject factors.
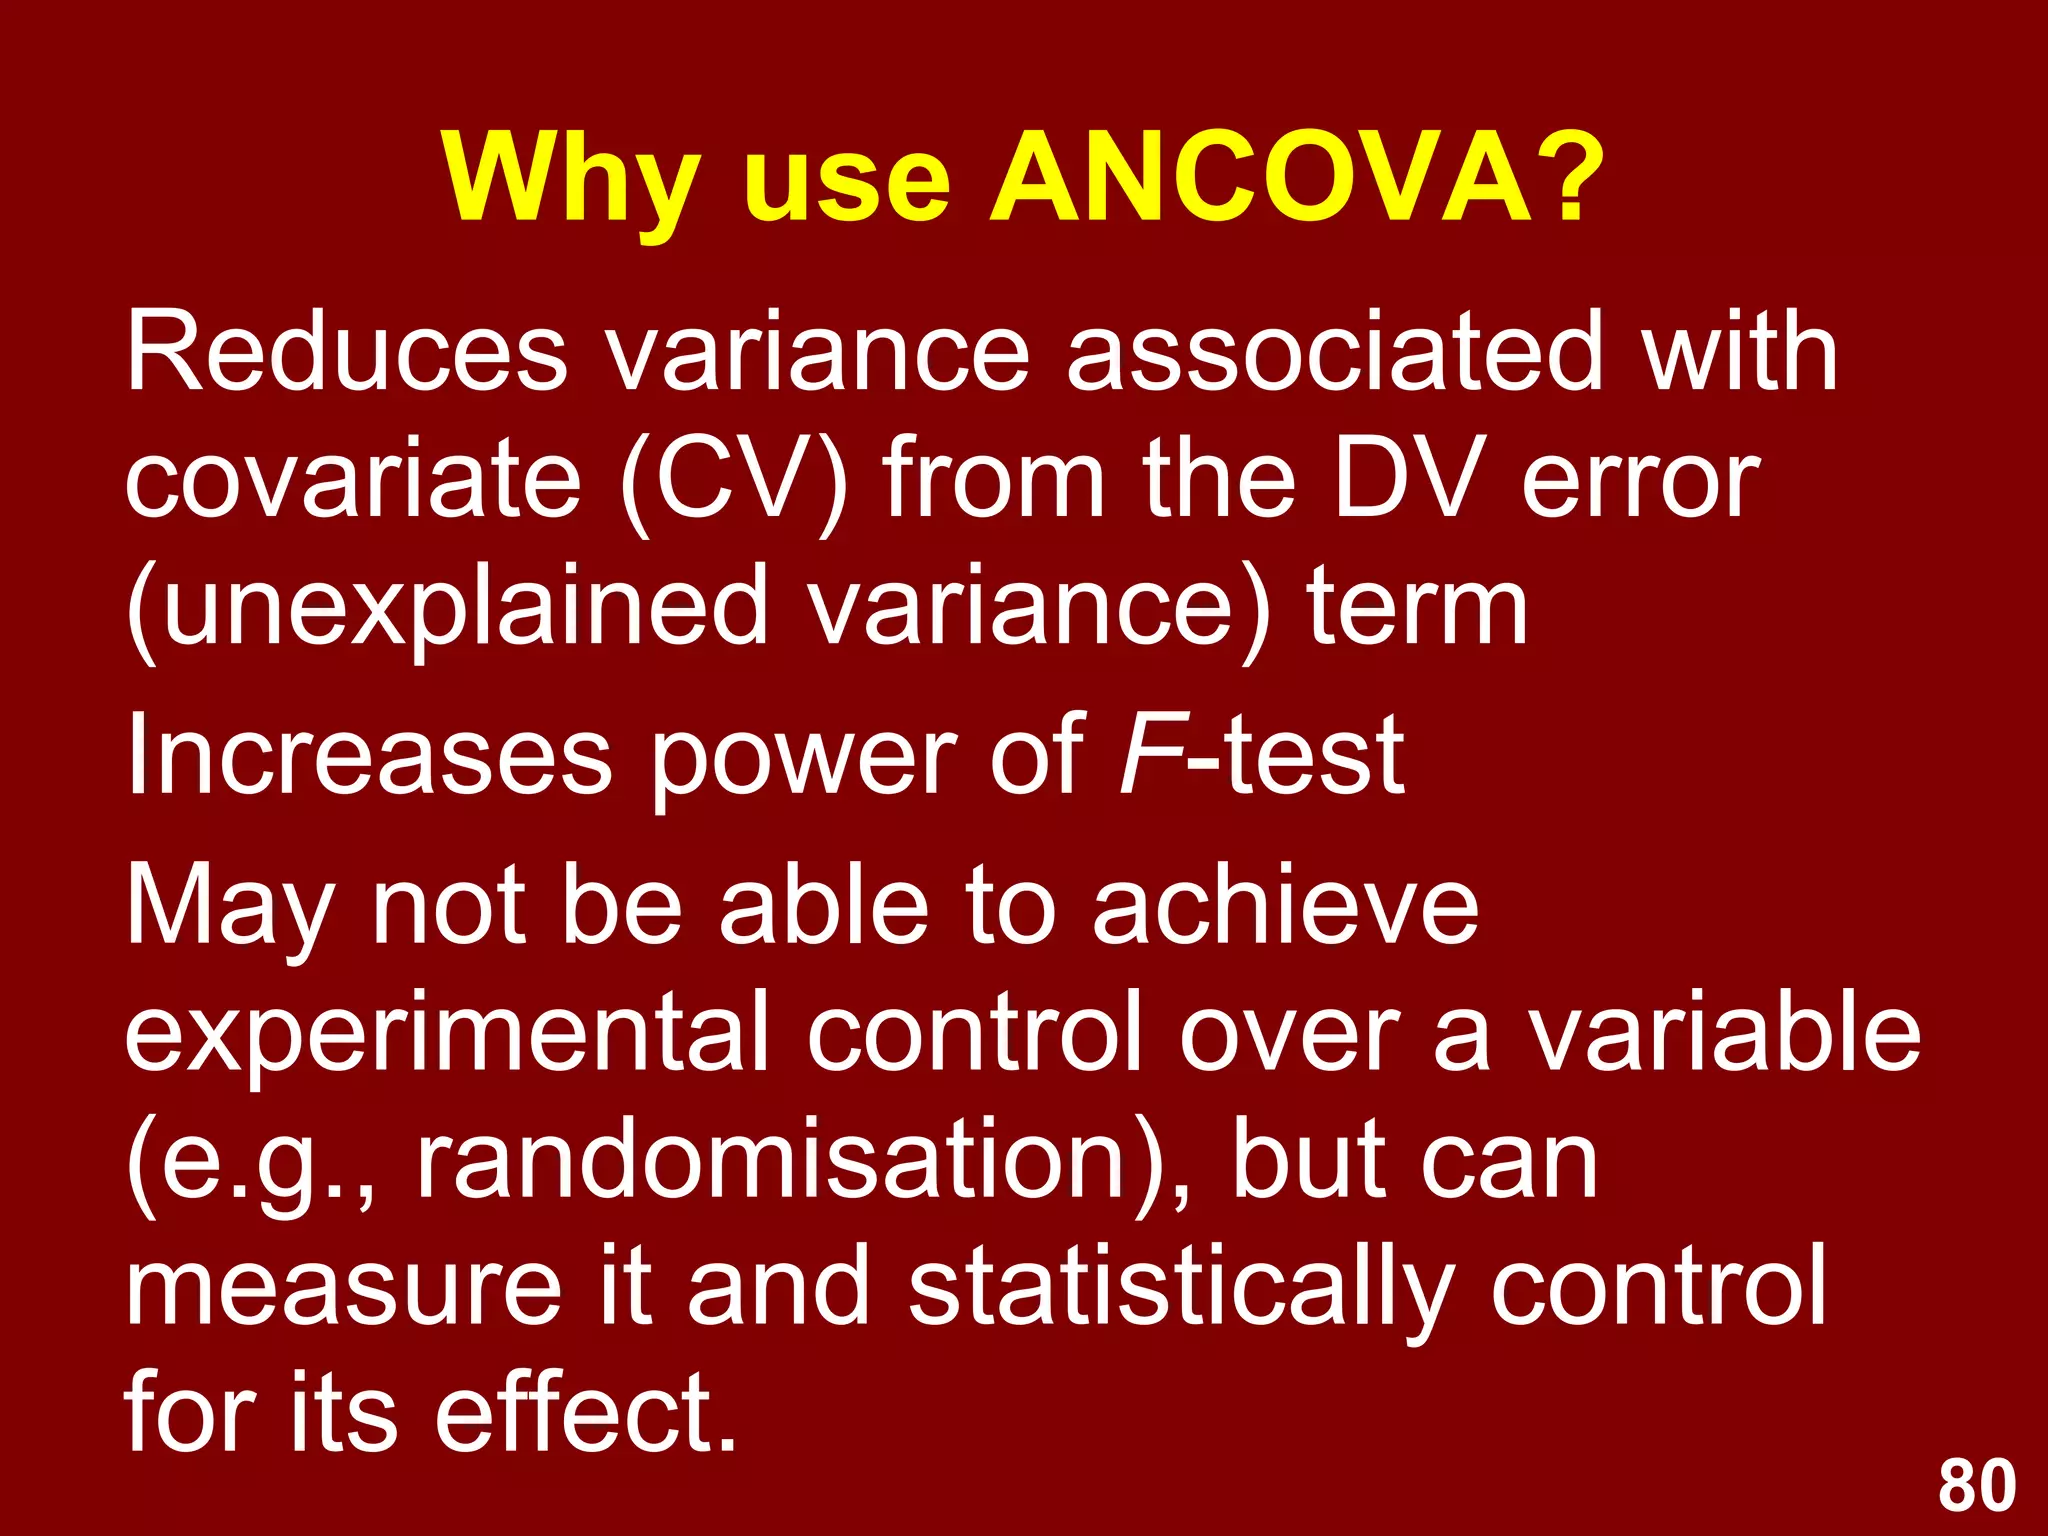
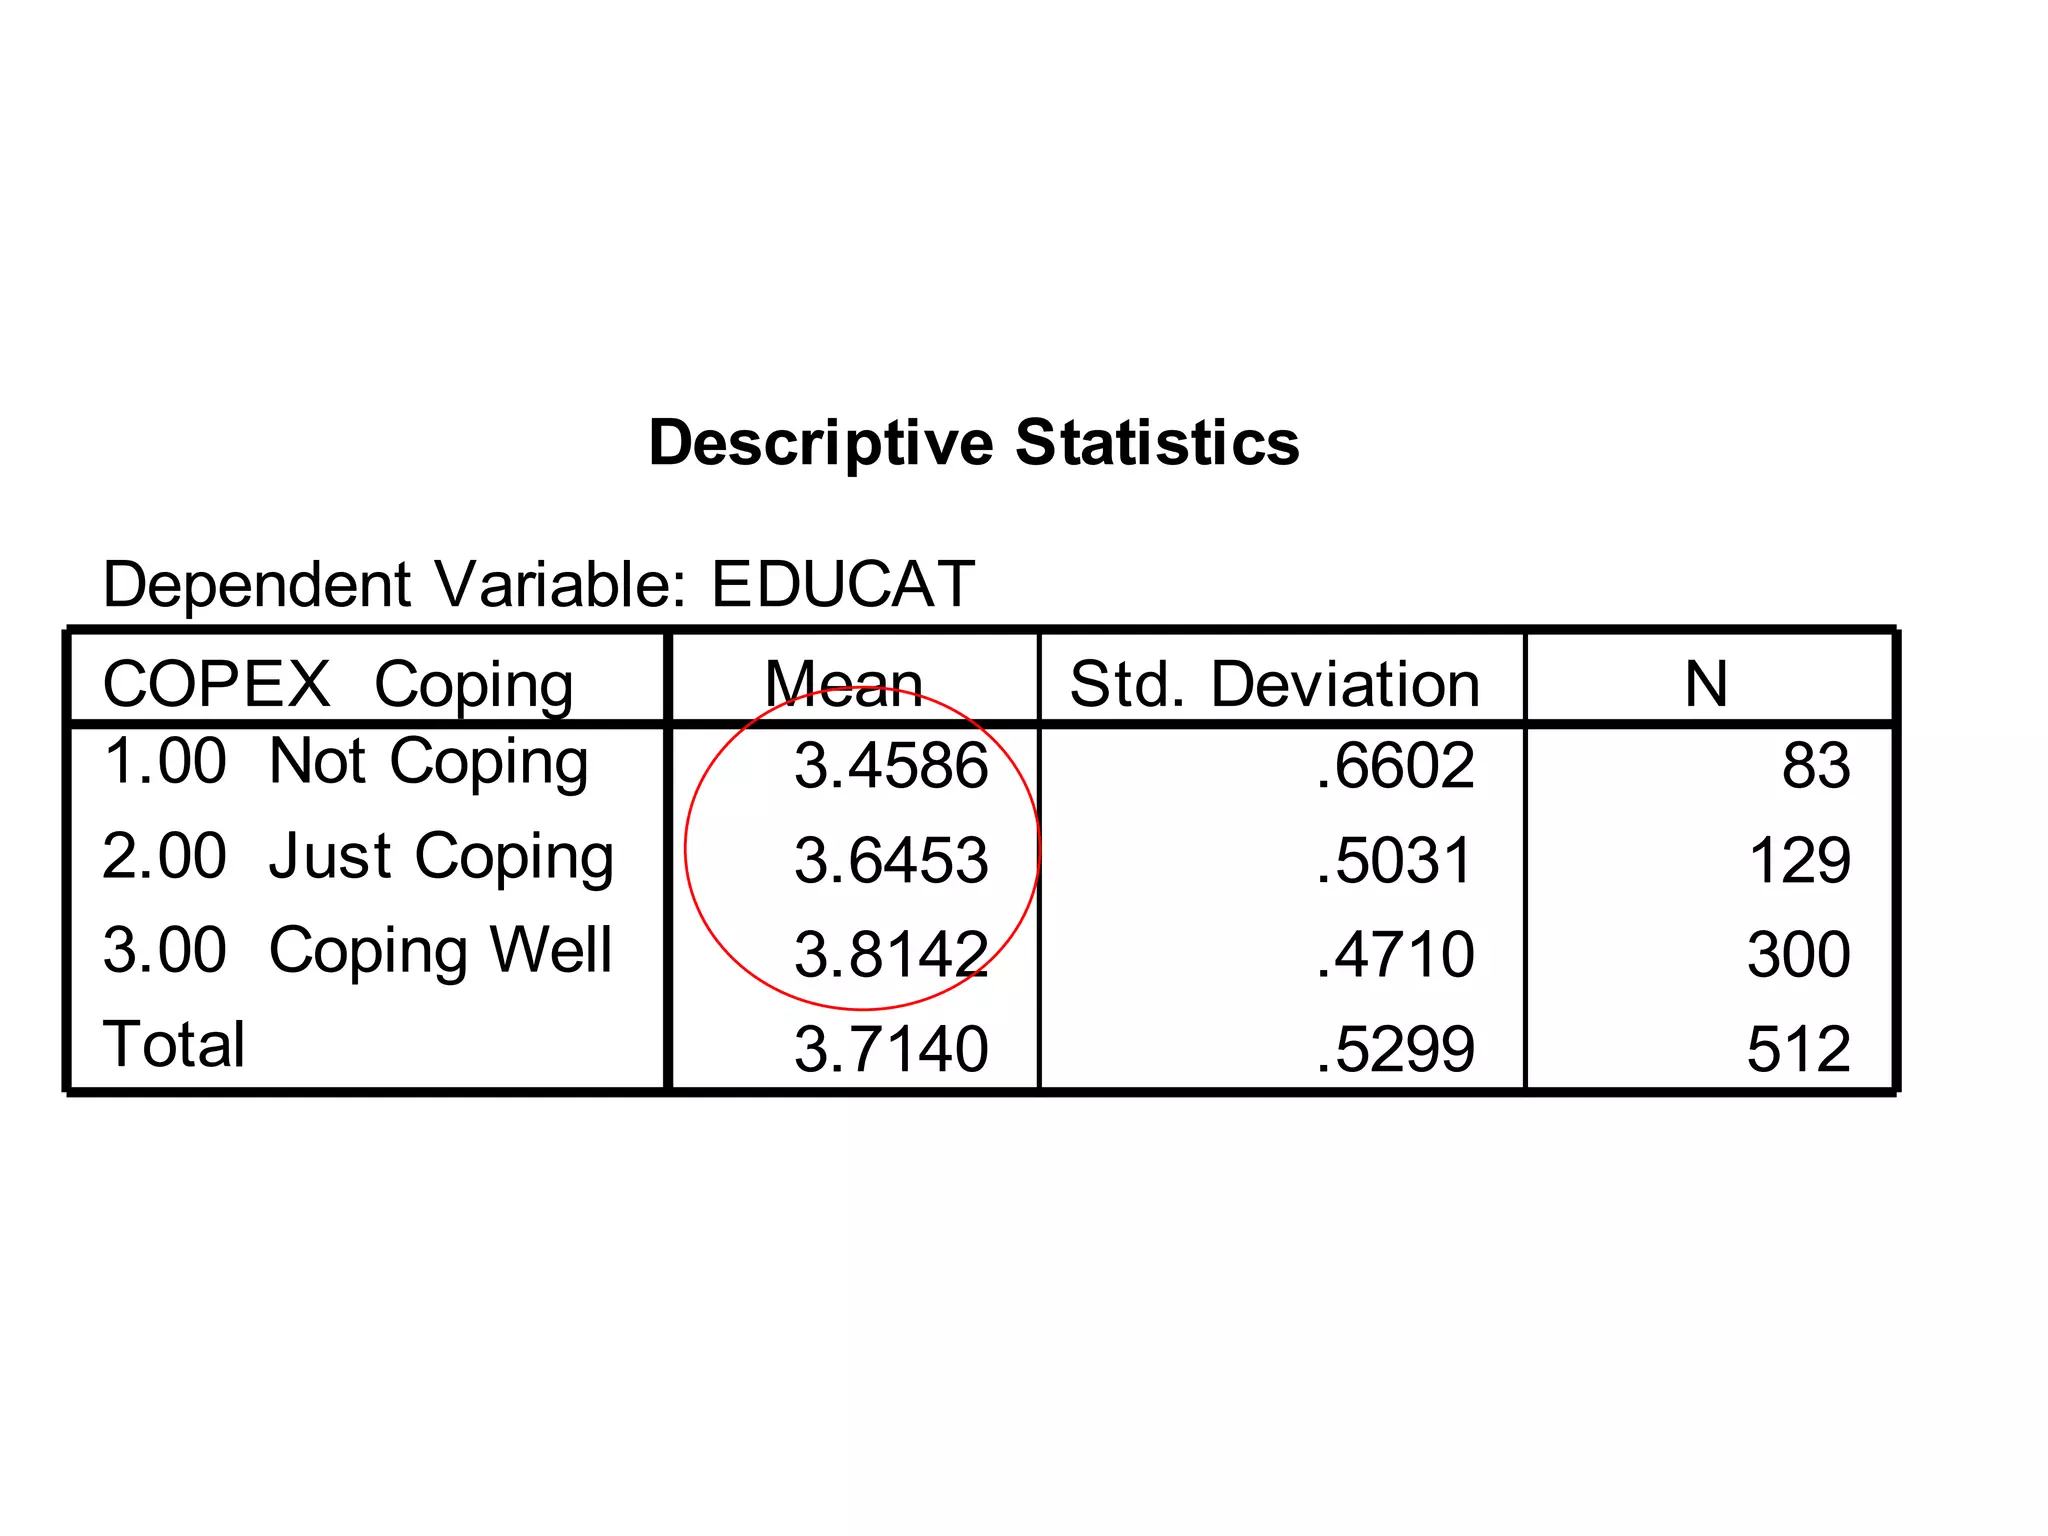
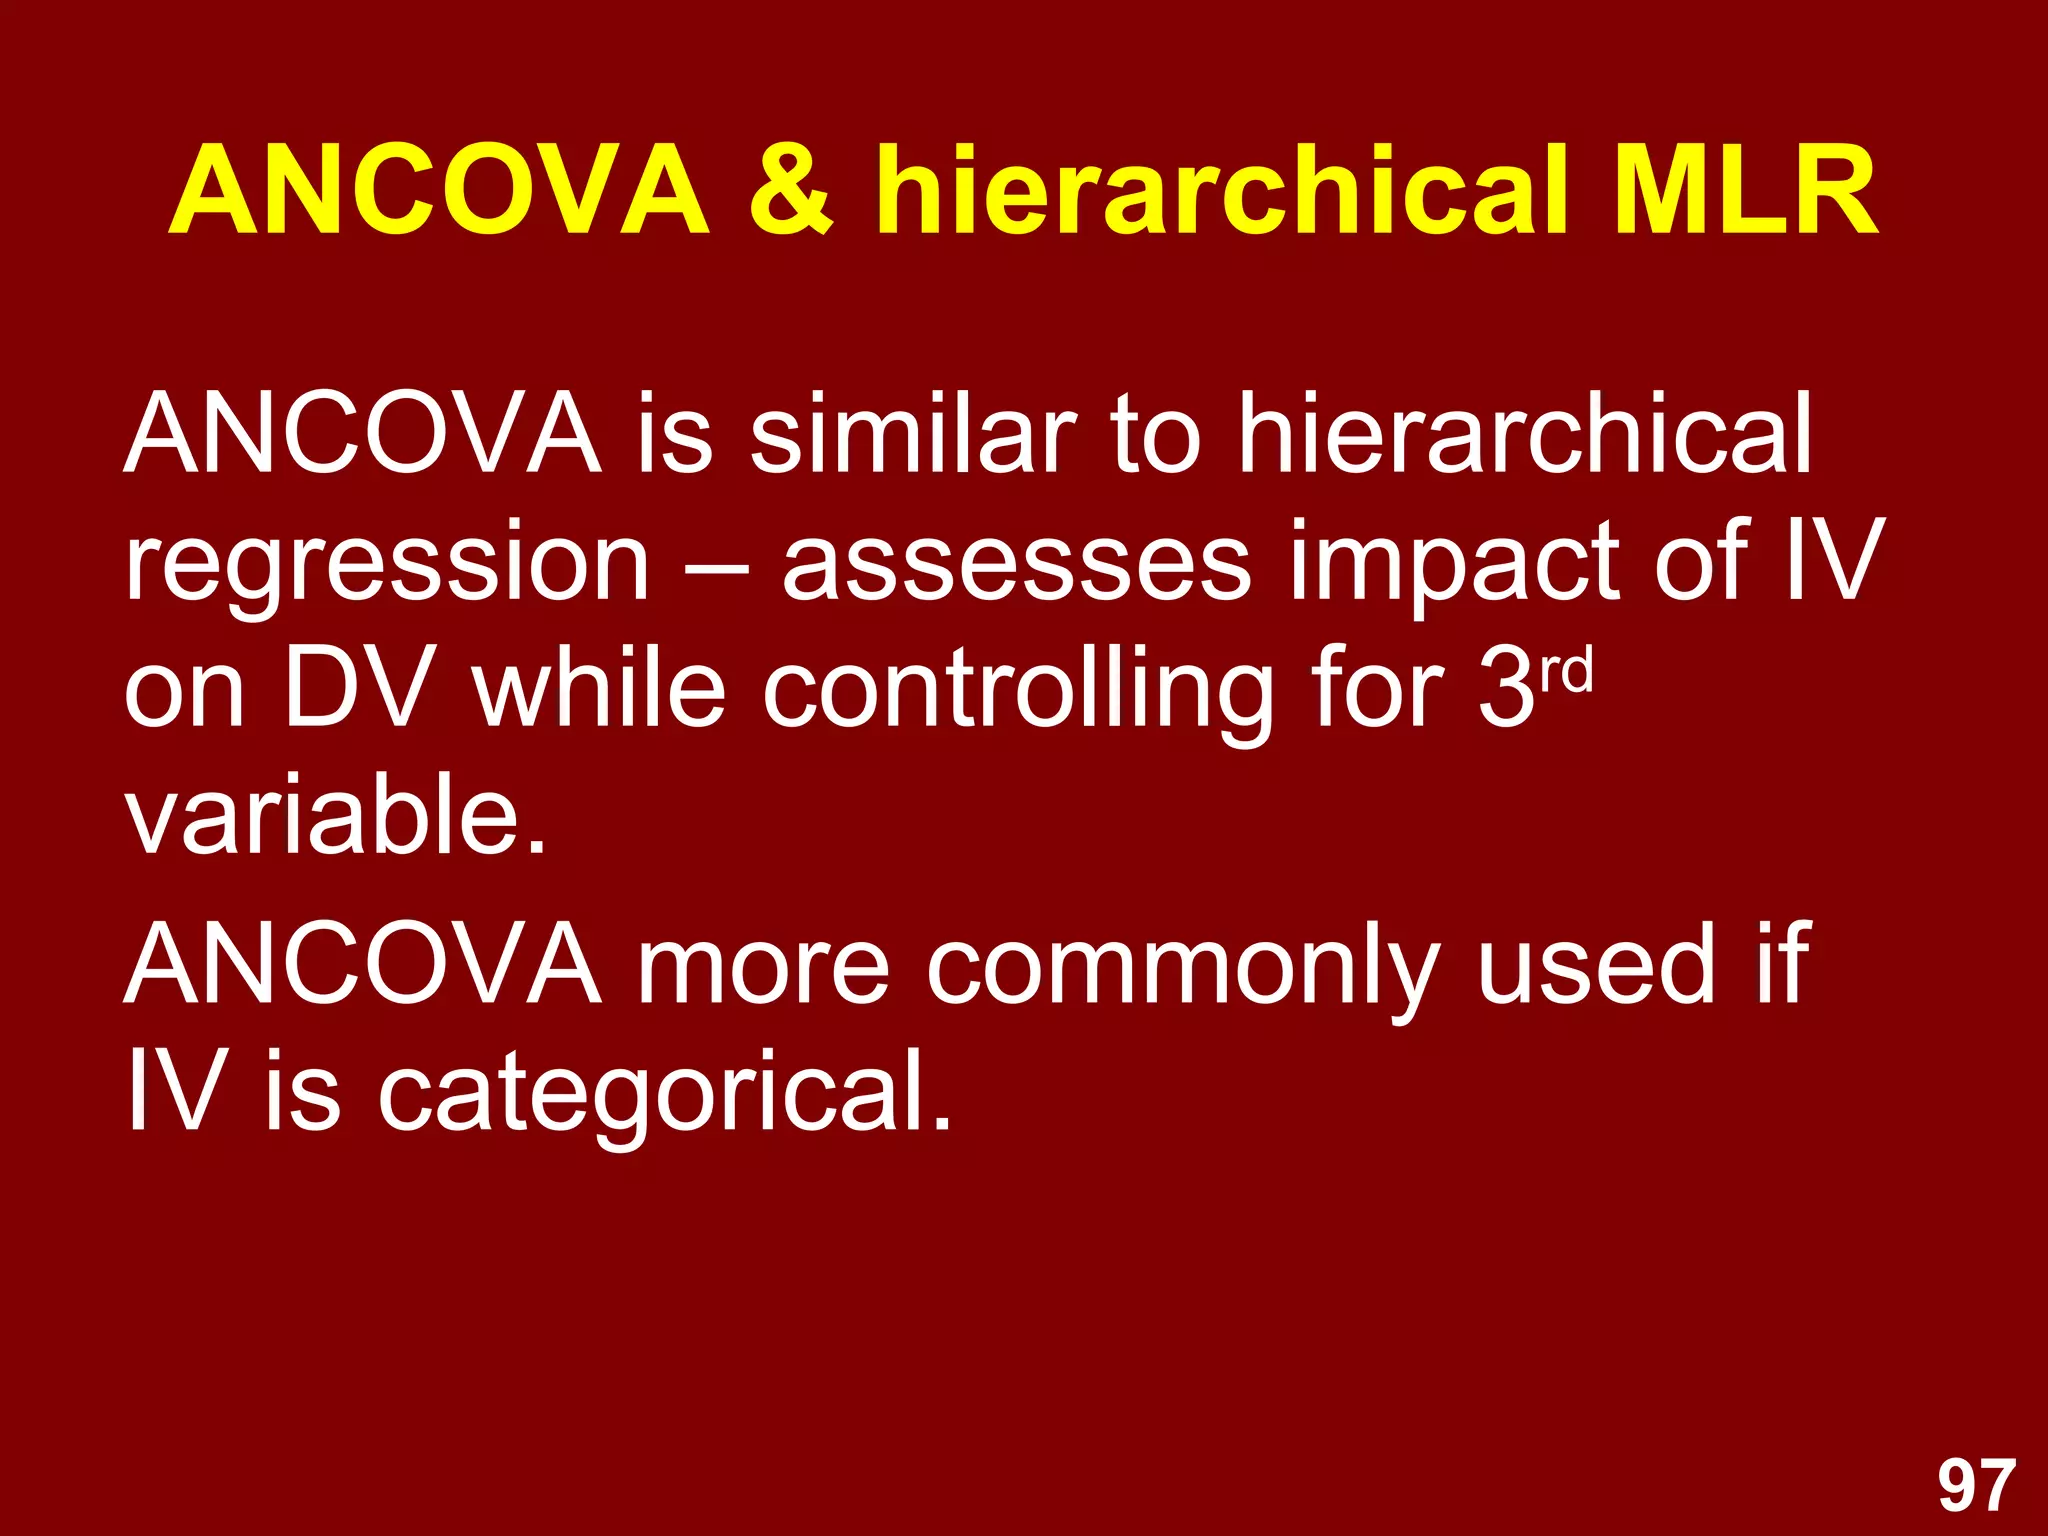
Analysis of covariance principles; how ANCOVA controls for covariates while assessing main and interaction effects.
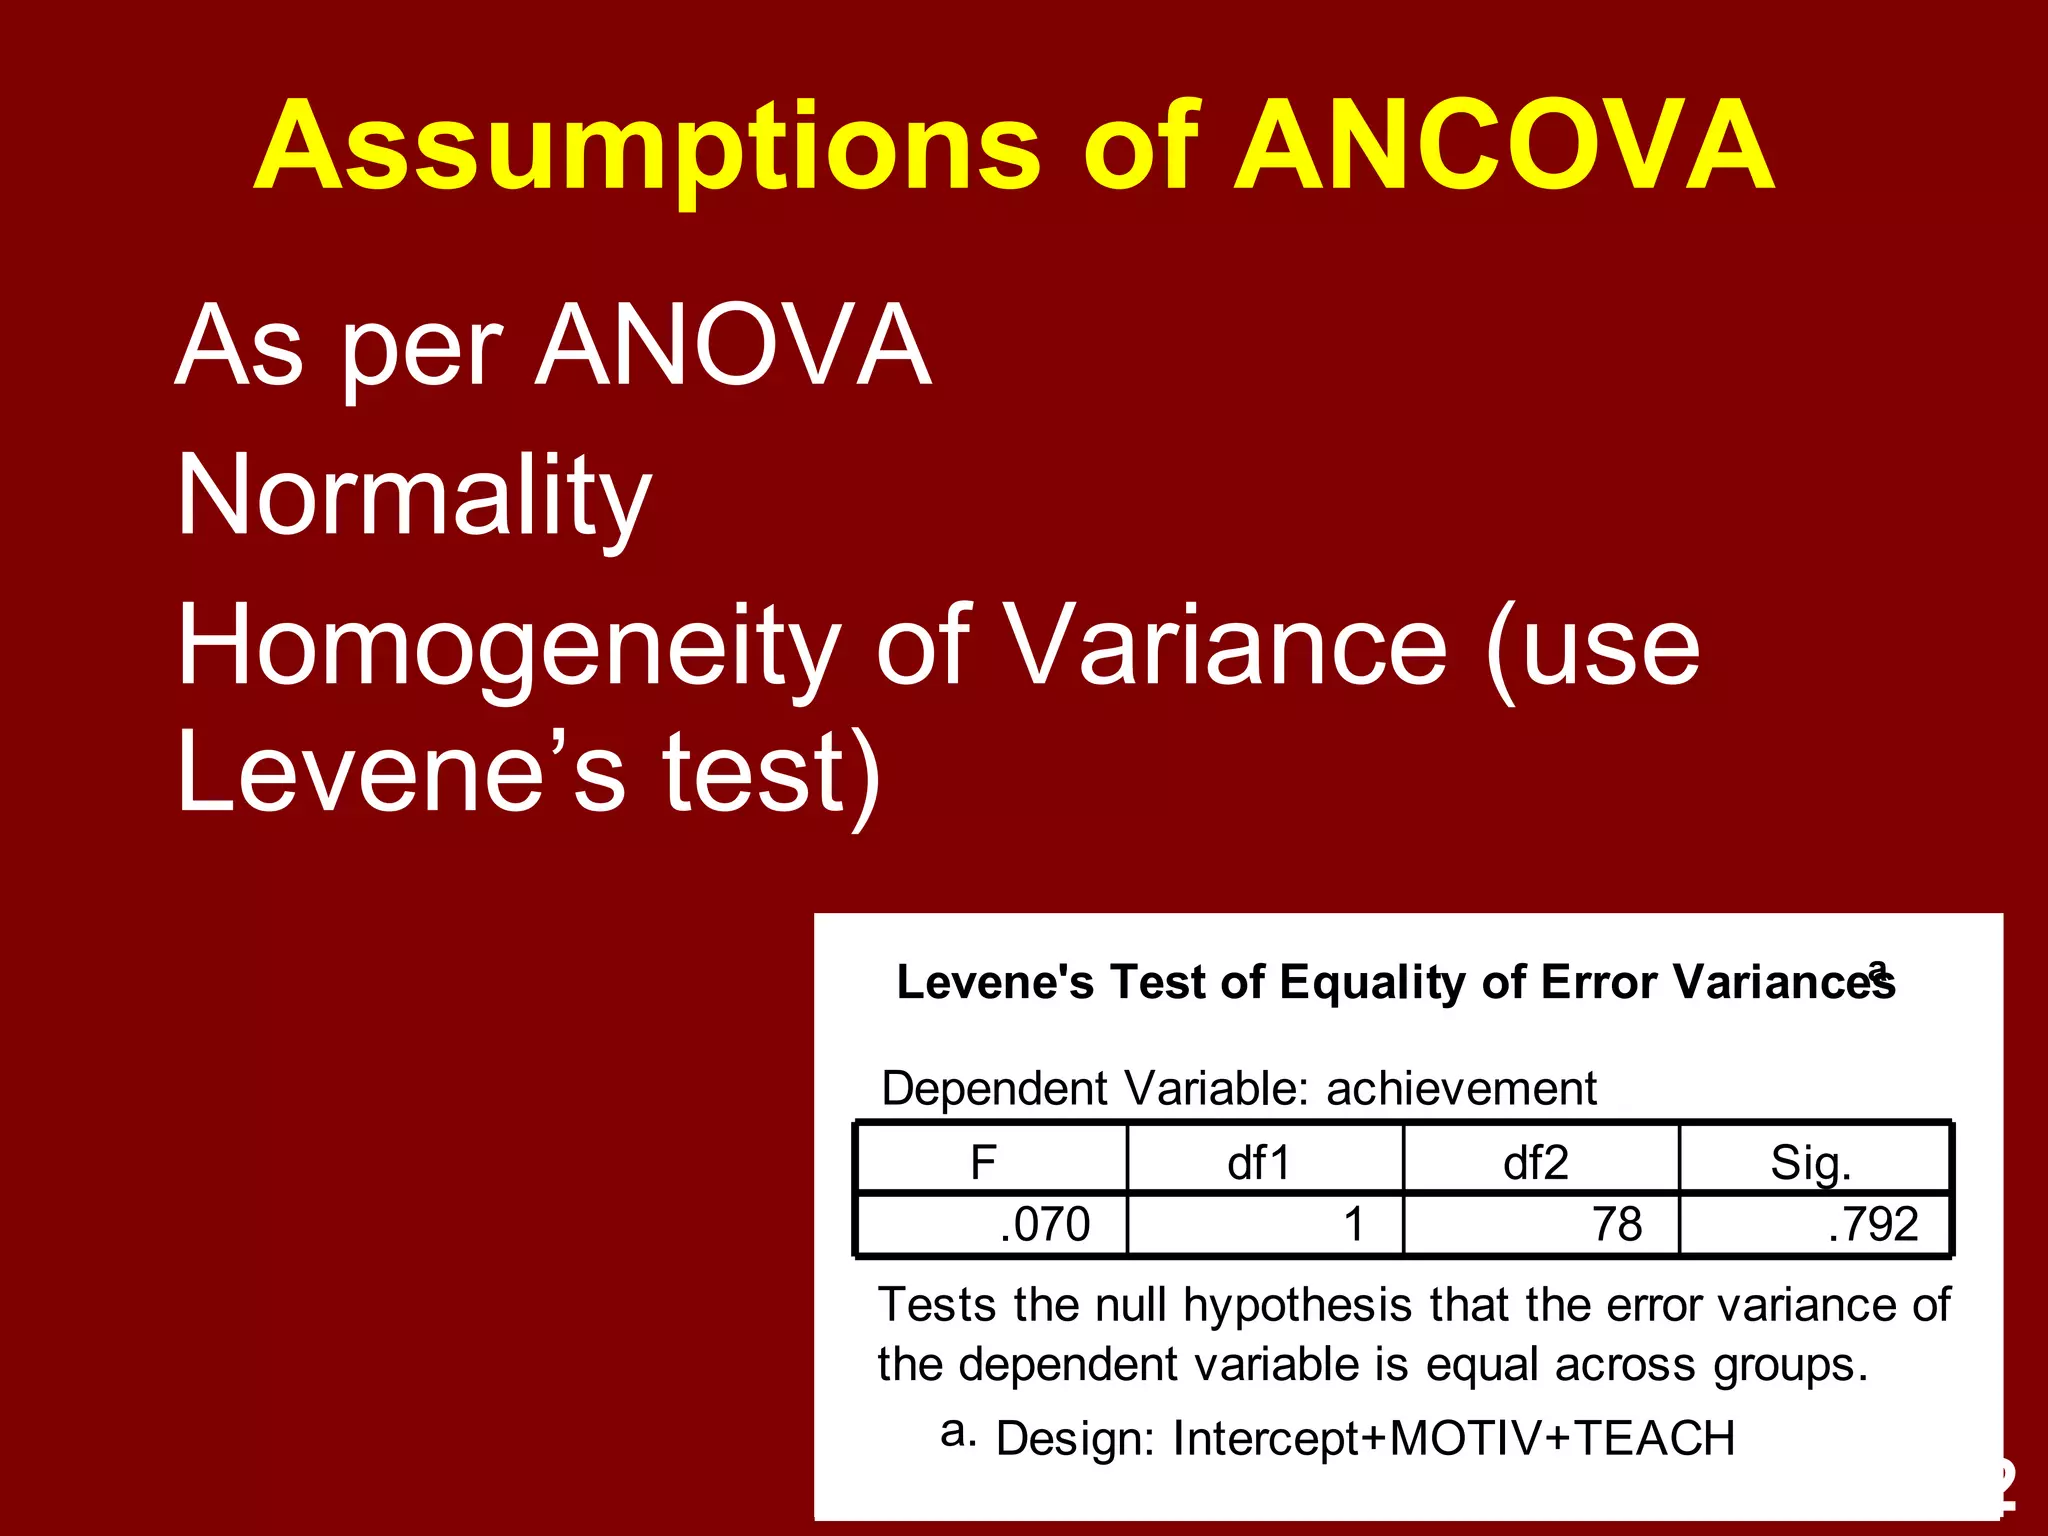
Practical examples of ANCOVA; hypothesis testing with covariates; importance of checking statistical assumptions.
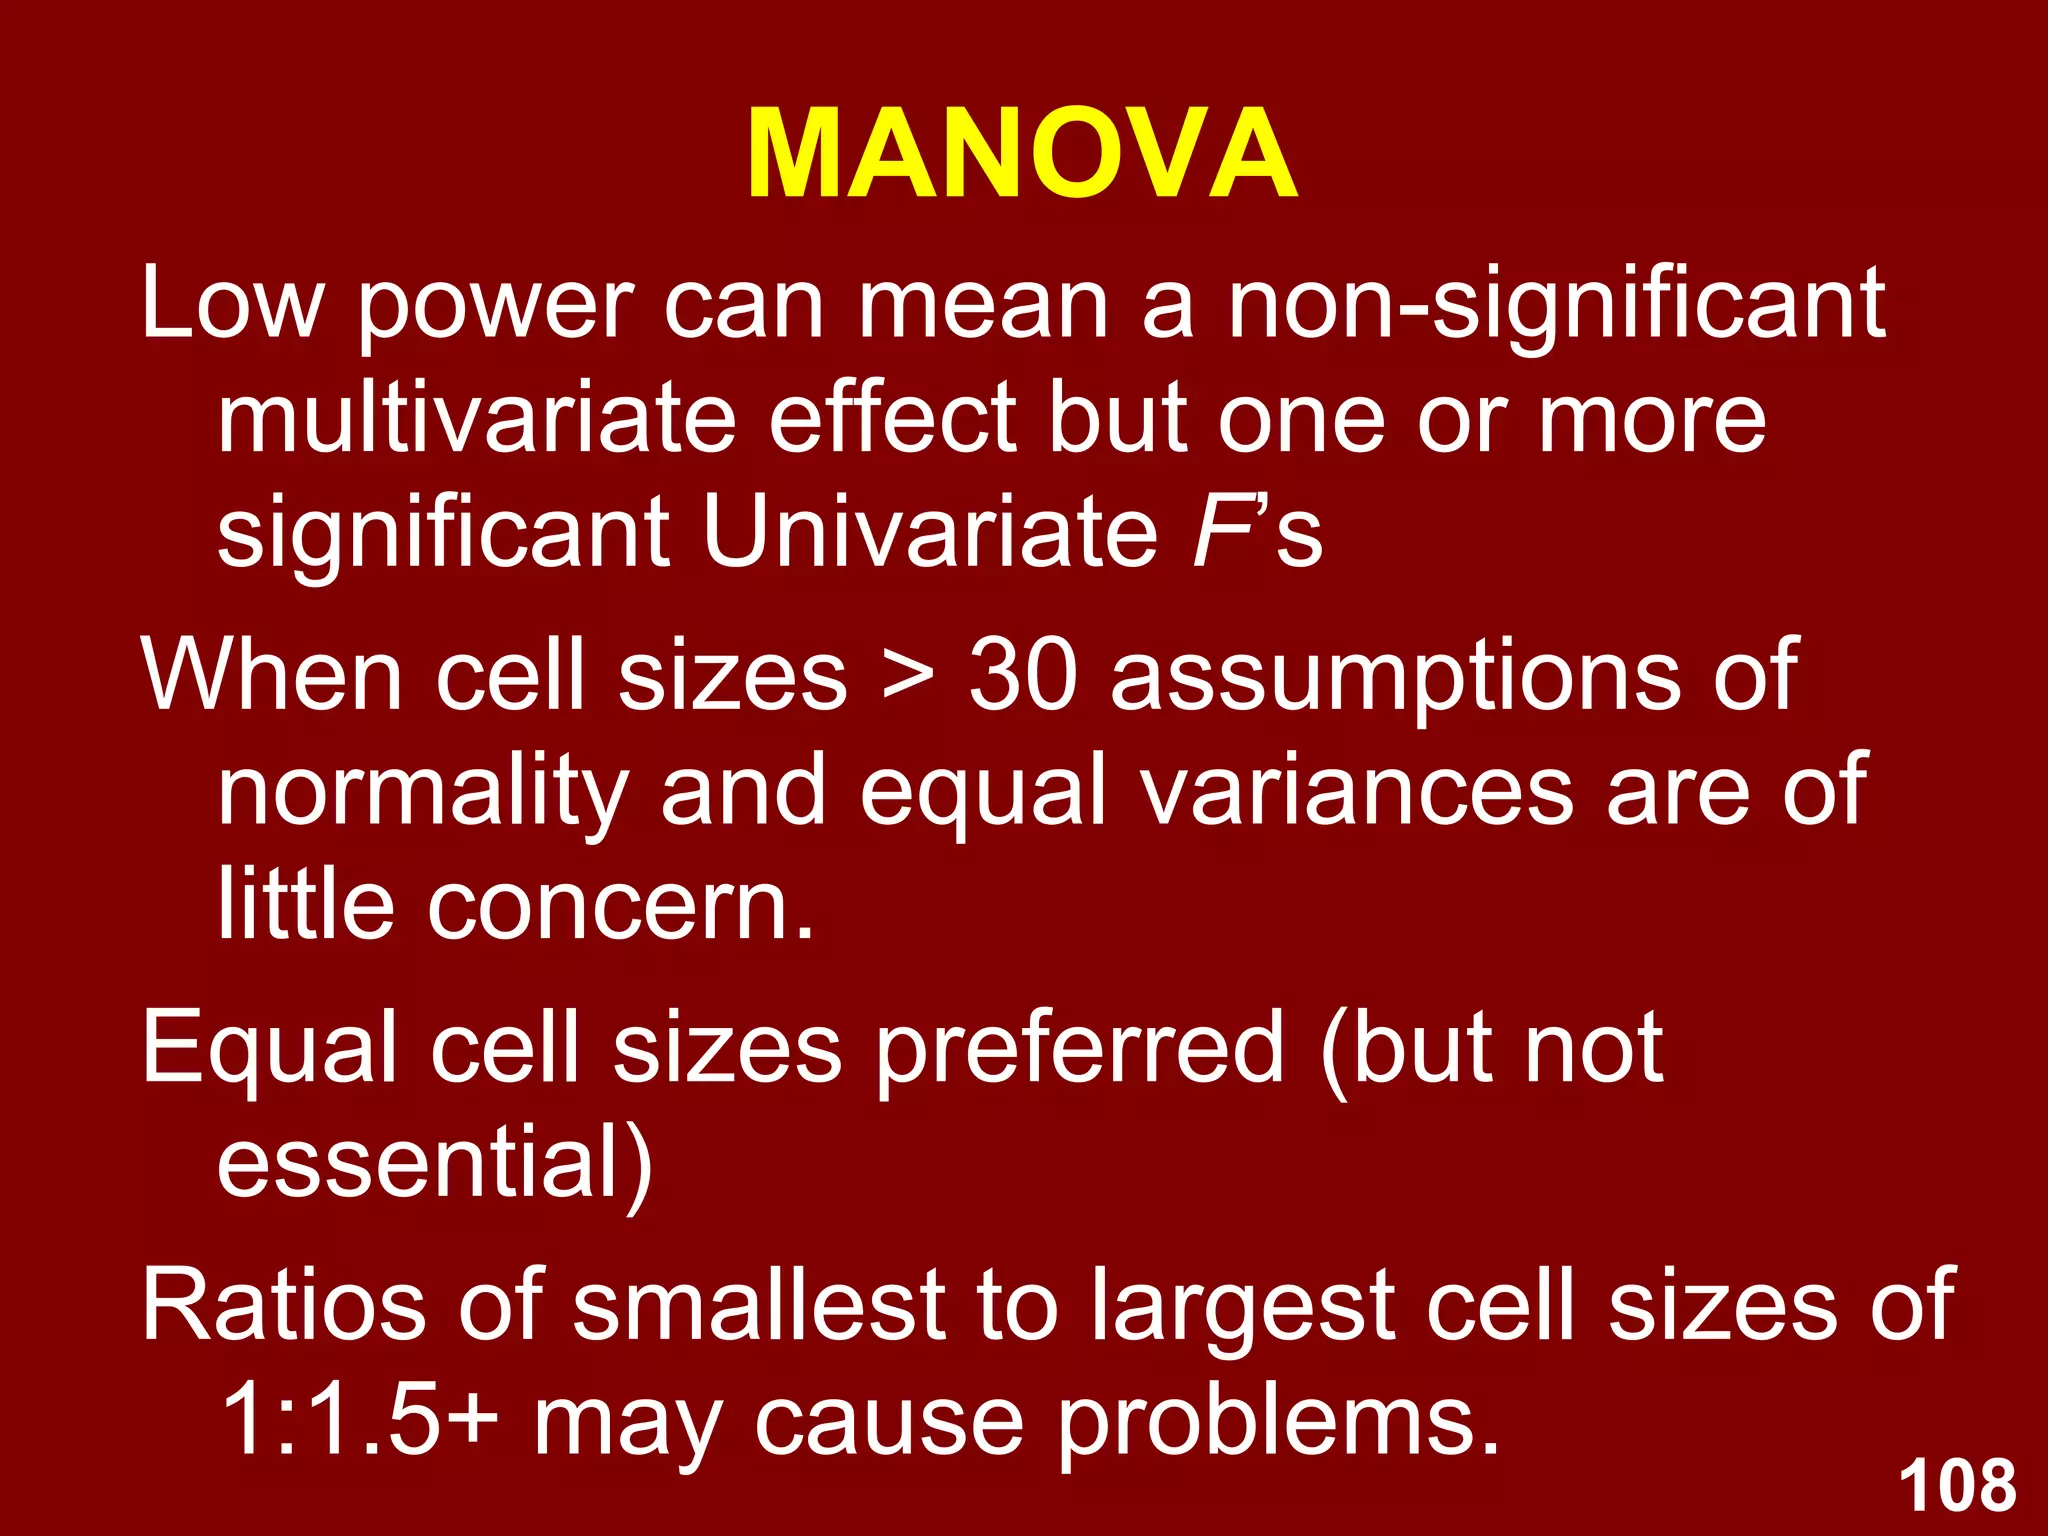
Multivariate ANOVA discusses multiple DVs; differences in means across groups; assumptions and effect sizes.
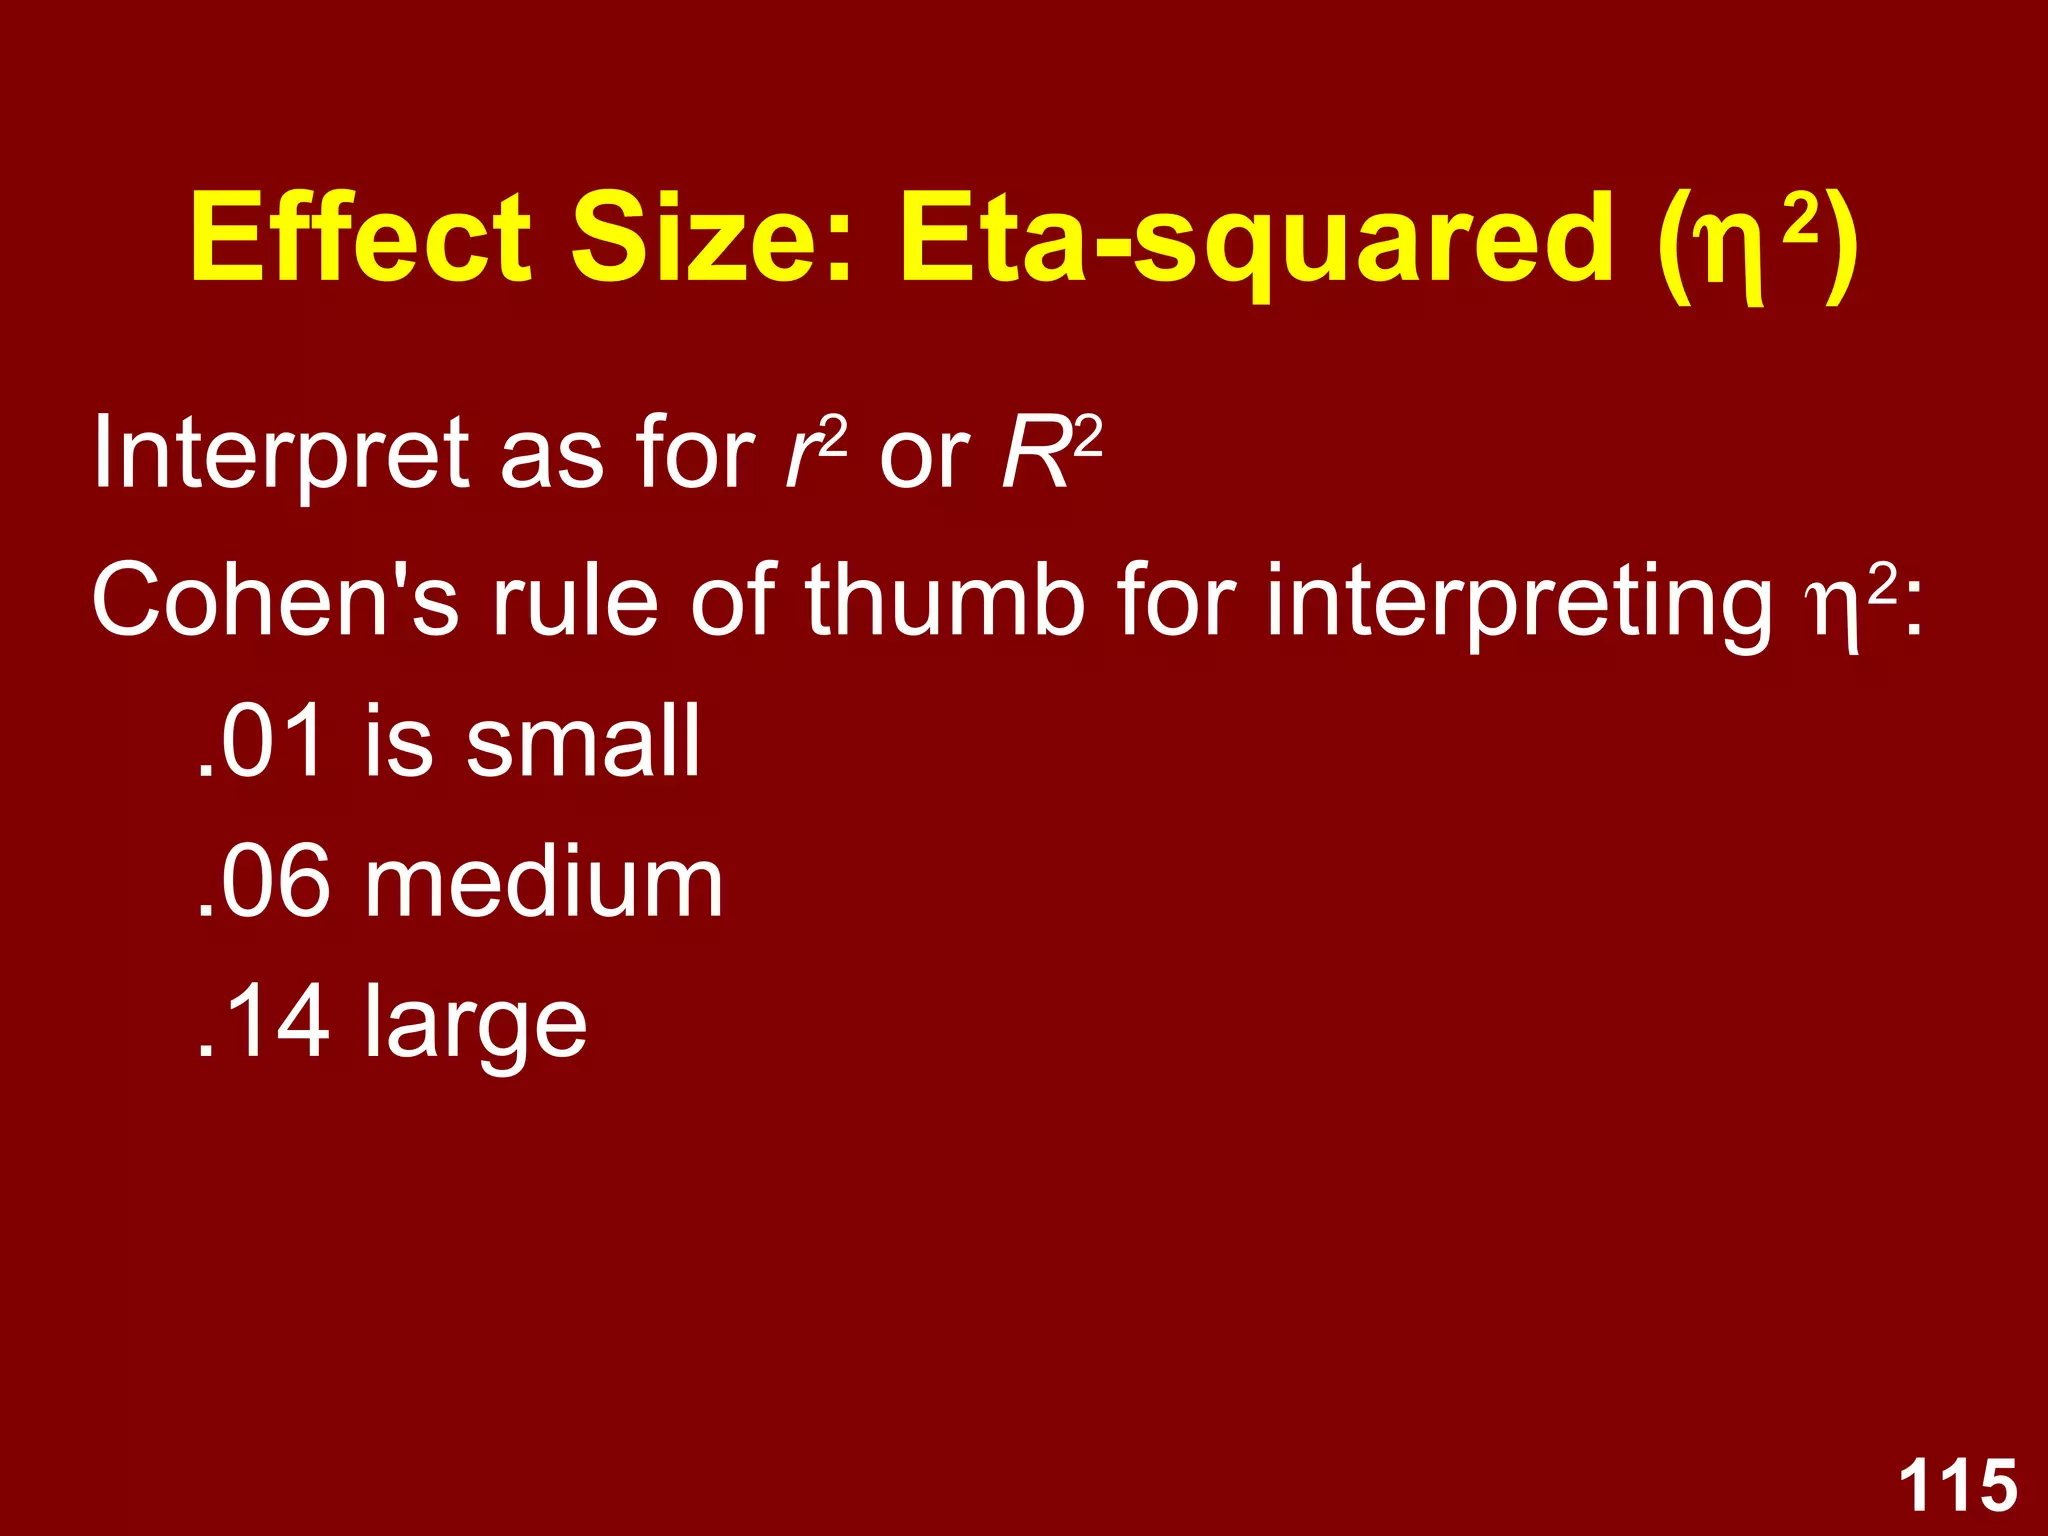
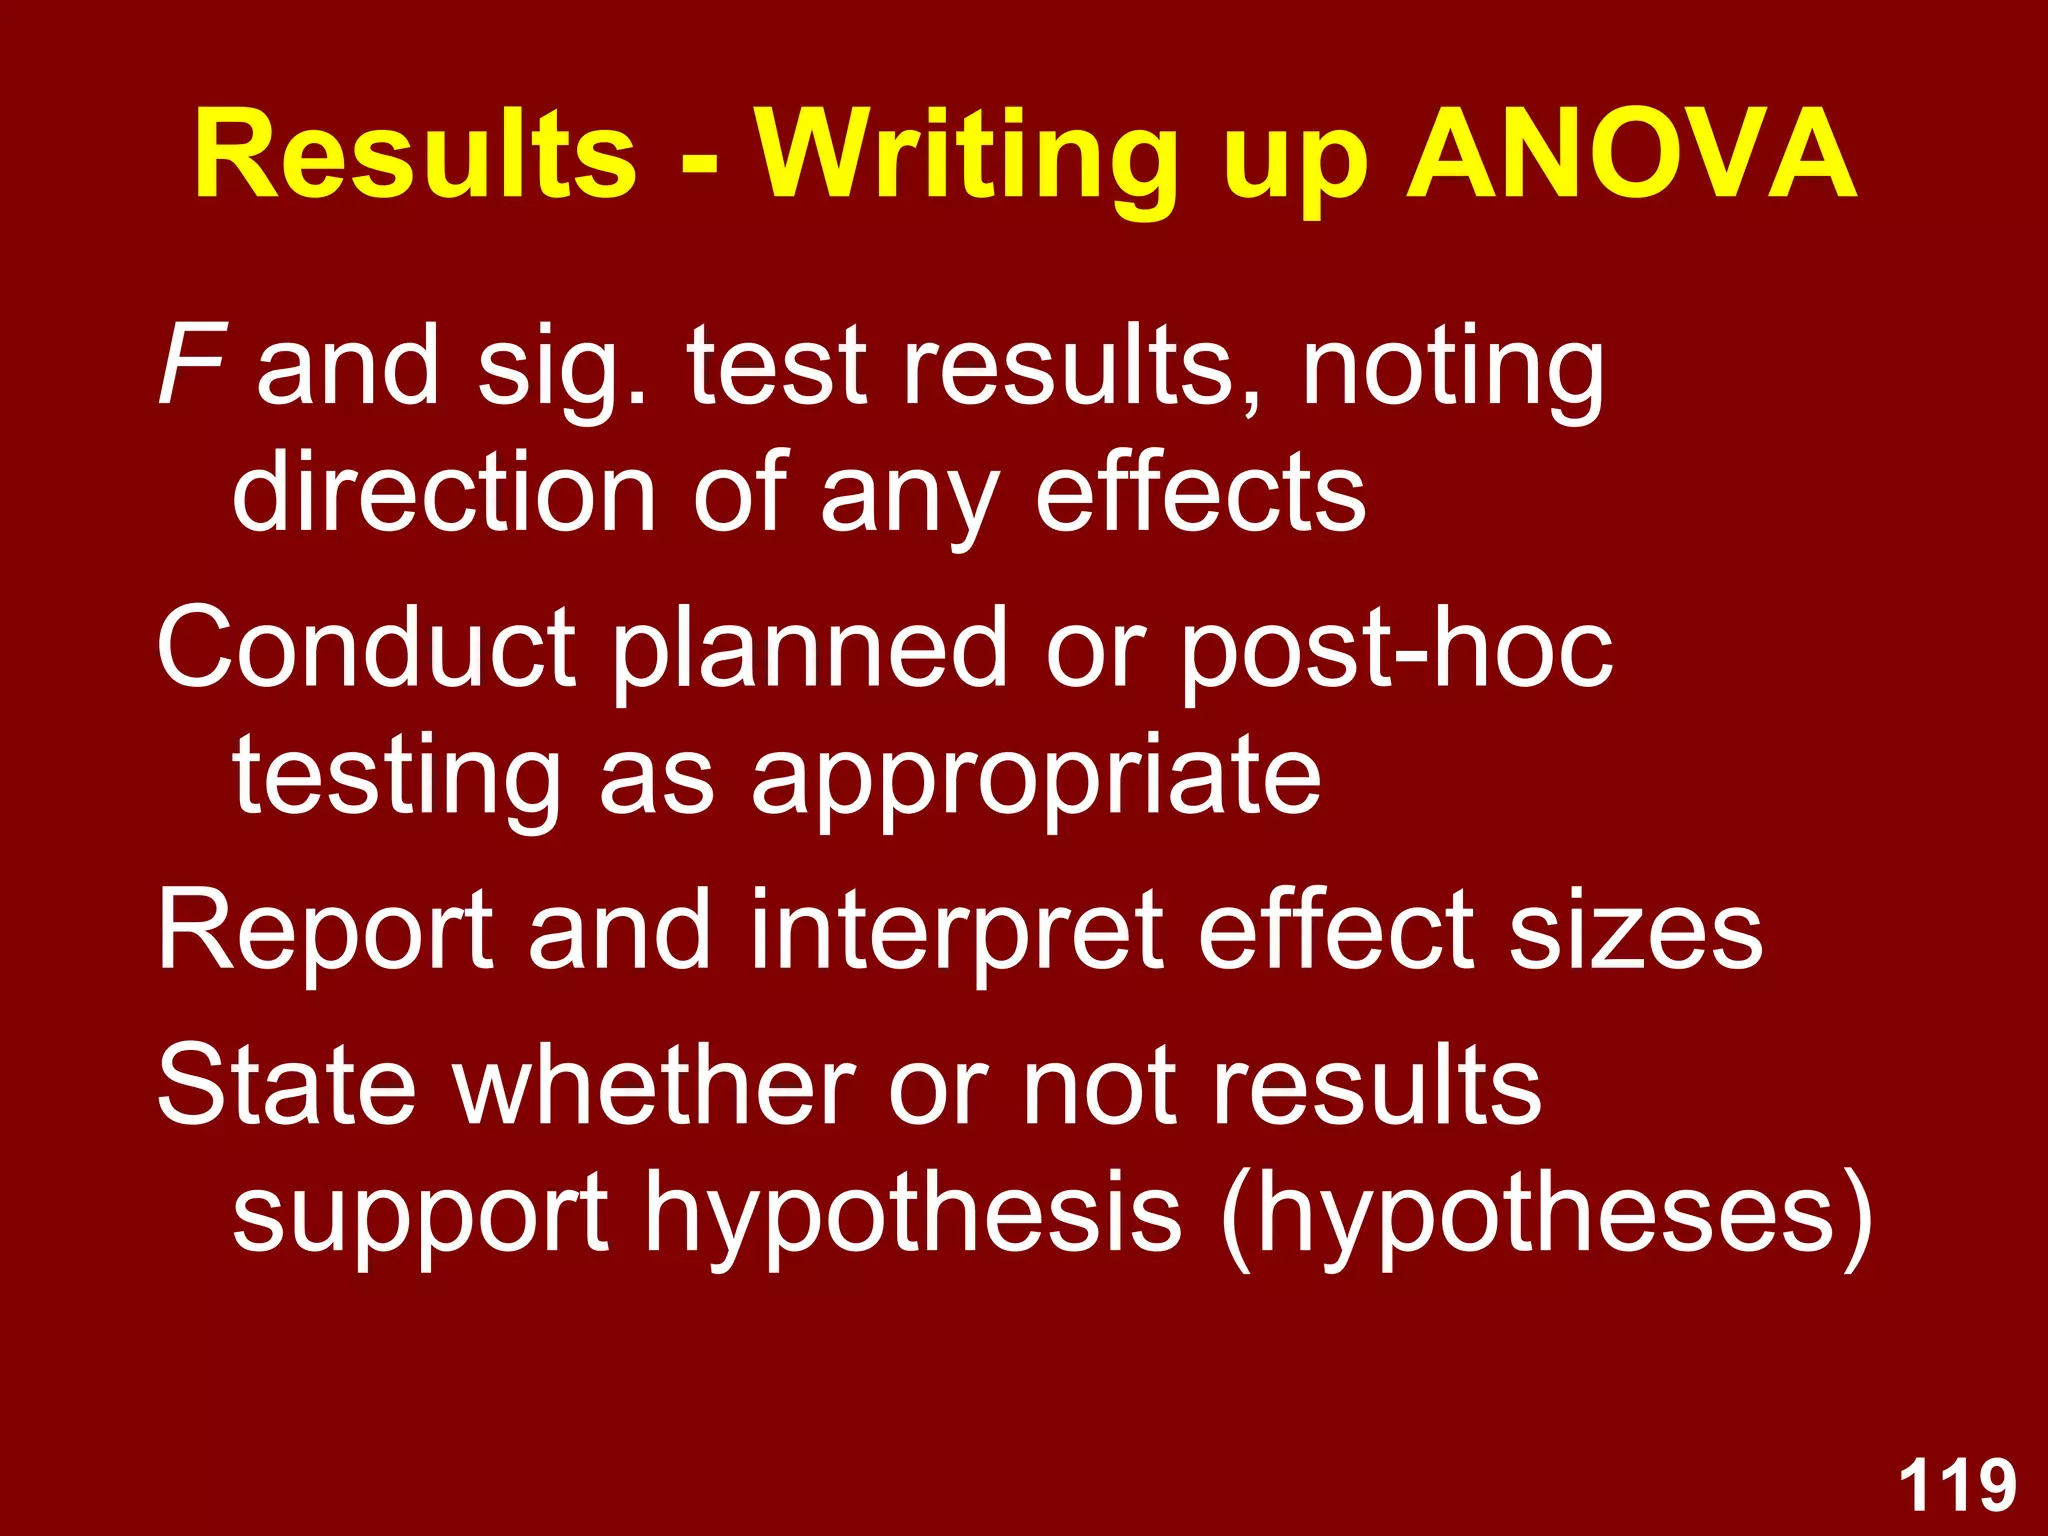
Guidelines on reporting ANOVA findings; importance of effect sizes and hypothesis clarity in survey research.


