Downloaded 1,631 times

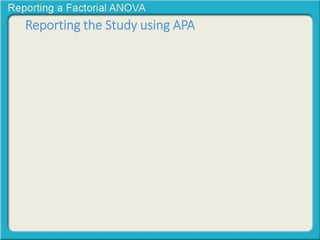

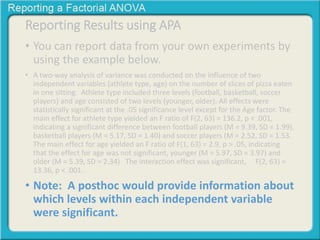
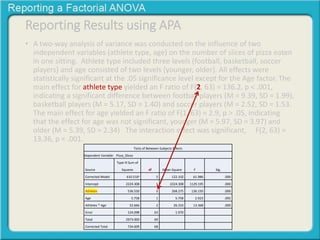
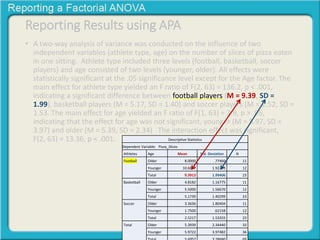
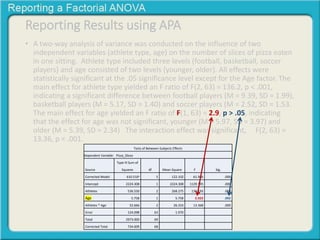
![Reporting the Study using APA
• You can report that you conducted a Factorial
ANOVA by using the template below.
• “A Factorial ANOVA was conducted to compare the
main effects of [name the main effects (IVs)] and
the interaction effect between (name the
interaction effect) on (dependent variable).”](https://image.slidesharecdn.com/reportingafactorialanova-140917111749-phpapp01/85/Reporting-a-Factorial-ANOVA-4-320.jpg)
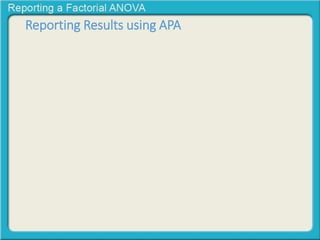
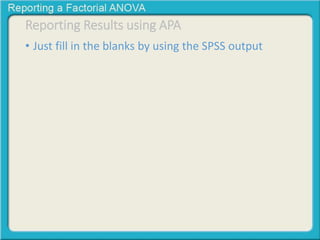
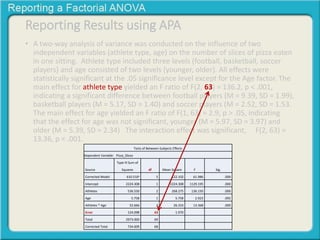
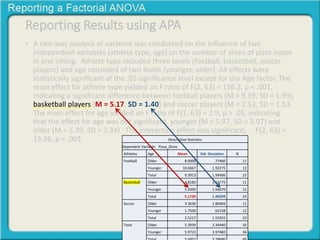
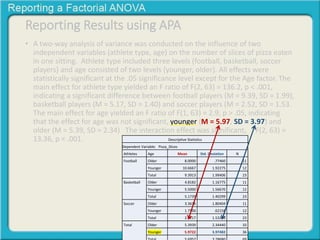
![Reporting the Study using APA
• You can report that you conducted a Factorial
ANOVA by using the template below.
• “A Factorial ANOVA was conducted to compare the
main effects of [name the main effects (IVs)] and
the interaction effect between (name the
interaction effect) on (dependent variable).”
• Here is an example:](https://image.slidesharecdn.com/reportingafactorialanova-140917111749-phpapp01/85/Reporting-a-Factorial-ANOVA-5-320.jpg)
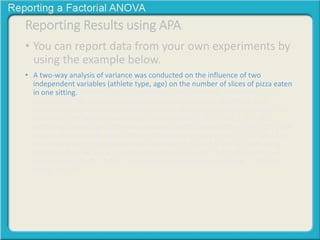
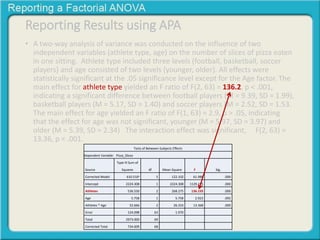
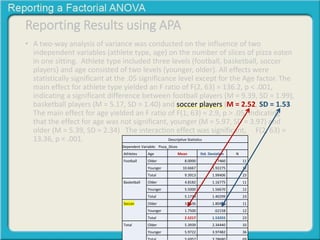
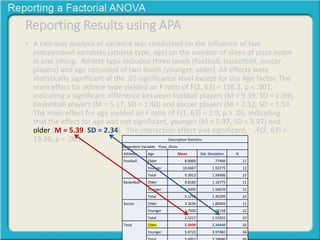
![Reporting the Study using APA
• You can report that you conducted a Factorial
ANOVA by using the template below.
• “A Factorial ANOVA was conducted to compare the
main effects of [name the main effects (IVs)] and
the interaction effect between (name the
interaction effect) on (dependent variable).”
• Here is an example:
• “A Factorial ANOVA was conducted to compare
the main effects of type of athlete and age and the
interaction effect between type of athlete and age
on the number of slices of Pizza eaten in one
sitting.”](https://image.slidesharecdn.com/reportingafactorialanova-140917111749-phpapp01/85/Reporting-a-Factorial-ANOVA-6-320.jpg)

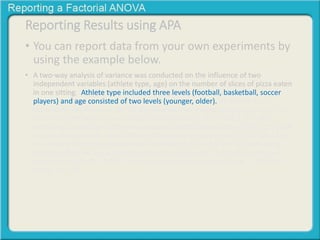
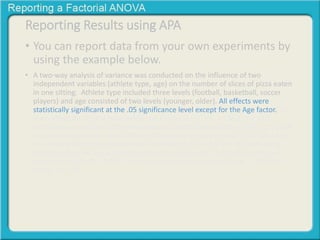
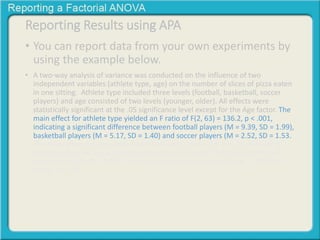
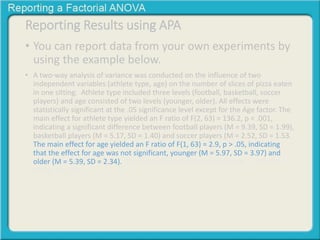

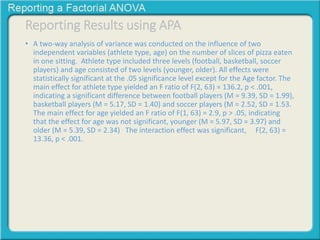
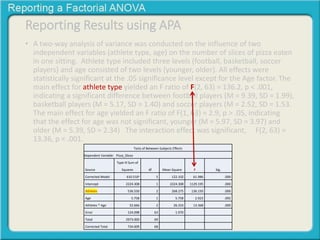
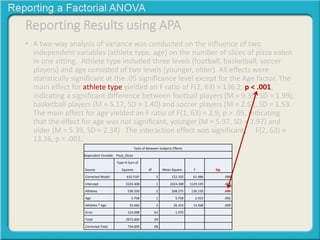
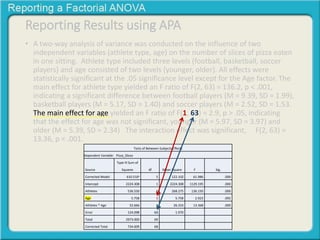
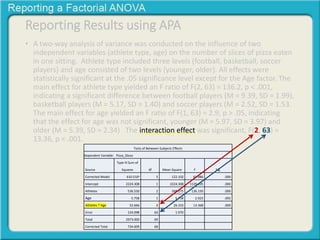
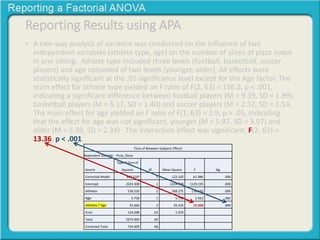

A two-way ANOVA was conducted to examine the effects of athlete type (football, basketball, soccer) and age (younger, older) on slices of pizza eaten. There were significant main effects of athlete type and an interaction between athlete type and age, but no main effect of age. Football players ate the most pizza, followed by basketball players and then soccer players.


