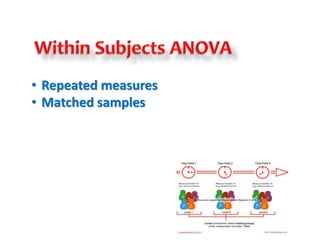
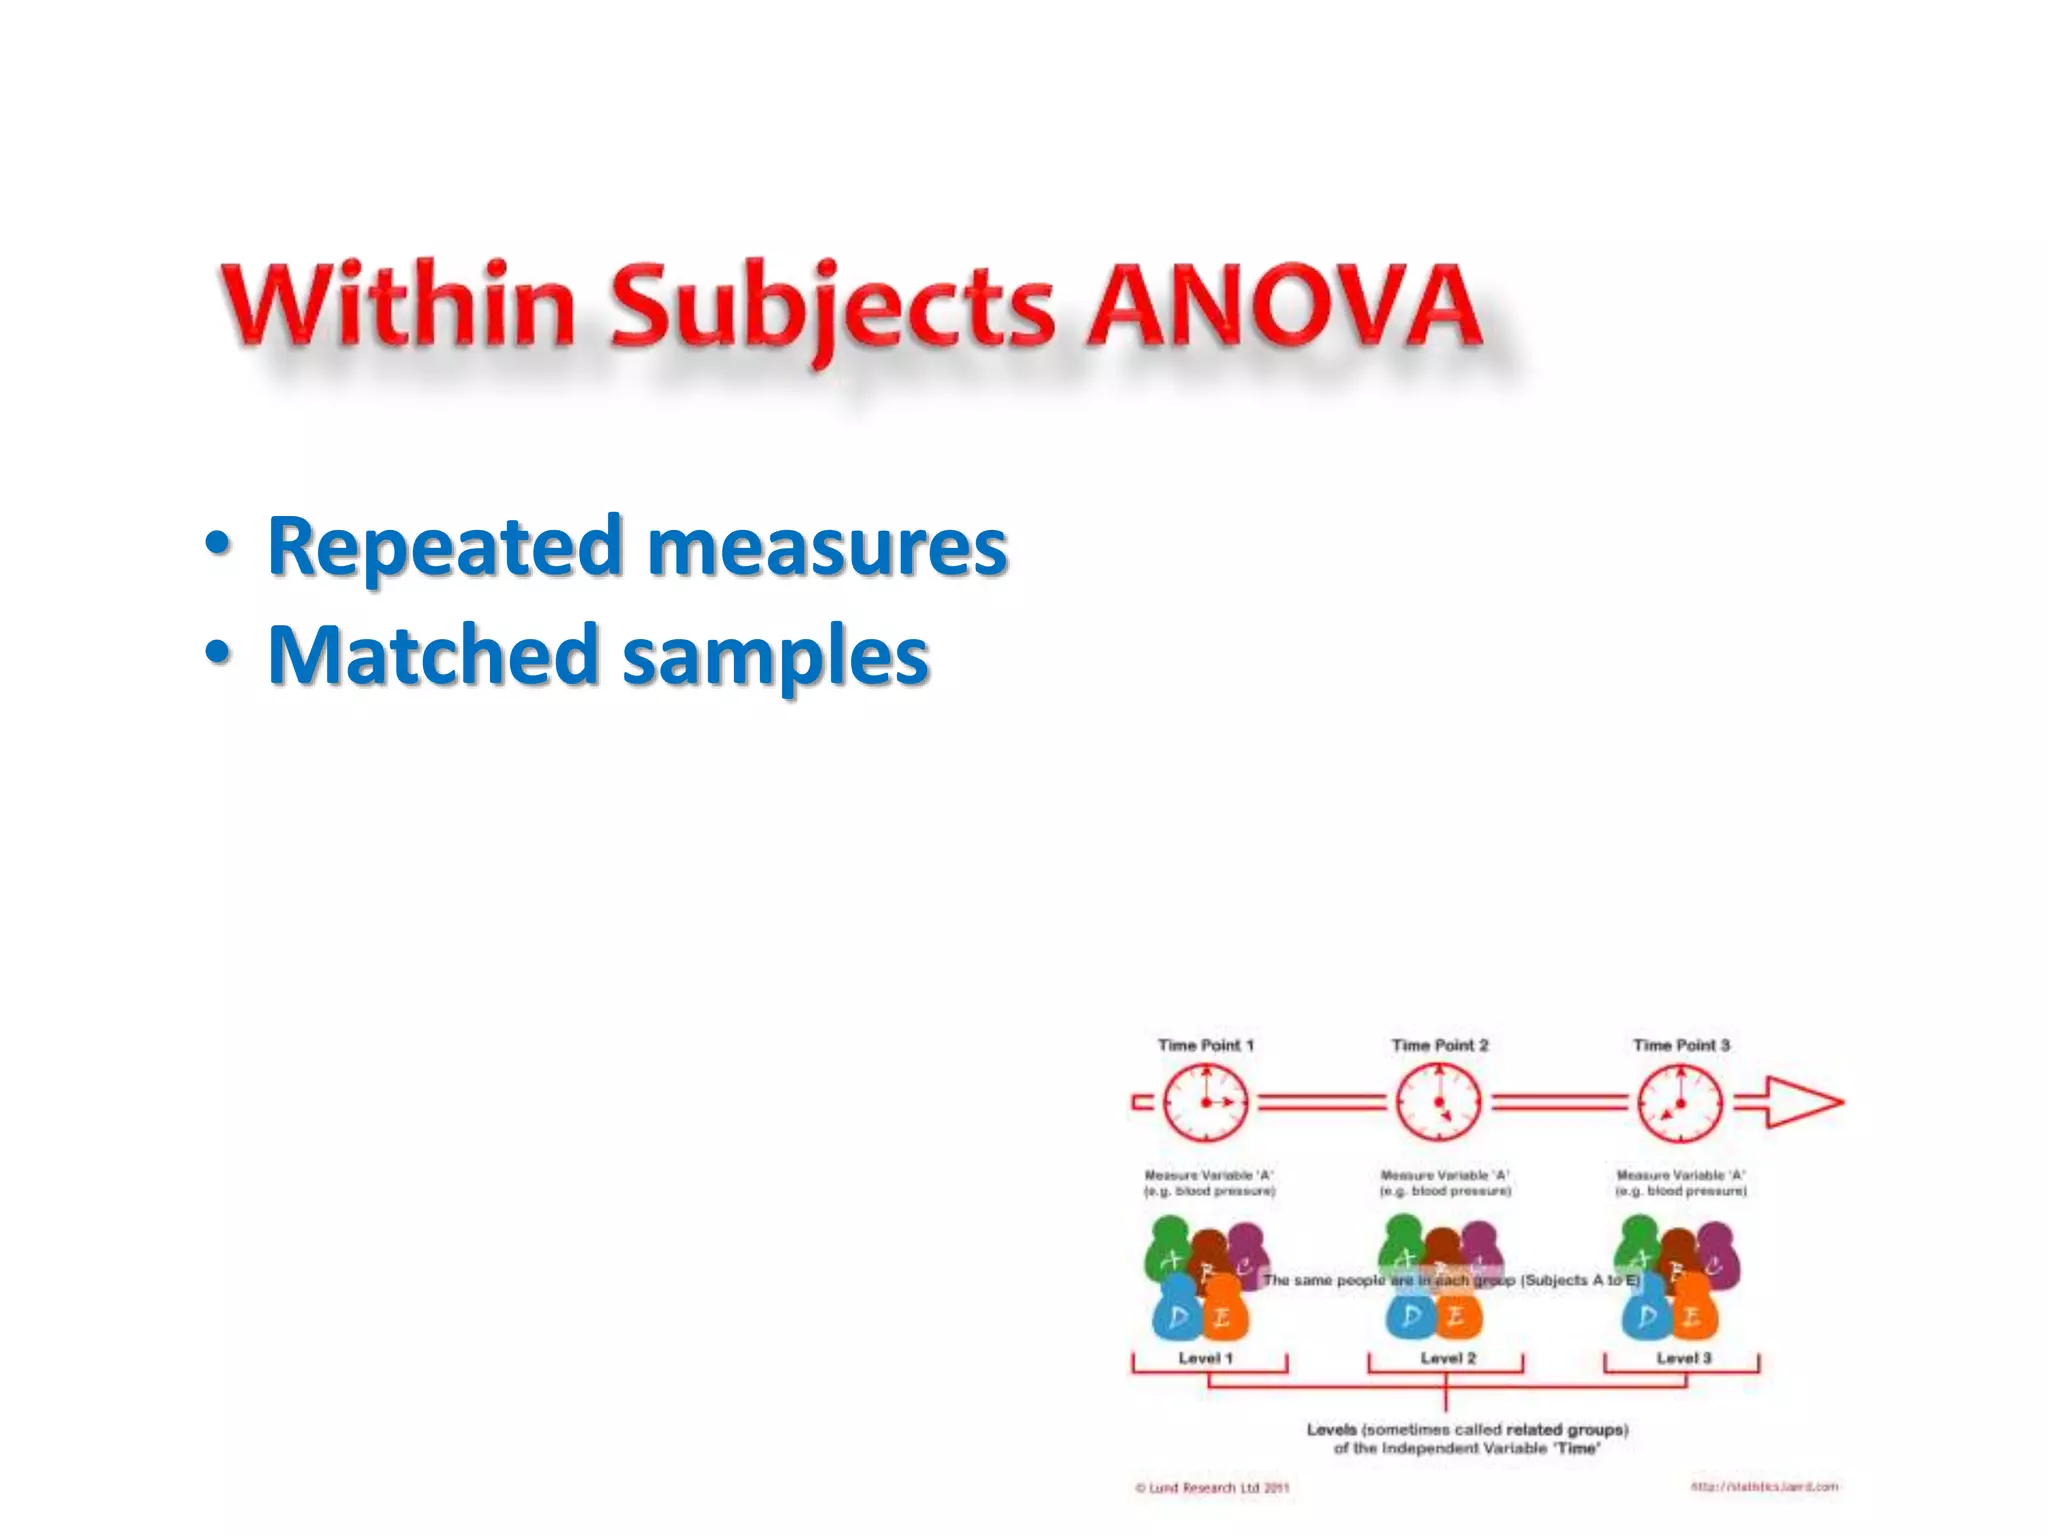
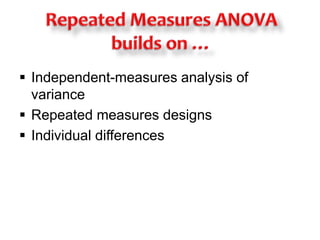
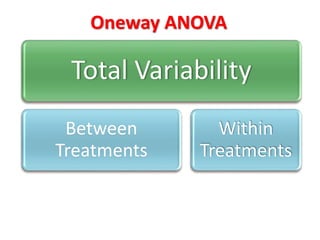
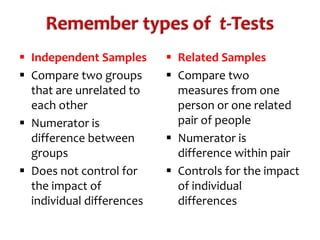
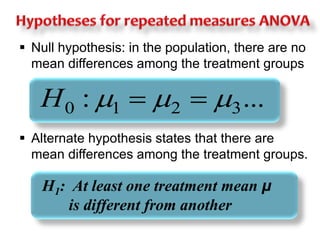
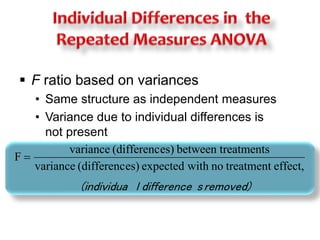
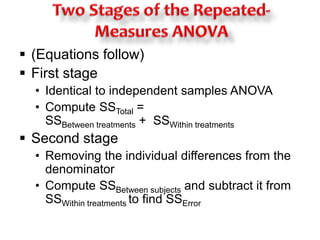
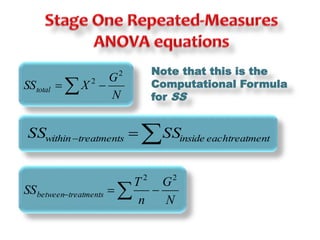
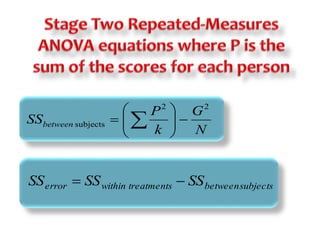
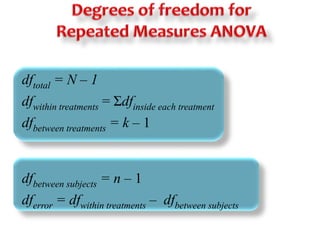
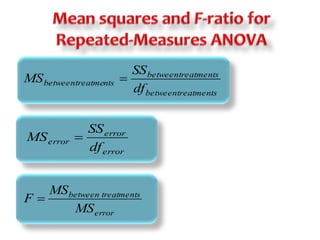
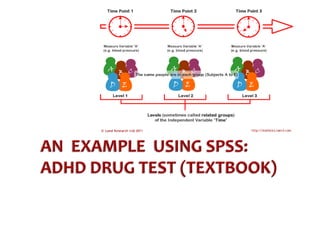
• Repeated measures 
• Matched samples
 Independent-measures analysis of 
variance 
 Repeated measures designs 
 Individual differences
Oneway ANOVA 
Total Variability 
Between 
Treatments 
Within 
Treatments
 Independent Samples 
 Compare two groups 
that are unrelated to 
each other 
 Numerator is 
difference between 
groups 
 Does not control for 
the impact of 
individual differences 
 Related Samples 
 Compare two 
measures from one 
person or one related 
pair of people 
 Numerator is 
difference within pair 
 Controls for the impact 
of individual 
differences
 Null hypothesis: in the population, there are no 
mean differences among the treatment groups 
: ... 0 1 2 3 H    
 Alternate hypothesis states that there are 
mean differences among the treatment groups. 
H1: At least one treatment mean μ 
is different from another
 F ratio based on variances 
variance (differences) between treatments 
variance (differences) expected with no treatment effect, 
(individua l difference s removed) 
F  
• Same structure as independent measures 
• Variance due to individual differences is 
not present
 Participant characteristics that vary from 
one person to another. 
• Not systematically present in any treatment 
group or by research design 
 Characteristics may influence 
measurements on the outcome variable 
• Eliminated from the numerator by 
the research design 
• Must be removed from the denominator 
statistically
 Numerator of the F ratio includes 
• Systematic differences caused by treatments 
• Unsystematic differences caused by random 
factors (reduced because same individuals in 
all treatments) 
 Denominator estimates variance 
reasonable to expect from unsystematic 
factors 
• Effect of individual differences is removed 
• Residual (error) variance remains
Repeated Measures ANOVA 
Total Variability 
Between 
Treatments 
Within 
Treatments 
Between 
Subjects 
Error 
Variance
 (Equations follow) 
 First stage 
• Identical to independent samples ANOVA 
• Compute SSTotal = 
SSBetween treatments + SSWithin treatments 
 Second stage 
• Removing the individual differences from the 
denominator 
• Compute SSBetween subjects and subtract it from 
SSWithin treatments to find SSError
G 
N 
SS X total 
2 
2   
Note that this is the 
Computational Formula 
for SS 
 withintreatments inside each treatment SS SS 
G 
N 
T 
n 
SS between treatments 
2 2 
  
G 
N 
P 
k 
SSbetween 
2 2 
 
 
  
subjects    
 
  
 
error within treatments between subjects SS  SS  SS
dftotal = N – 1 
dfwithin treatments = Σdfinside each treatment 
dfbetween treatments = k – 1 
dfbetween subjects = n – 1 
dferror = dfwithin treatments – dfbetween subjects
MS  
error 
SS 
error 
MS  
error df 
between treatments 
SS 
between treatments 
between treatments df 
between treatments 
MS 
error 
MS 
F 
OVERVIEW 
This study investigated the cognitive effects of stimulant 
medication in children with mental retardation and 
Attention-Deficit/Hyperactivity Disorder. This case study 
shows the data for the Delay of Gratification (DOG) task. 
Children were given various dosages of a drug, 
methylphenidate (MPH) and then completed this task as 
part of a larger battery of tests. The order of doses 
was counterbalanced so that each dose appeared equally 
often in each position. For example, six children received 
the lowest dose first, six received it second, etc. The 
children were on each dose one week before testing.
This task, adapted from the preschool delay task of the 
Gordon Diagnostic System (Gordon, 1983), measures the 
ability to suppress or delay impulsive behavioral responses. 
Children were told that a star would appear on the 
computer screen if they waited “long enough” to press a 
response key. If a child responded sooner in less than four 
seconds after their previous response, they did not earn a 
star, and the 4-second counter restarted. The DOG 
differentiates children with and without ADHD of normal 
intelligence (e.g., Mayes et al., 2001), and is sensitive to 
MPH treatment in these children (Hall & Kataria, 1992).
QUESTIONS TO ANSWER 
Does higher dosage lead to higher cognitive performance 
(measured by the number of correct responses to the DOG 
task)? 
DESIGN ISSUES 
This is a repeated-measures design because each 
participant performed the task after each dosage.
VARIABLE DESCRIPTION 
d0 Number of correct responses after taking a placebo 
d15 
Number of correct responses after 
taking .15 mg/kg of the drug 
d30 
Number of correct responses after 
taking .30 mg/kg of the drug 
d60 
Number of correct responses after 
taking .60 mg/kg of the drug
 Analyze 
  Descriptives 
  Explore 
 Follow steps on 
diagram at right
 Much more output than you want 
 Need to ask for some Options to get SPSS to do 
as much of the work as possible. 
• Descriptives 
• Plots 
• Multiple Comparisons 
• Effect Size
 Follow the SPSS 
instructions in Cronk 
 Choose Options 
according to the 
box at the right 
click the choices 
shown at right.
 Percentage of variance explained by the 
treatment differences 
 Partial η2 is percentage of variability that has 
not already been explained by other factors 
between treatments 
error 
between treatments 
SS 
total between subjects 
SS 
SS 
SS SS 
 
 
 2 
 Determine exactly where significant 
differences exist among more than two 
treatment means 
• Tukey’s HSD can be used (almost always 
same number of subjects) or Scheffé if 
dropouts mean unequal measures. 
• Substitute SSerror and dferror in the formulas
Does methylphenidate (MPH) have an impact on Delay of 
Gratification for children with a diagnosis of ADHD? 
Researchers compared DOG for of 24 children when they 
received a placebo (M=39.75, s=11.315) and doses of 15mg/kg 
(M=39.67, s=9.135), .30mg/kg (M=____, s=__) and .60mg/kg 
(M=___, s=__); see Figure 1. The differences were/were not 
significant (F(__ ,__)=______, p = _____). Post-hoc tests 
with Bonferroni correction showed that ____________ The 
impact of the MPH dosage was _____, with about ____% of 
the variability in DOG related to the dosage of MPH (partial 
2=._____). Dosage of MPH ______________
 The observations within each treatment 
condition must be independent. 
 The population distribution within each 
treatment must be normal. 
 The variances of the population 
distribution for each treatment should be 
equivalent.
• Repeated measures 
• Matched samples

Repeated Measures ANOVA

  • 1.
    • Repeated measures • Matched samples
  • 2.
     Independent-measures analysisof variance  Repeated measures designs  Individual differences
  • 3.
    Oneway ANOVA TotalVariability Between Treatments Within Treatments
  • 4.
     Independent Samples  Compare two groups that are unrelated to each other  Numerator is difference between groups  Does not control for the impact of individual differences  Related Samples  Compare two measures from one person or one related pair of people  Numerator is difference within pair  Controls for the impact of individual differences
  • 5.
     Null hypothesis:in the population, there are no mean differences among the treatment groups : ... 0 1 2 3 H     Alternate hypothesis states that there are mean differences among the treatment groups. H1: At least one treatment mean μ is different from another
  • 6.
     F ratiobased on variances variance (differences) between treatments variance (differences) expected with no treatment effect, (individua l difference s removed) F  • Same structure as independent measures • Variance due to individual differences is not present
  • 7.
     Participant characteristicsthat vary from one person to another. • Not systematically present in any treatment group or by research design  Characteristics may influence measurements on the outcome variable • Eliminated from the numerator by the research design • Must be removed from the denominator statistically
  • 8.
     Numerator ofthe F ratio includes • Systematic differences caused by treatments • Unsystematic differences caused by random factors (reduced because same individuals in all treatments)  Denominator estimates variance reasonable to expect from unsystematic factors • Effect of individual differences is removed • Residual (error) variance remains
  • 9.
    Repeated Measures ANOVA Total Variability Between Treatments Within Treatments Between Subjects Error Variance
  • 11.
     (Equations follow)  First stage • Identical to independent samples ANOVA • Compute SSTotal = SSBetween treatments + SSWithin treatments  Second stage • Removing the individual differences from the denominator • Compute SSBetween subjects and subtract it from SSWithin treatments to find SSError
  • 12.
    G N SSX total 2 2   Note that this is the Computational Formula for SS  withintreatments inside each treatment SS SS G N T n SS between treatments 2 2   
  • 13.
    G N P k SSbetween 2 2     subjects        error within treatments between subjects SS  SS  SS
  • 14.
    dftotal = N– 1 dfwithin treatments = Σdfinside each treatment dfbetween treatments = k – 1 dfbetween subjects = n – 1 dferror = dfwithin treatments – dfbetween subjects
  • 15.
    MS  error SS error MS  error df between treatments SS between treatments between treatments df between treatments MS error MS F 
  • 17.
    OVERVIEW This studyinvestigated the cognitive effects of stimulant medication in children with mental retardation and Attention-Deficit/Hyperactivity Disorder. This case study shows the data for the Delay of Gratification (DOG) task. Children were given various dosages of a drug, methylphenidate (MPH) and then completed this task as part of a larger battery of tests. The order of doses was counterbalanced so that each dose appeared equally often in each position. For example, six children received the lowest dose first, six received it second, etc. The children were on each dose one week before testing.
  • 18.
    This task, adaptedfrom the preschool delay task of the Gordon Diagnostic System (Gordon, 1983), measures the ability to suppress or delay impulsive behavioral responses. Children were told that a star would appear on the computer screen if they waited “long enough” to press a response key. If a child responded sooner in less than four seconds after their previous response, they did not earn a star, and the 4-second counter restarted. The DOG differentiates children with and without ADHD of normal intelligence (e.g., Mayes et al., 2001), and is sensitive to MPH treatment in these children (Hall & Kataria, 1992).
  • 19.
    QUESTIONS TO ANSWER Does higher dosage lead to higher cognitive performance (measured by the number of correct responses to the DOG task)? DESIGN ISSUES This is a repeated-measures design because each participant performed the task after each dosage.
  • 20.
    VARIABLE DESCRIPTION d0Number of correct responses after taking a placebo d15 Number of correct responses after taking .15 mg/kg of the drug d30 Number of correct responses after taking .30 mg/kg of the drug d60 Number of correct responses after taking .60 mg/kg of the drug
  • 21.
     Analyze  Descriptives   Explore  Follow steps on diagram at right
  • 23.
     Much moreoutput than you want  Need to ask for some Options to get SPSS to do as much of the work as possible. • Descriptives • Plots • Multiple Comparisons • Effect Size
  • 24.
     Follow theSPSS instructions in Cronk  Choose Options according to the box at the right click the choices shown at right.
  • 28.
     Percentage ofvariance explained by the treatment differences  Partial η2 is percentage of variability that has not already been explained by other factors between treatments error between treatments SS total between subjects SS SS SS SS    2 
  • 29.
     Determine exactlywhere significant differences exist among more than two treatment means • Tukey’s HSD can be used (almost always same number of subjects) or Scheffé if dropouts mean unequal measures. • Substitute SSerror and dferror in the formulas
  • 31.
    Does methylphenidate (MPH)have an impact on Delay of Gratification for children with a diagnosis of ADHD? Researchers compared DOG for of 24 children when they received a placebo (M=39.75, s=11.315) and doses of 15mg/kg (M=39.67, s=9.135), .30mg/kg (M=____, s=__) and .60mg/kg (M=___, s=__); see Figure 1. The differences were/were not significant (F(__ ,__)=______, p = _____). Post-hoc tests with Bonferroni correction showed that ____________ The impact of the MPH dosage was _____, with about ____% of the variability in DOG related to the dosage of MPH (partial 2=._____). Dosage of MPH ______________
  • 33.
     The observationswithin each treatment condition must be independent.  The population distribution within each treatment must be normal.  The variances of the population distribution for each treatment should be equivalent.
  • 34.
    • Repeated measures • Matched samples