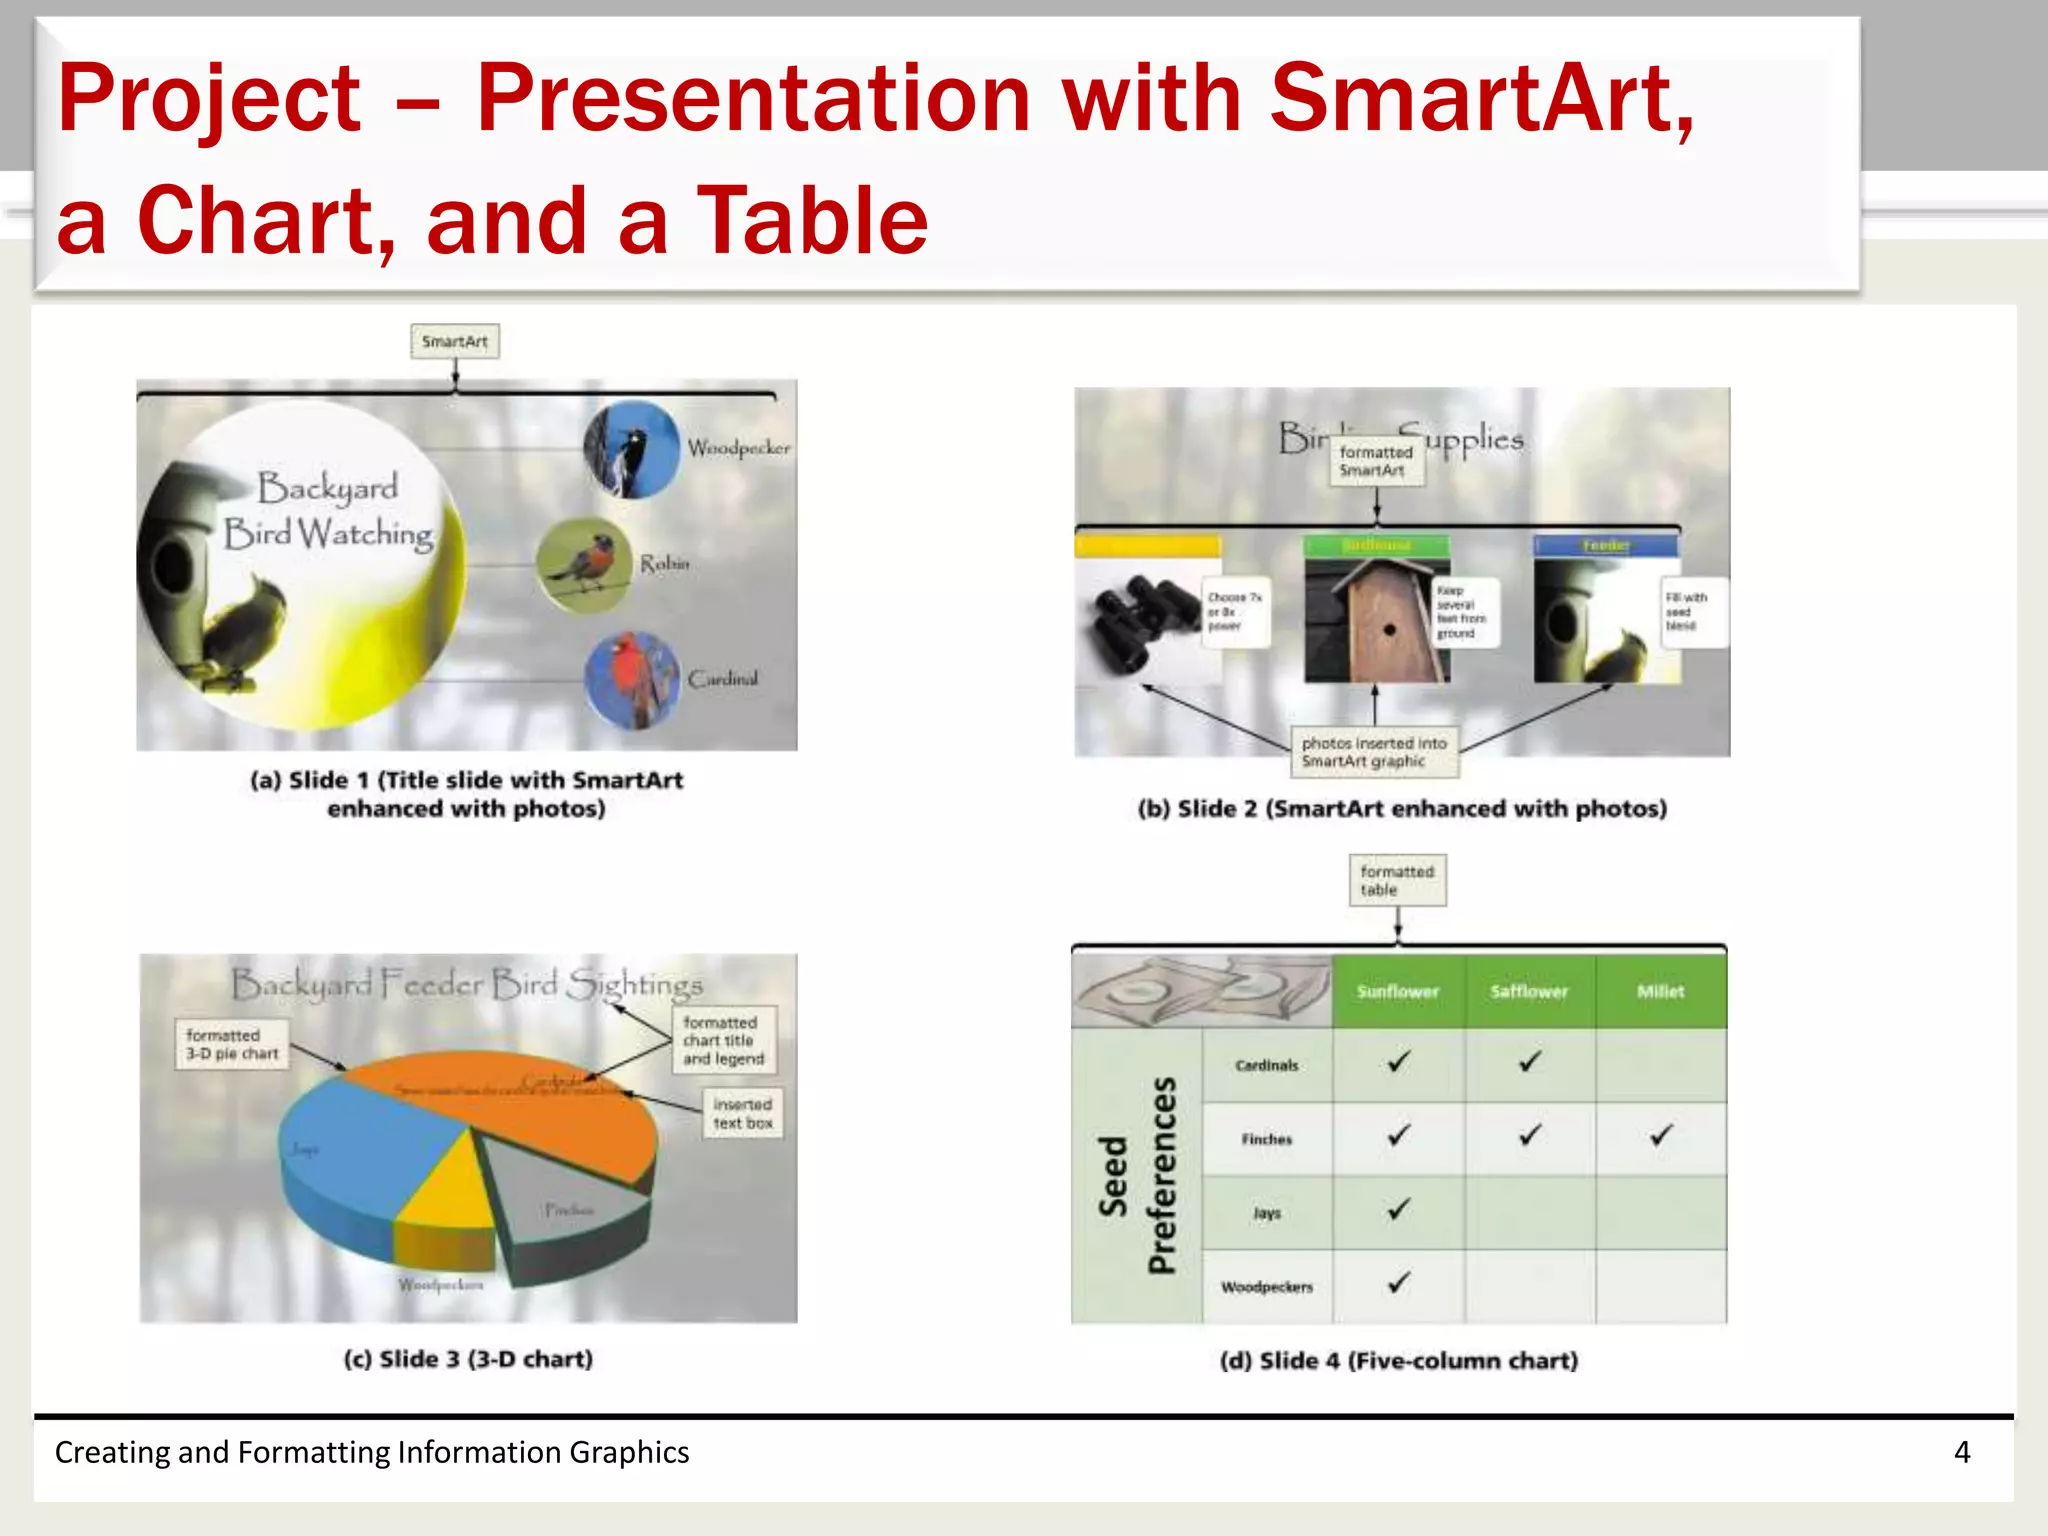
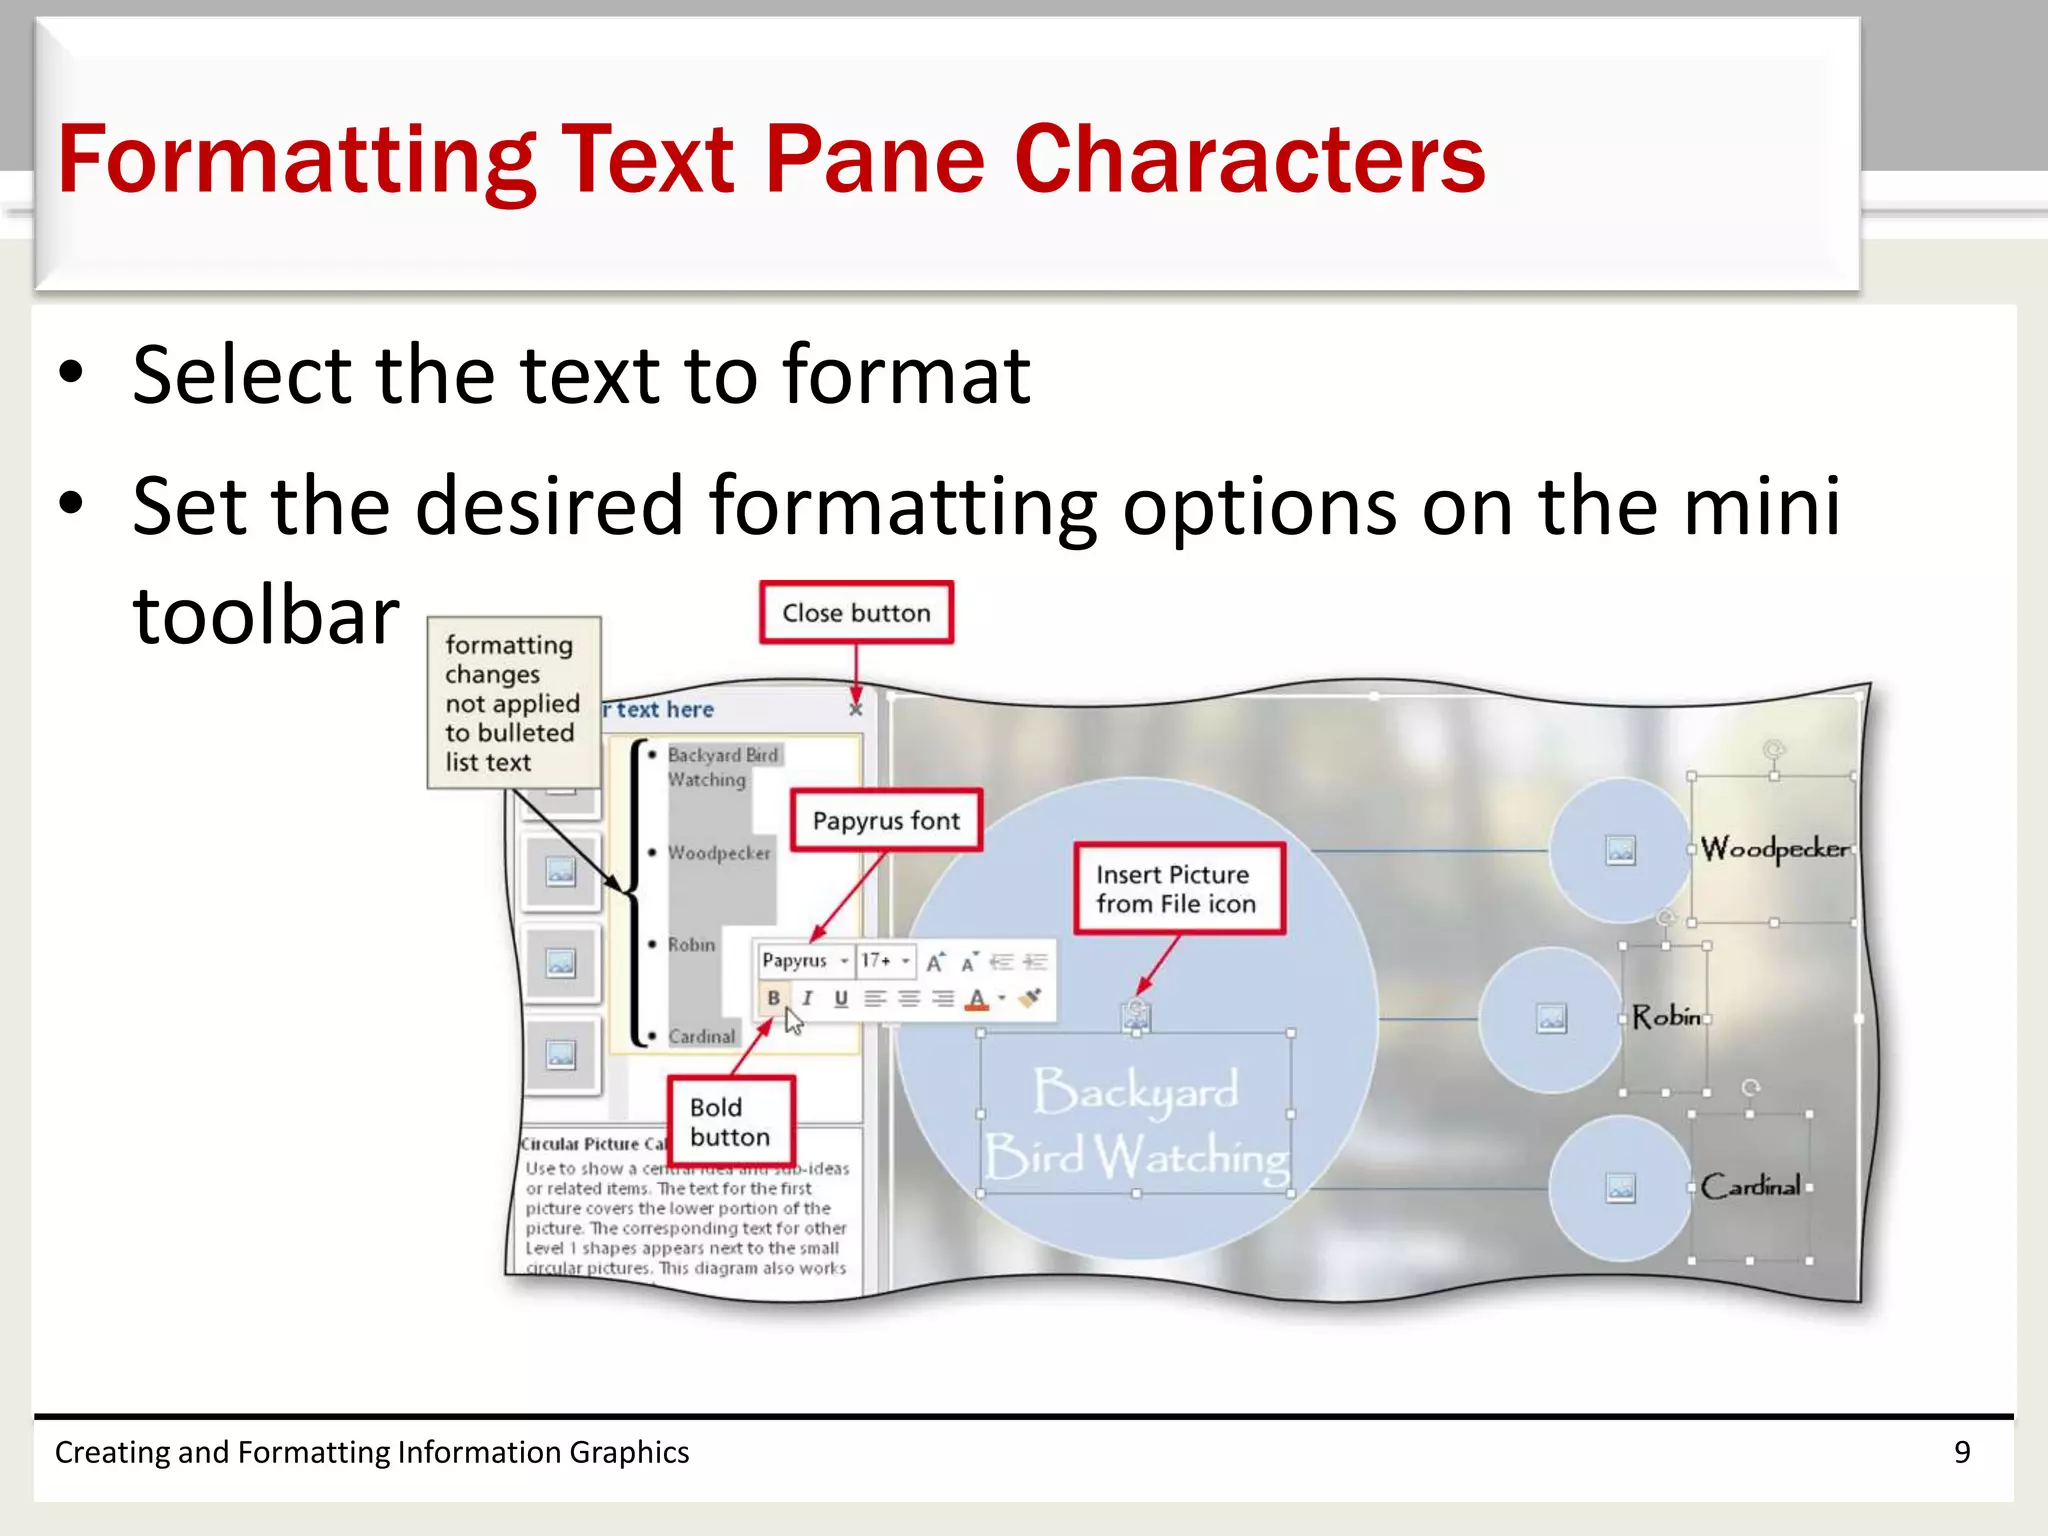
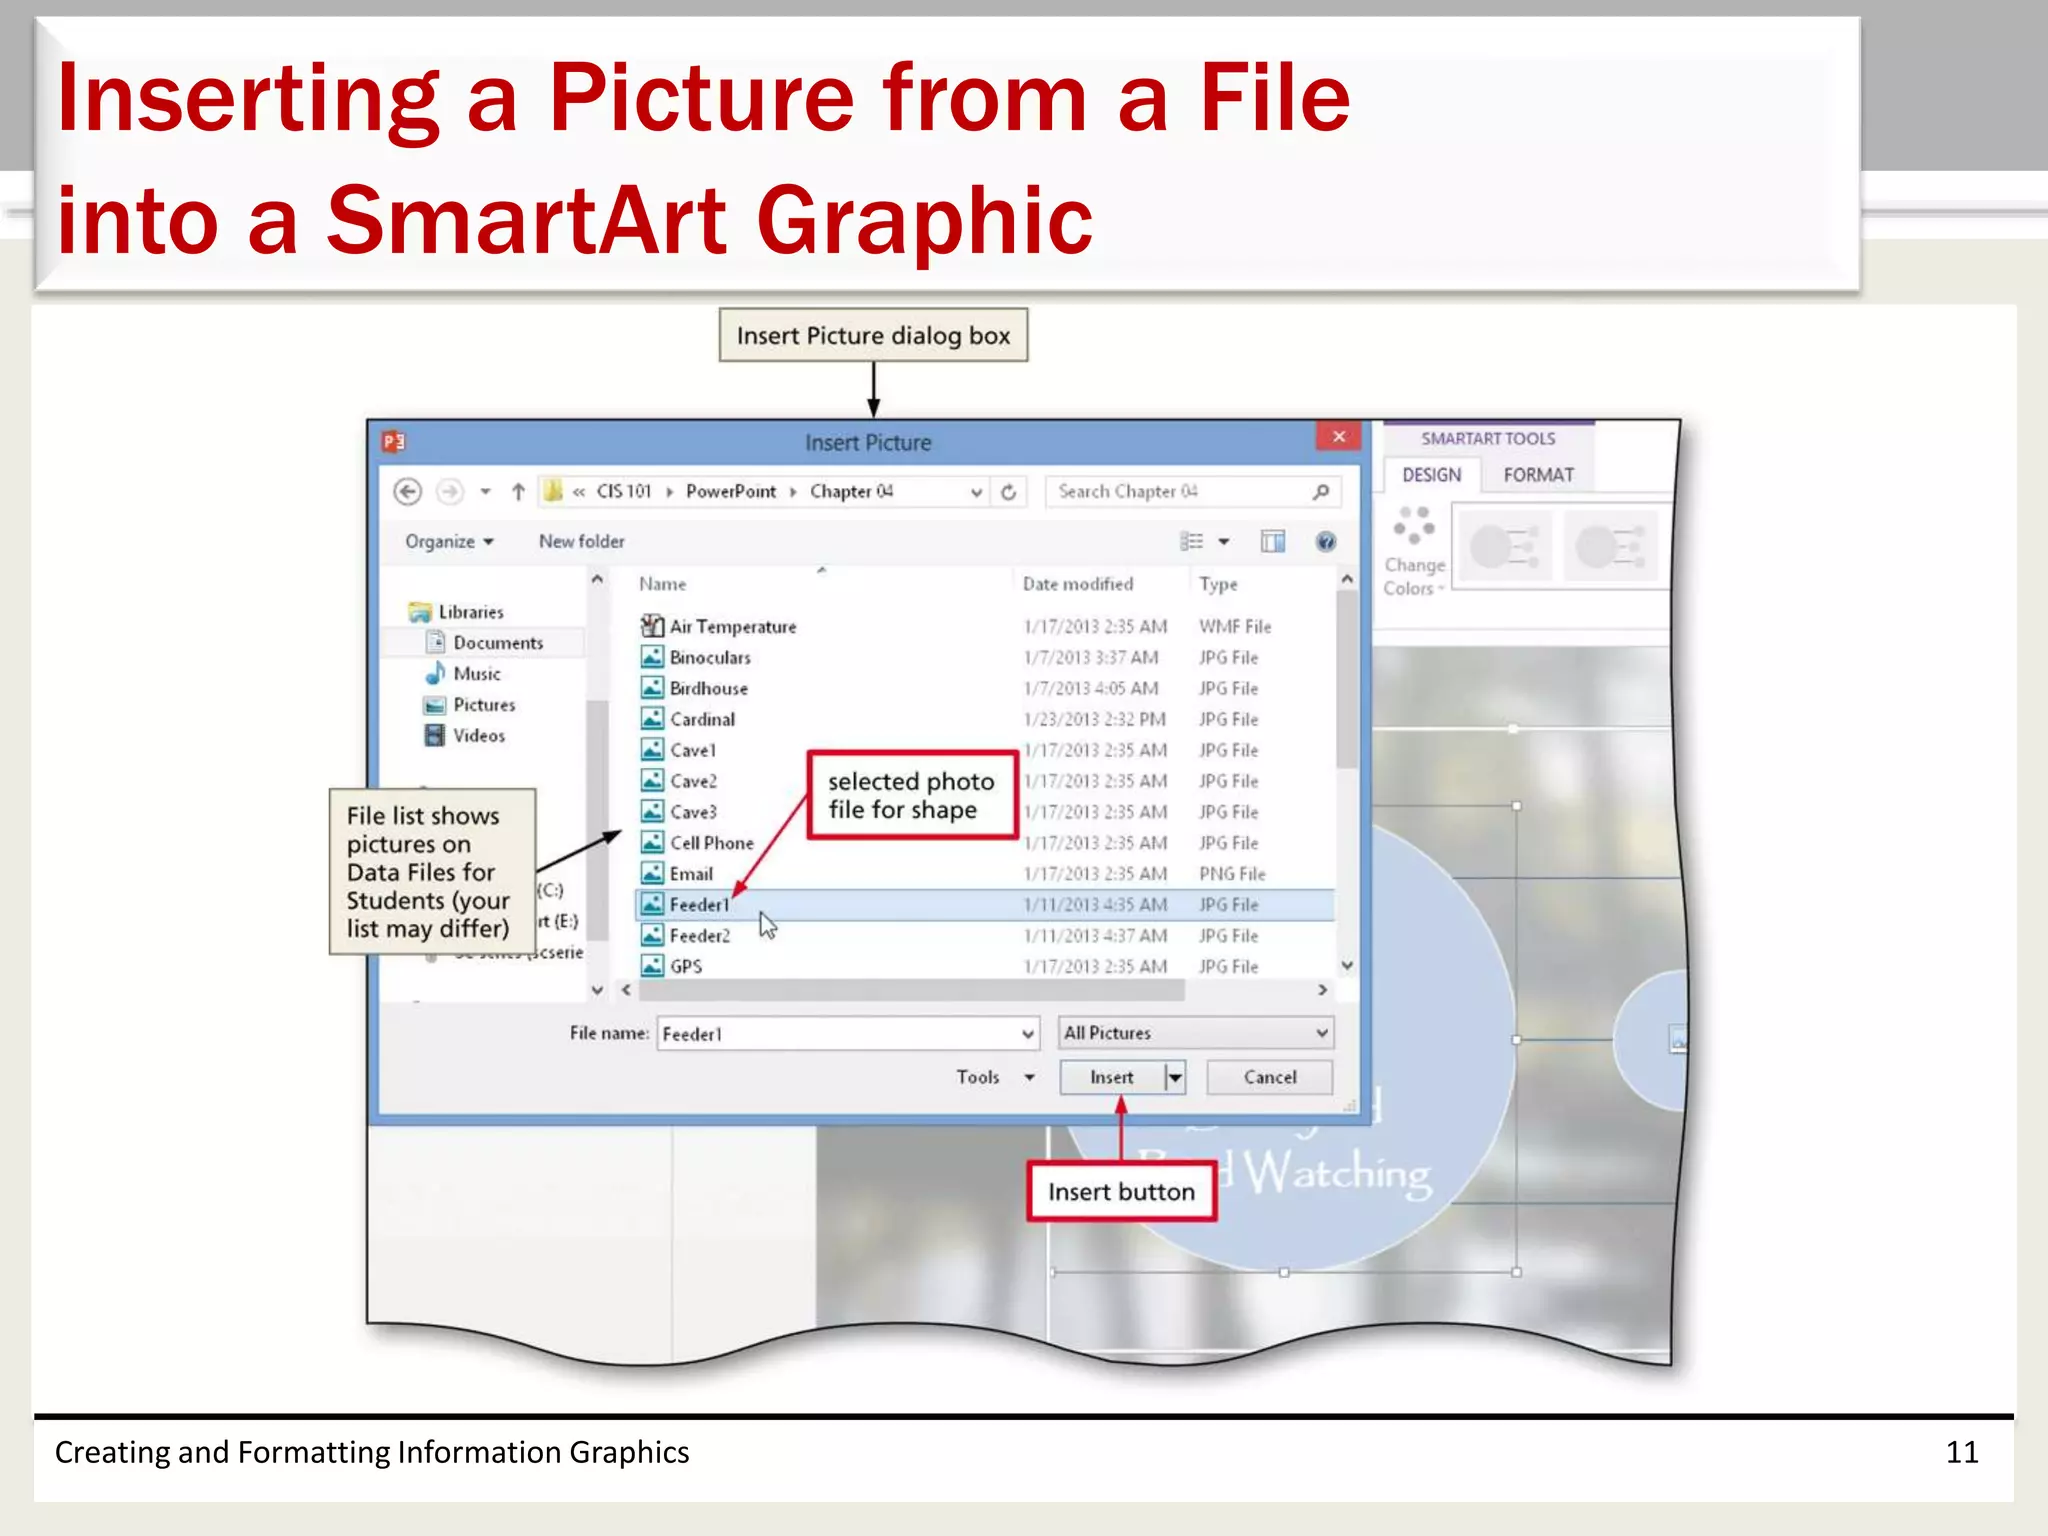
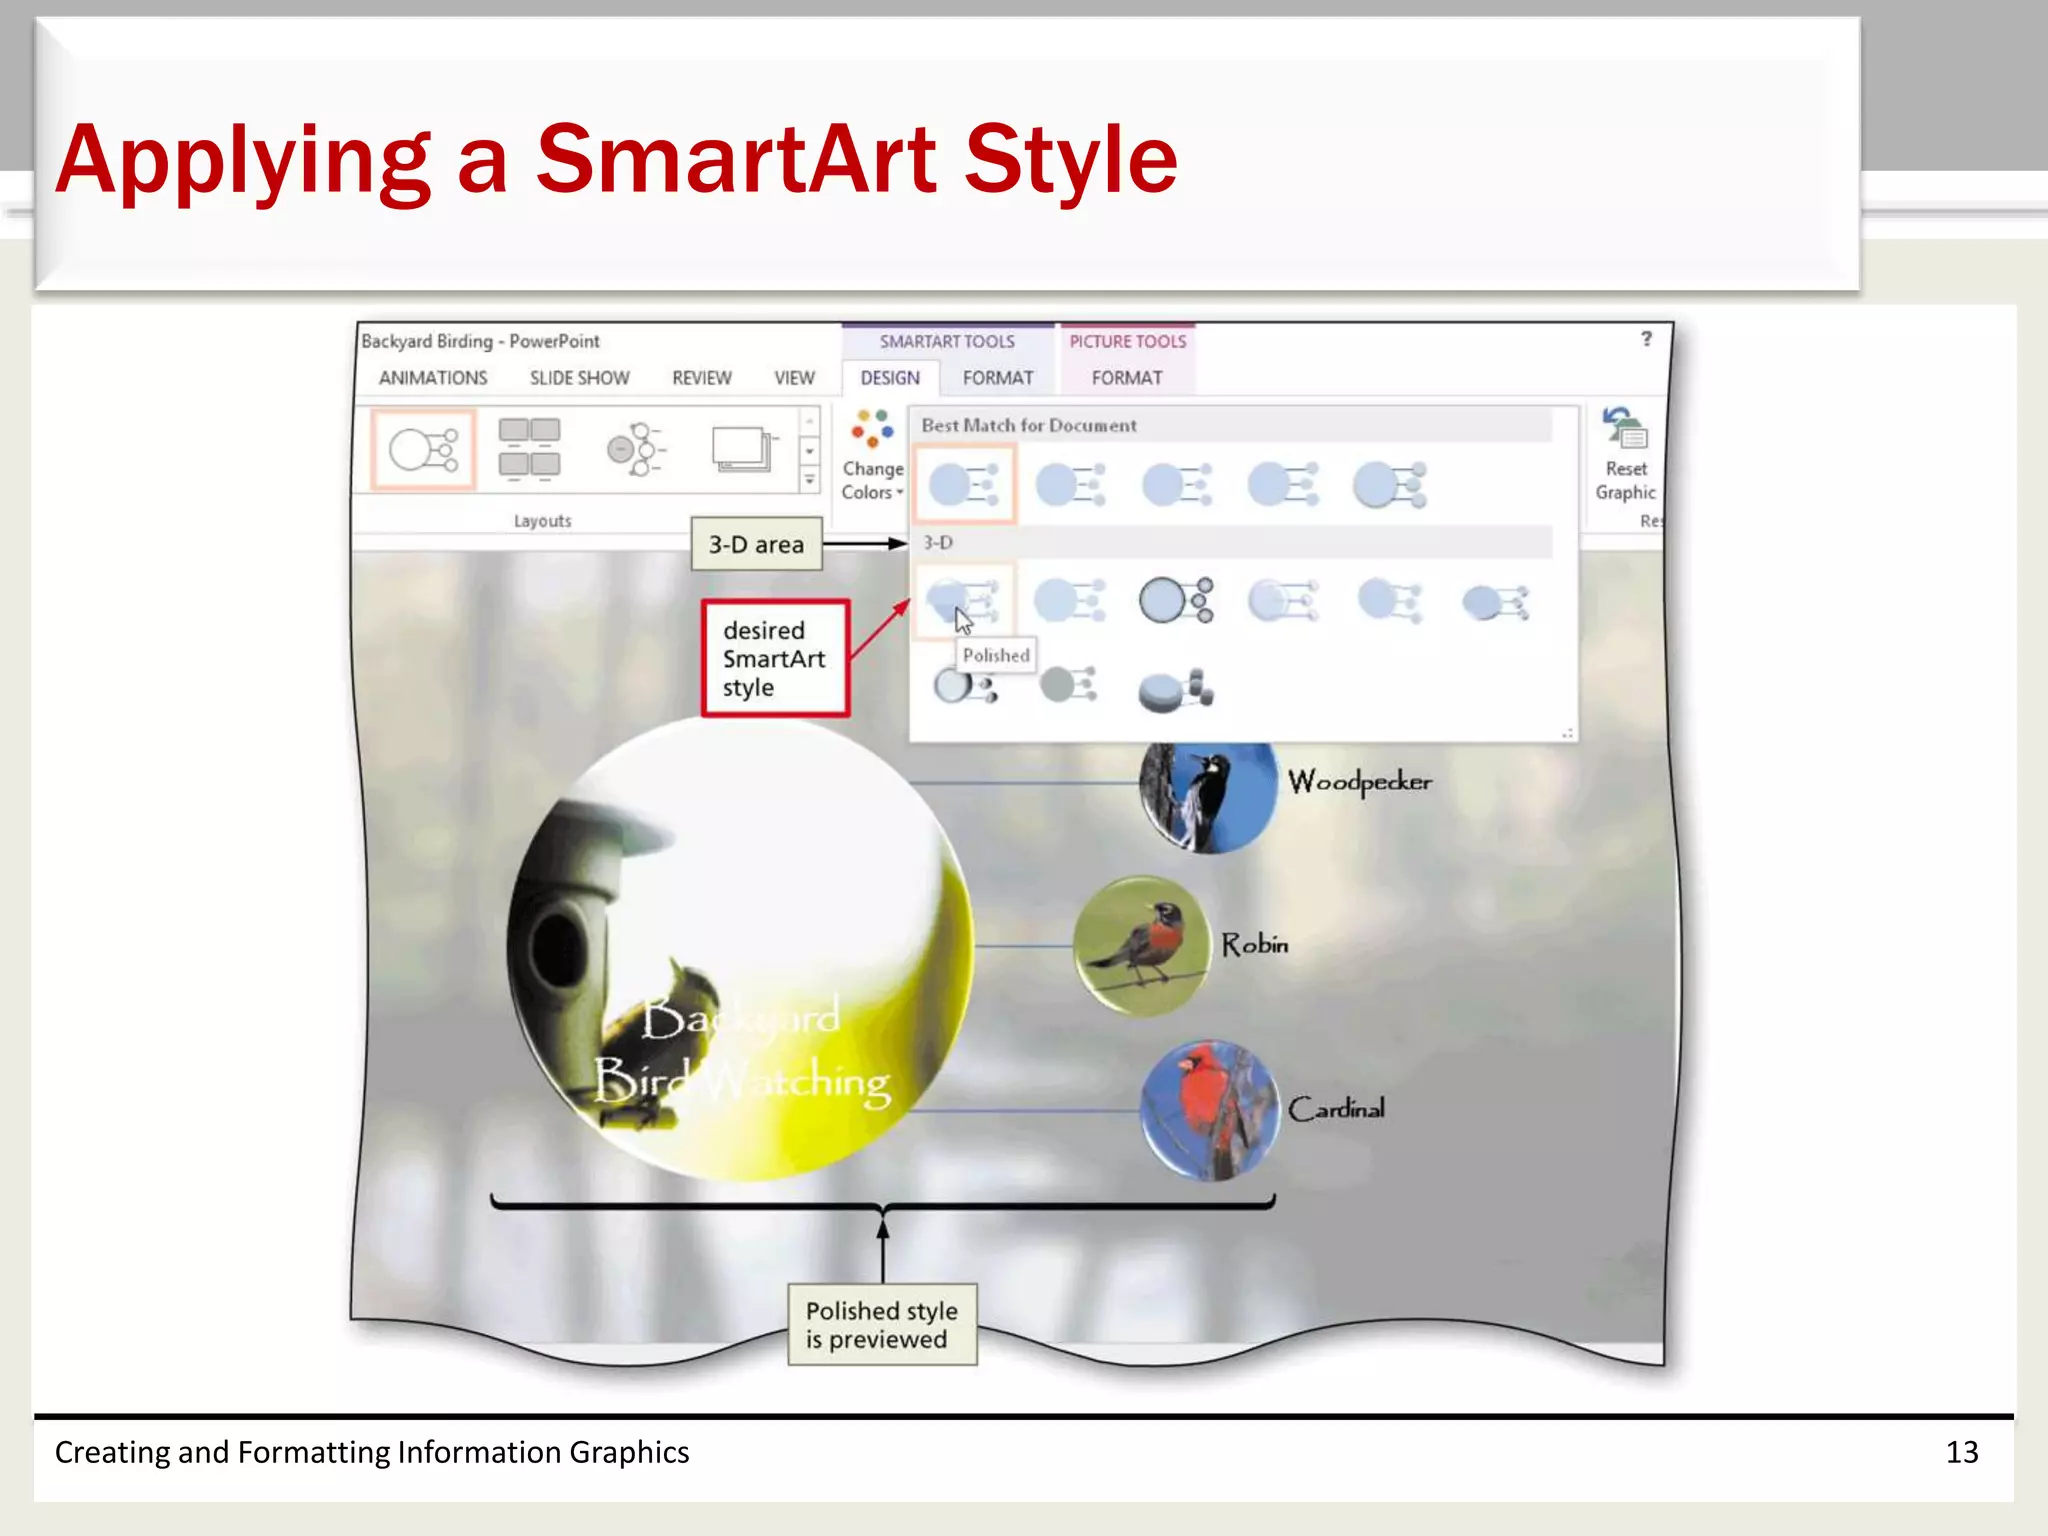
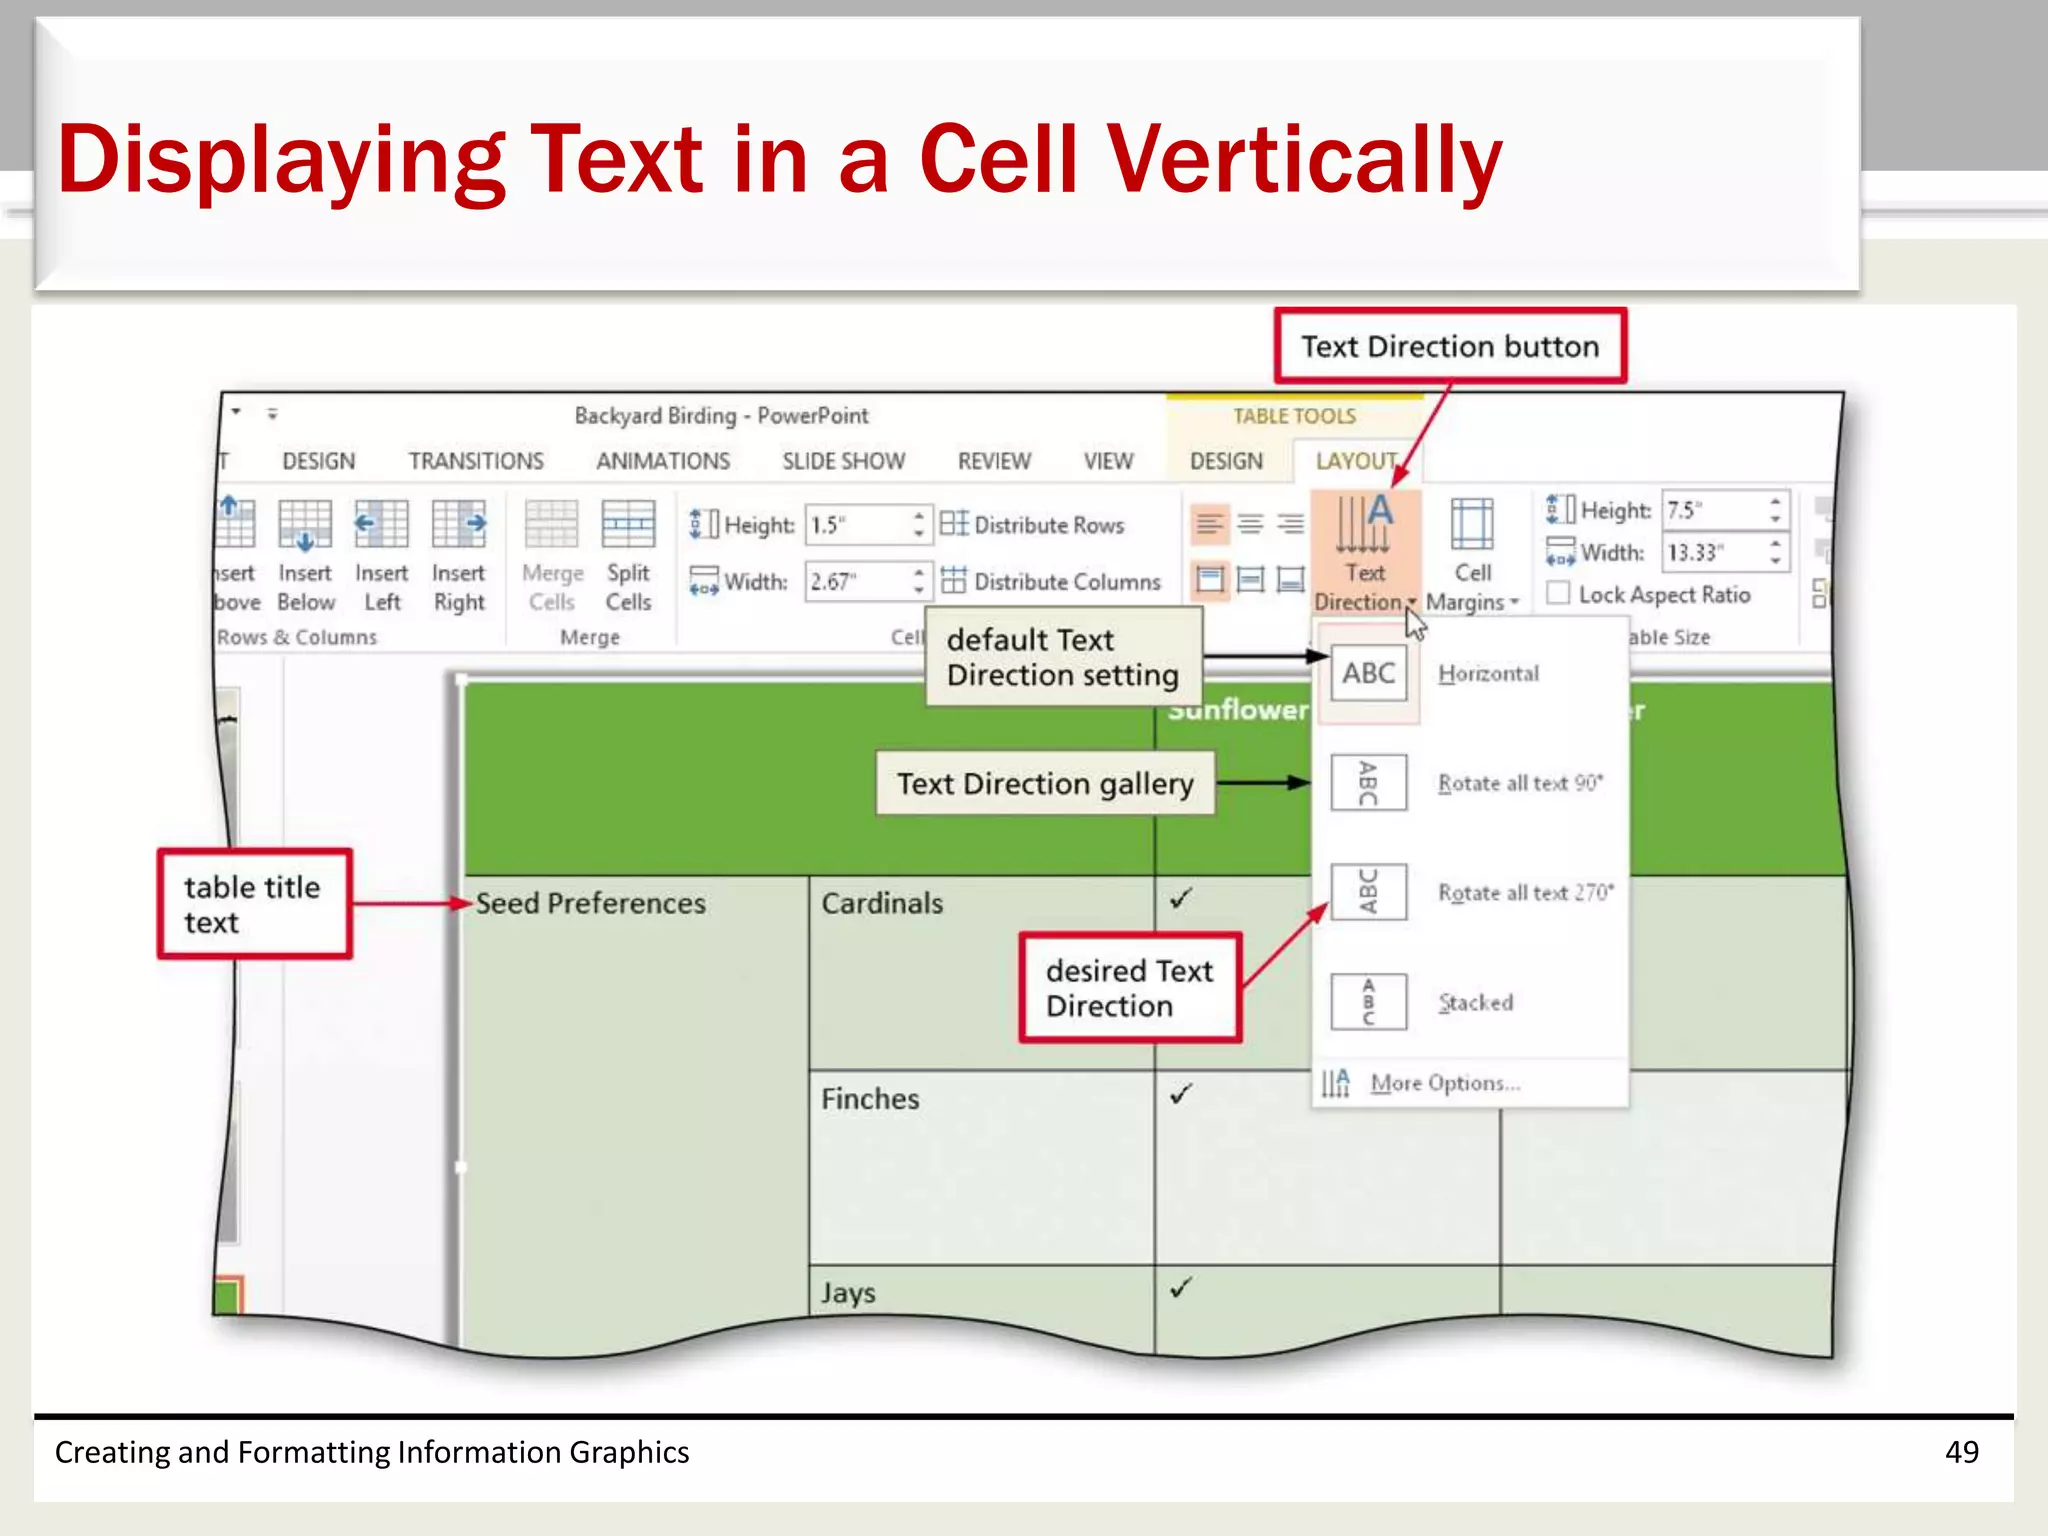
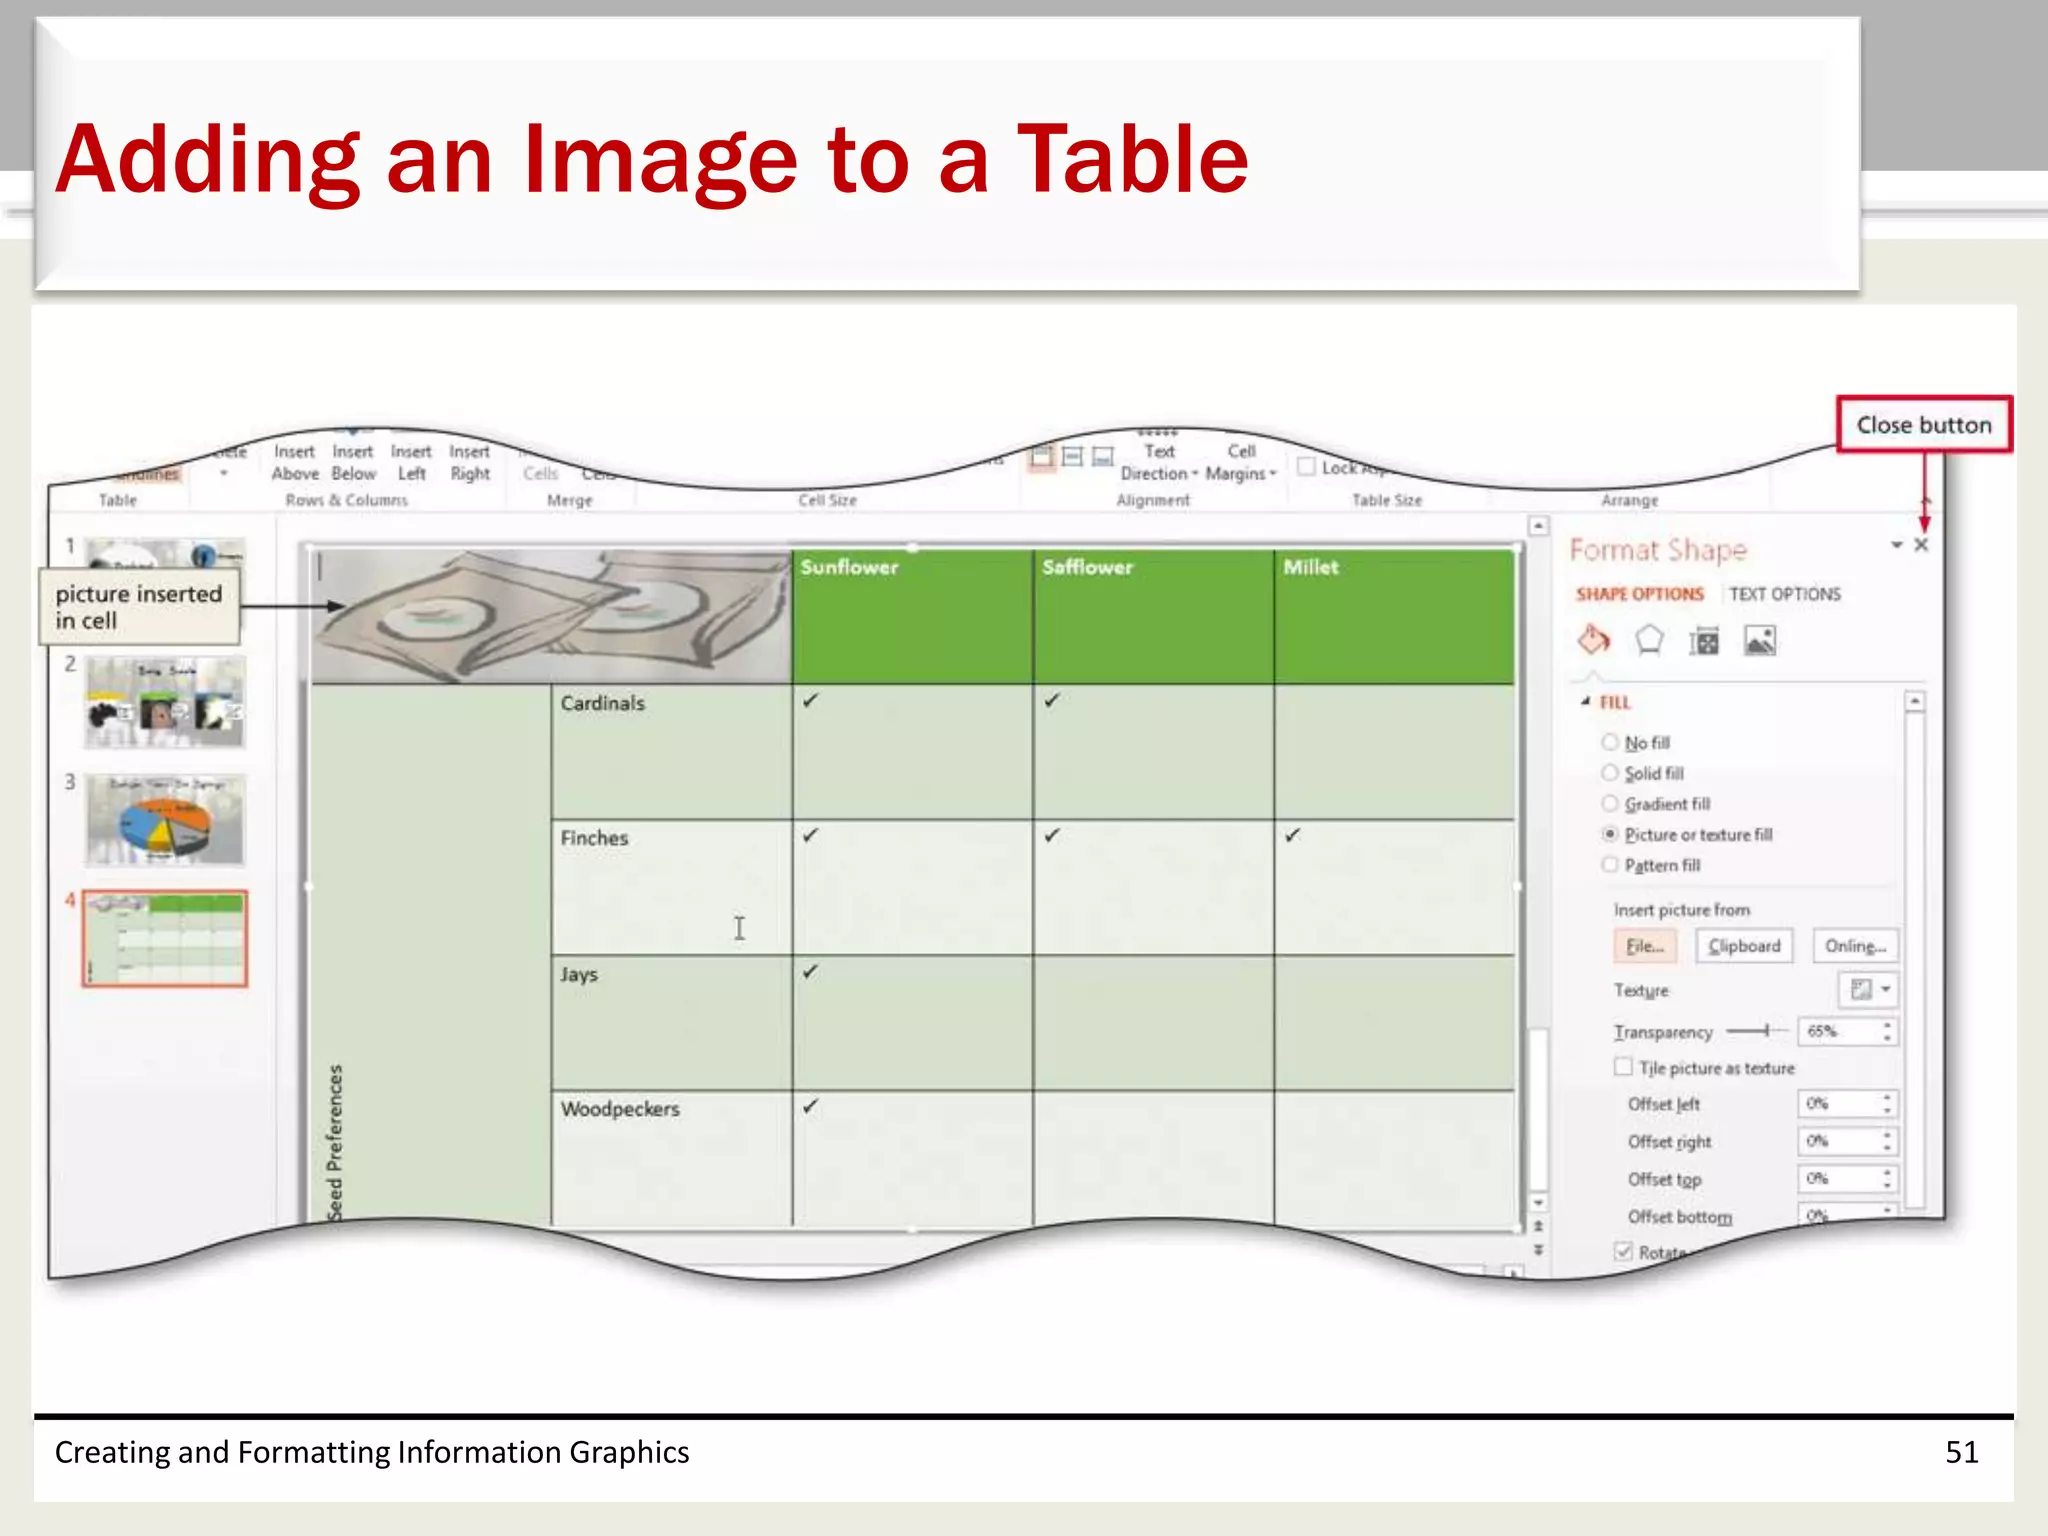
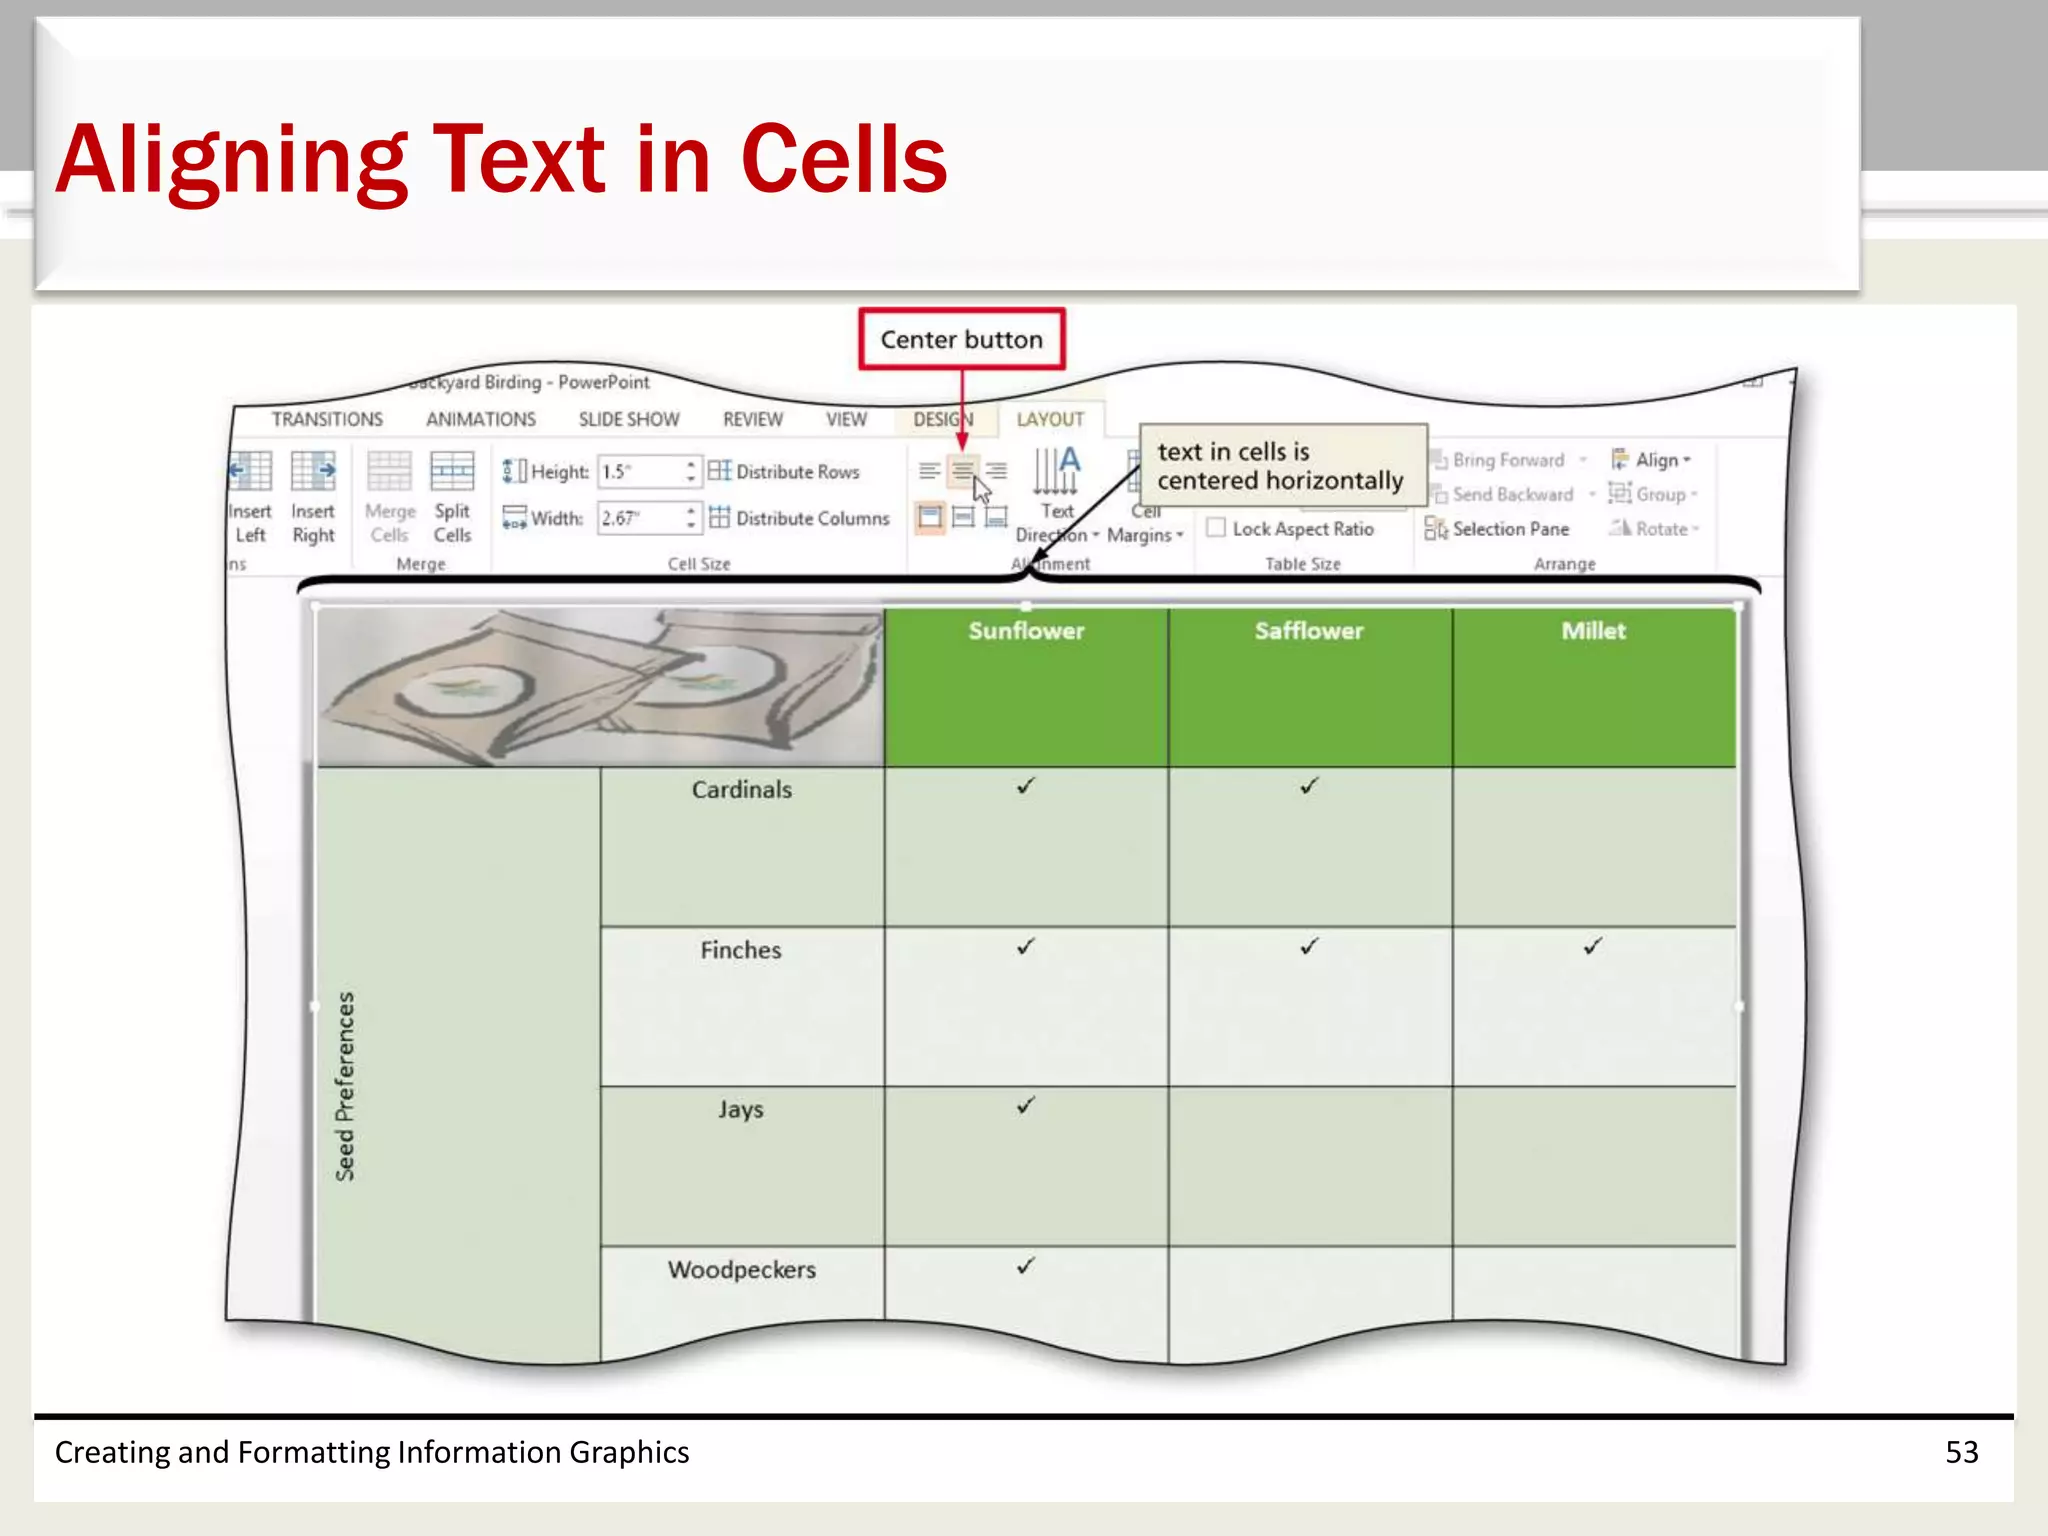
This chapter discusses how to create and format information graphics in PowerPoint 2013, including inserting and formatting SmartArt graphics, charts, and tables. It covers how to convert text to a SmartArt graphic, change chart and table styles, rotate charts, separate pie slices, add borders and images to tables, and align text in cells. The chapter aims to help users present data visually through the use of SmartArt, charts, and tables.