Download to read offline
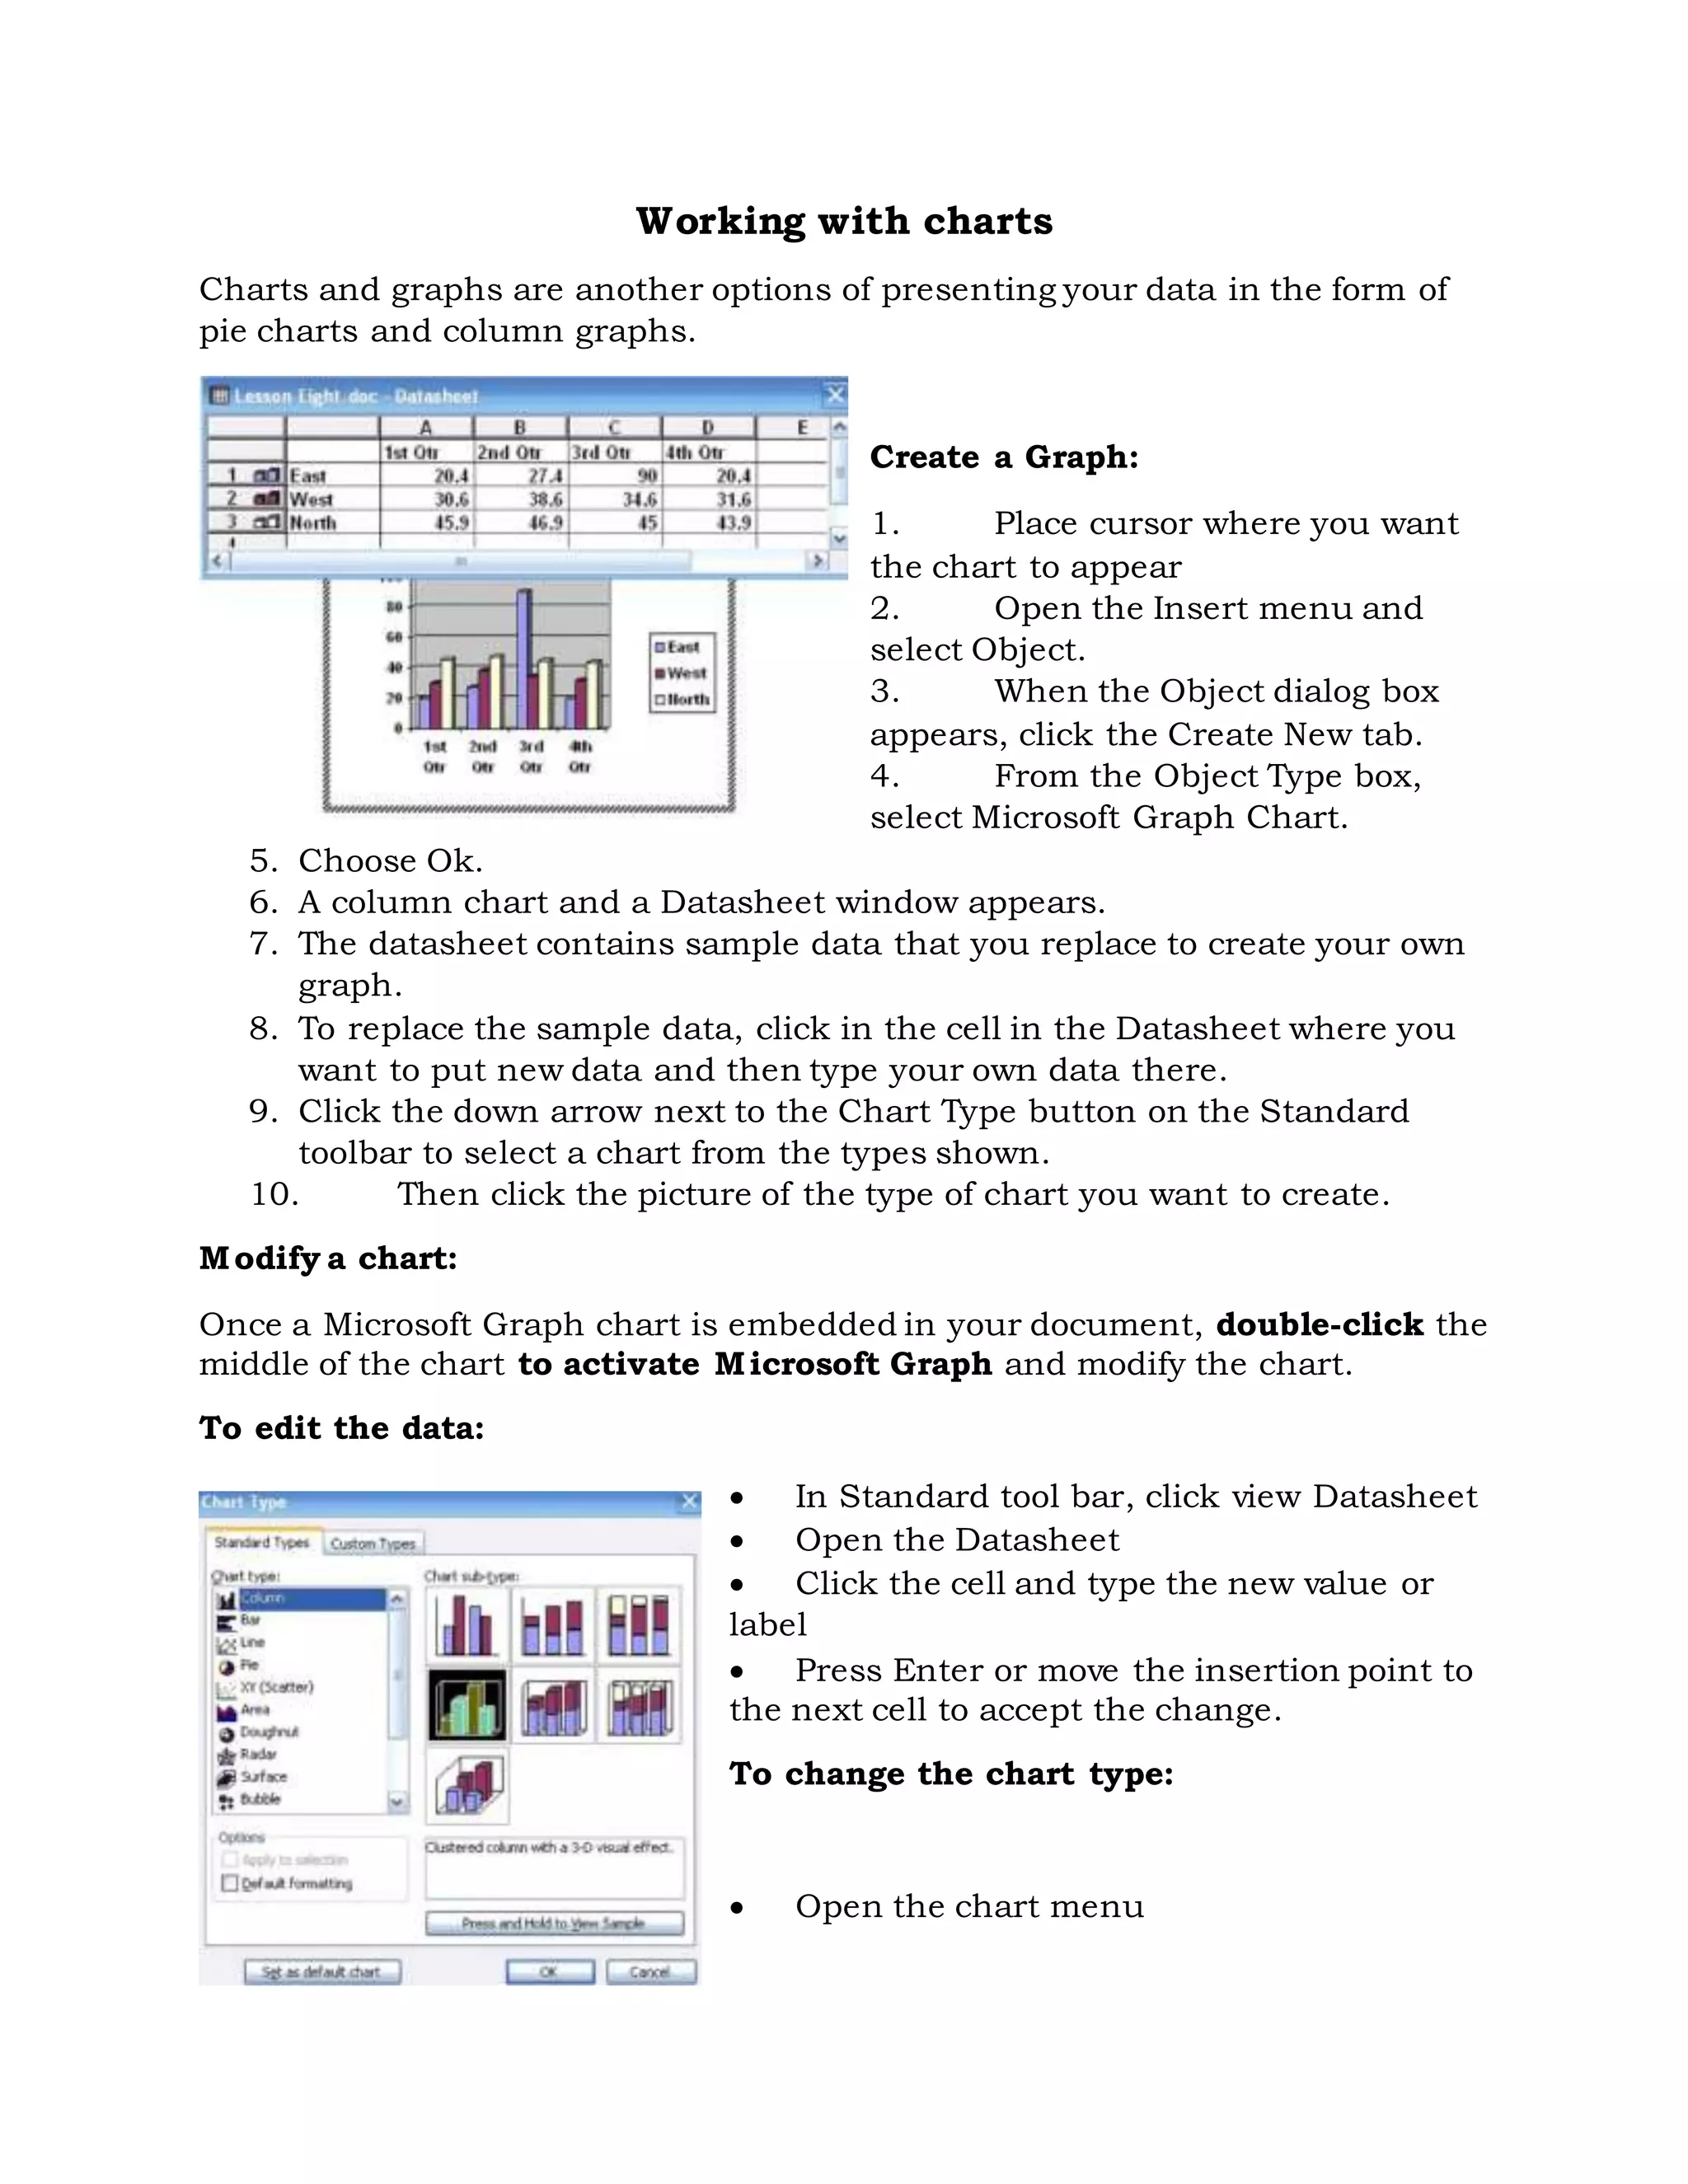

The document provides instructions for creating and modifying charts and graphs, inserting images and graphics, and using WordArt in Microsoft Word. It explains how to create and customize column, pie, and line charts by adding or replacing data, changing the chart type and colors, formatting axes, and adding titles. It also describes how to insert pictures, clip art, shapes, and WordArt and customize their formatting and positioning.