Download as PDF, PPTX


![What is Phase Noise?
• Ideal Signal (noiseless)
V(t) = A sin(2t) Level
where t
A = nominal amplitude f
= nominal frequency
Time Domain Frequency Domain
• Real Signal
V(t) = [A + E(t)] sin(2t + (t))
Level
where
E(t) = amplitude fluctuations t
(t) = phase fluctuations f
Phase Noise is unintentional phase modulation that spreads the
signal spectrum in the frequency domain.
Phase Noise is equivalent to jitter in the time domain.
DesignCon 2013 | Phase Noise and Jitter | 7](https://image.slidesharecdn.com/phasenoiseandjittermeasurements-130204111756-phpapp02/75/Phase-Noise-and-Jitter-Measurements-7-2048.jpg)


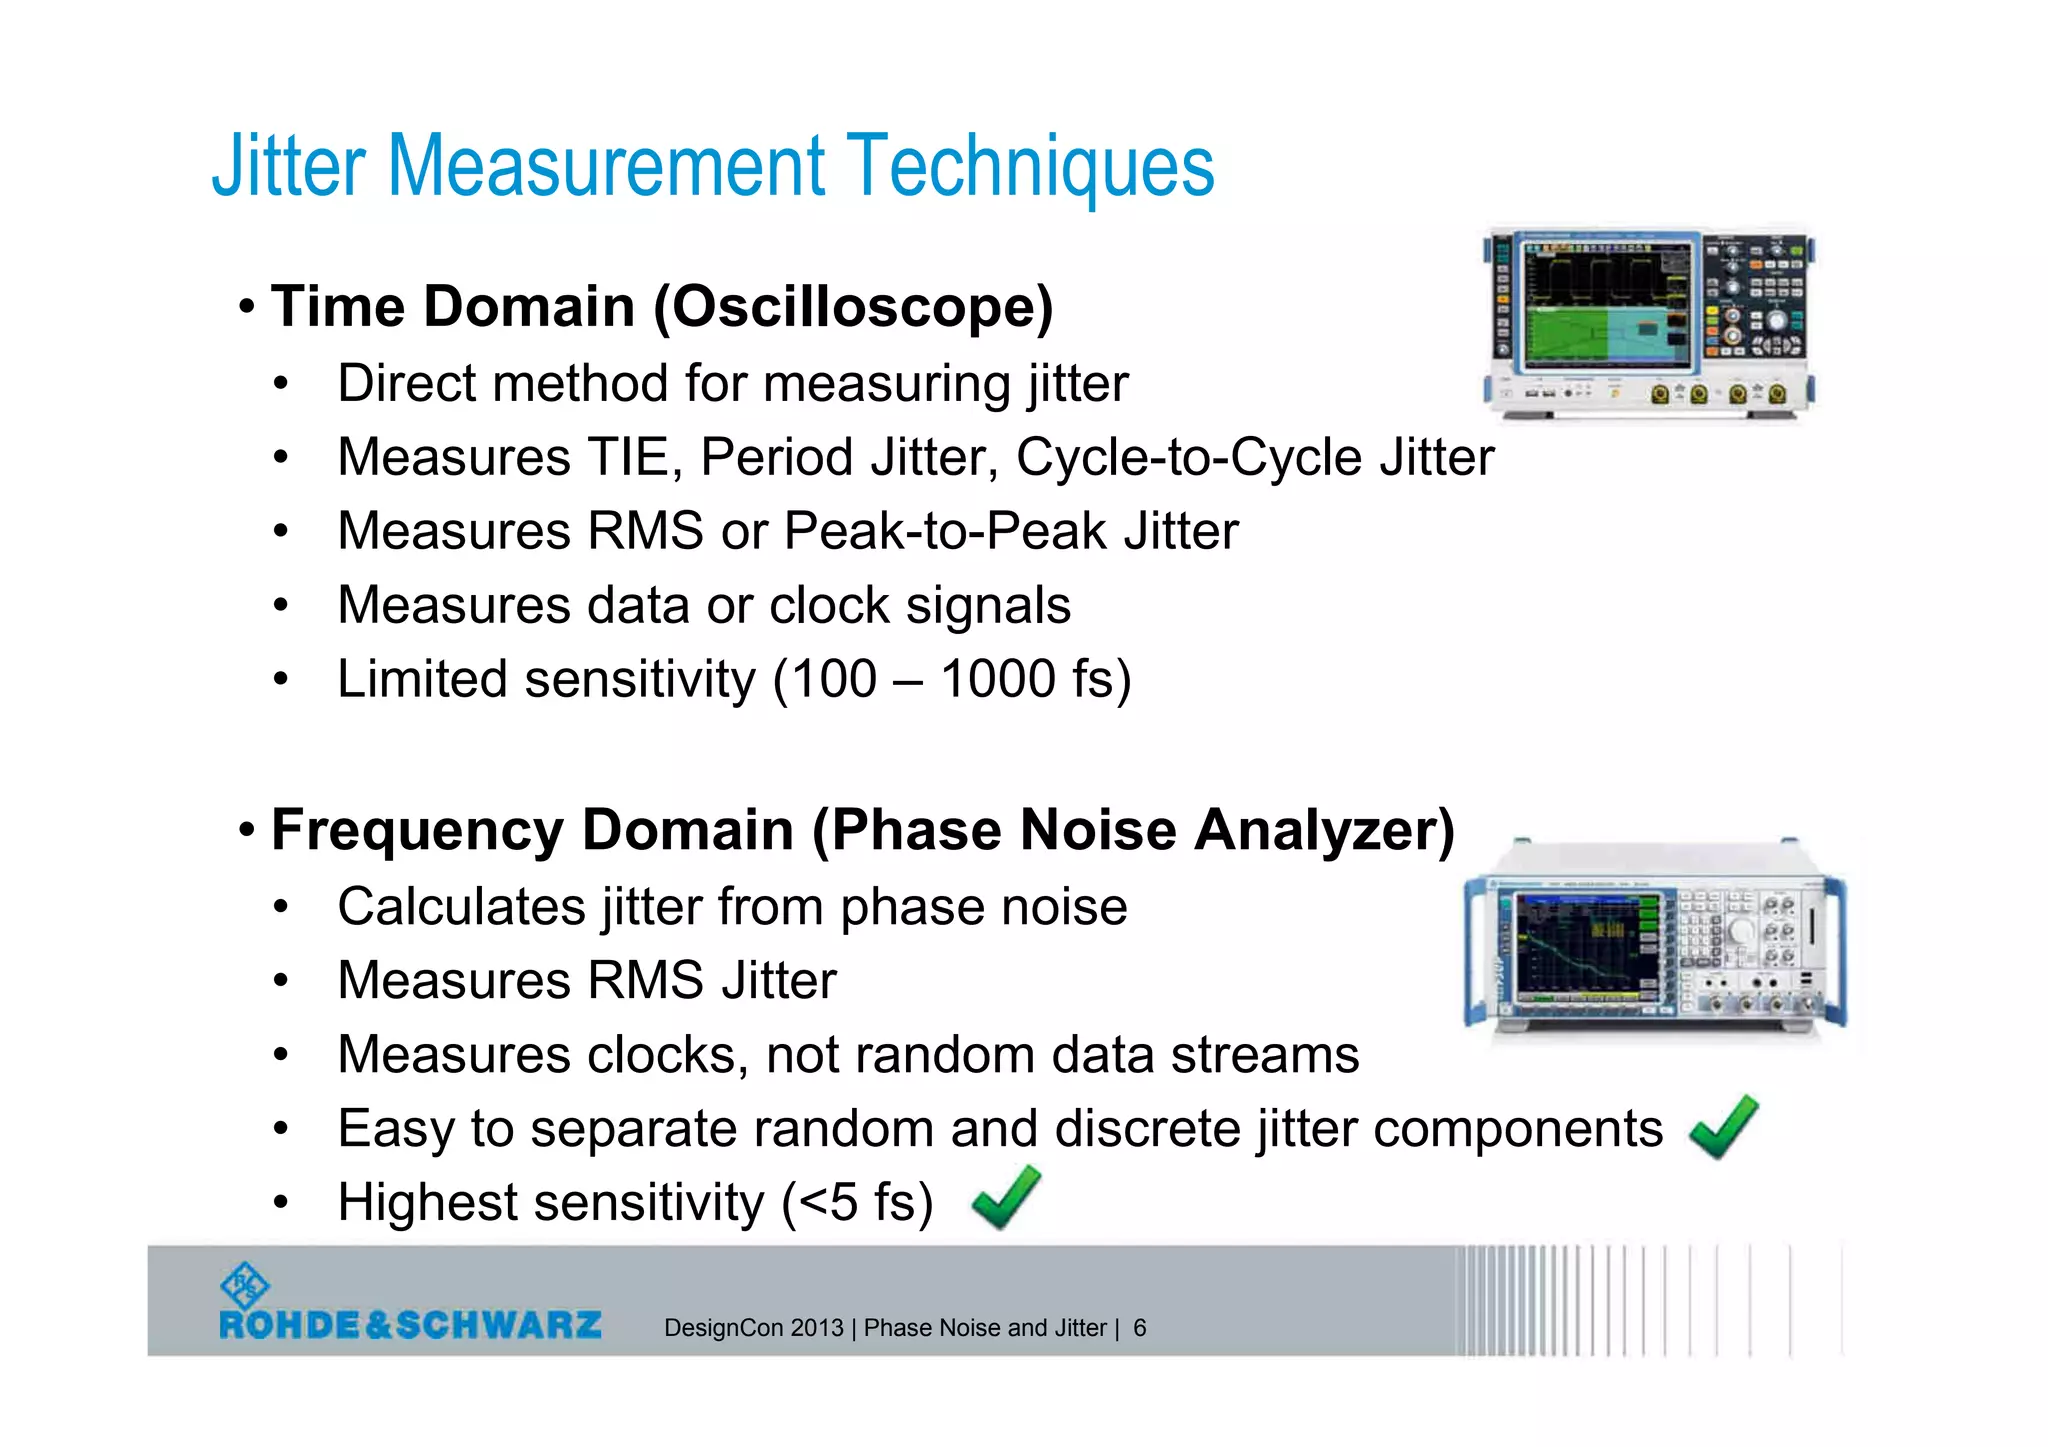
The document provides a comprehensive overview of phase noise and jitter measurements, including definitions, types, and measurement techniques for jitter in clock and data signals. It explains the relationship between phase noise and jitter, discusses instruments used for measurement, and outlines methods for calculating total jitter components. Additionally, the document highlights measurement limitations and offers insights into practical applications and calculations related to jitter specifications.