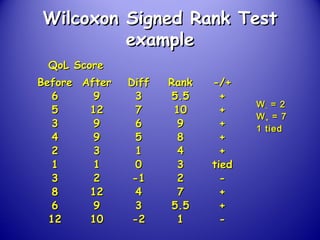
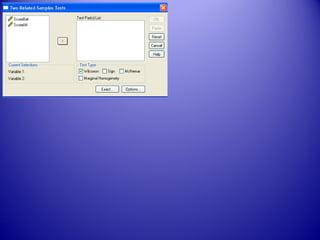
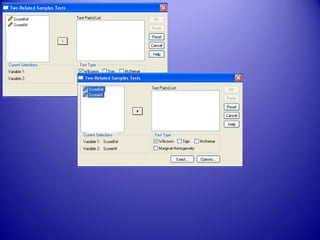
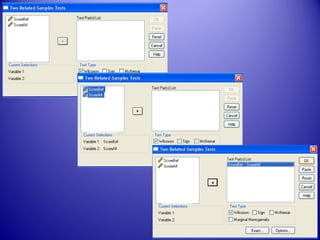
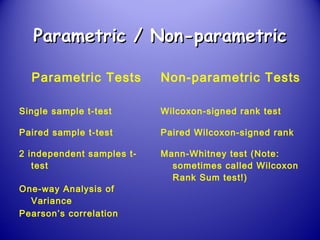
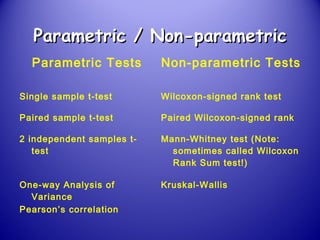
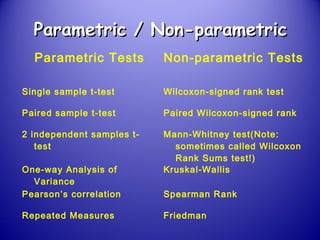
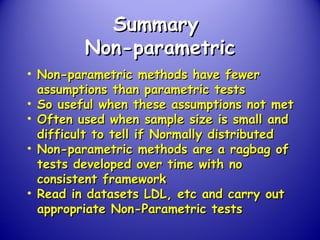
Non-Parametric
Methods
Peter T. Donnan
Professor of Epidemiology and Biostatistics
Statistics for HealthStatistics for Health
ResearchResearch
Objectives of PresentationObjectives of Presentation
• IntroductionIntroduction
• Ranks & MedianRanks & Median
• Paired Wilcoxon Signed RankPaired Wilcoxon Signed Rank
• Mann-Whitney test (or WilcoxonMann-Whitney test (or Wilcoxon
Rank Sum test)Rank Sum test)
• Spearman’s Rank CorrelationSpearman’s Rank Correlation
CoefficientCoefficient
• Others….Others….
What are non-parametric tests?What are non-parametric tests?
• ‘‘Parametric’ tests involve estimatingParametric’ tests involve estimating
parameters such as the mean, andparameters such as the mean, and
assume that distribution of sampleassume that distribution of sample
means are ‘normally’ distributedmeans are ‘normally’ distributed
• Often data does not follow a NormalOften data does not follow a Normal
distribution eg number of cigarettesdistribution eg number of cigarettes
smoked, cost to NHS etc.smoked, cost to NHS etc.
• Positively skewed distributionsPositively skewed distributions
A positively skewed distributionA positively skewed distribution
0 10 20 30 40 50
Units of alcohol per week
0
5
10
15
20
Frequency
Mean = 8.03
Std. Dev. = 12.952
N = 30
What are non-parametric tests?What are non-parametric tests?
• ‘‘Non-parametric’ tests were developed forNon-parametric’ tests were developed for
these situations where fewer assumptionsthese situations where fewer assumptions
have to be madehave to be made
• Sometimes called Distribution-free testsSometimes called Distribution-free tests
• NP tests STILL have assumptions but areNP tests STILL have assumptions but are
less stringentless stringent
• NP tests can be applied to Normal data butNP tests can be applied to Normal data but
parametric tests have greater powerparametric tests have greater power IFIF
assumptions metassumptions met
RanksRanks
• Practical differences betweenPractical differences between
parametric and NP are that NPparametric and NP are that NP
methods use themethods use the ranksranks of valuesof values
rather than the actual valuesrather than the actual values
• E.g.E.g.
1,2,3,4,5,7,13,22,38,45 - actual1,2,3,4,5,7,13,22,38,45 - actual
1,2,3,4,5,6, 7, 8, 9,10 - rank1,2,3,4,5,6, 7, 8, 9,10 - rank
MedianMedian
• The median is the value above andThe median is the value above and
below which 50% of the data lie.below which 50% of the data lie.
• If the data is ranked in order, it isIf the data is ranked in order, it is
the middle valuethe middle value
• In symmetric distributions the meanIn symmetric distributions the mean
and median are the sameand median are the same
• In skewed distributions, median moreIn skewed distributions, median more
appropriateappropriate
MedianMedian
• BPs:BPs:
135, 138, 140, 140, 141, 142, 143135, 138, 140, 140, 141, 142, 143
Median=Median=
MedianMedian
• BPs:BPs:
135, 138, 140, 140, 141, 142, 143135, 138, 140, 140, 141, 142, 143
Median=140Median=140
• No. of cigarettes smoked:No. of cigarettes smoked:
0, 1, 2, 2, 2, 3, 5, 5, 8, 100, 1, 2, 2, 2, 3, 5, 5, 8, 10
Median=Median=
MedianMedian
• BPs:BPs:
135, 138, 140, 140, 141, 142, 143135, 138, 140, 140, 141, 142, 143
Median=140Median=140
• No. of cigarettes smoked:No. of cigarettes smoked:
0, 1, 2, 2, 2, 3, 5, 5, 8, 100, 1, 2, 2, 2, 3, 5, 5, 8, 10
Median=2.5Median=2.5
T-testT-test
• T-test used to test whether theT-test used to test whether the
mean of a sample is sig differentmean of a sample is sig different
from a hypothesised sample meanfrom a hypothesised sample mean
• T-test relies on the sample beingT-test relies on the sample being
drawn from a normally distributeddrawn from a normally distributed
populationpopulation
• If sampleIf sample notnot Normal then use theNormal then use the
Wilcoxon Signed Rank Test as anWilcoxon Signed Rank Test as an
alternativealternative
Wilcoxon testsWilcoxon tests
• Frank Wilcoxon was ChemistFrank Wilcoxon was Chemist
In USA who wanted to developIn USA who wanted to develop
test similar to t-test but withouttest similar to t-test but without
requirement of Normal distributionrequirement of Normal distribution
• Presented paper in 1945Presented paper in 1945
• Wilcoxon Signed RankWilcoxon Signed Rank ΞΞ paired t-testpaired t-test
• Wilcoxon Rank SumWilcoxon Rank Sum ΞΞ independent t-independent t-
testtest
Wilcoxon Signed Rank TestWilcoxon Signed Rank Test
• NP test relating to the median asNP test relating to the median as
measure of central tendencymeasure of central tendency
• The ranks of the absoluteThe ranks of the absolute
differences between the data anddifferences between the data and
the hypothesised median calculatedthe hypothesised median calculated
• The ranks for the negative and theThe ranks for the negative and the
positive differences are then summedpositive differences are then summed
separately (Wseparately (W-- and Wand W++ resp.)resp.)
• The minimum of these is the testThe minimum of these is the test
statistic, Wstatistic, W
Wilcoxon Signed Rank TestWilcoxon Signed Rank Test
Normal ApproximationNormal Approximation
• As the number of ranks (n) becomesAs the number of ranks (n) becomes
larger, the distribution of W becomeslarger, the distribution of W becomes
approximately Normalapproximately Normal
• Generally, if n>20Generally, if n>20
• Mean W=n(n+1)/4Mean W=n(n+1)/4
• Variance W=n(n+1)(2n+1)/24Variance W=n(n+1)(2n+1)/24
• Z=(W-mean W)/SD(W)Z=(W-mean W)/SD(W)
Wilcoxon Signed Rank TestWilcoxon Signed Rank Test
AssumptionsAssumptions
• Population should be approximatelyPopulation should be approximately
symmetricalsymmetrical butbut need not be Normalneed not be Normal
• Results must be classified as eitherResults must be classified as either
being greater than or less than thebeing greater than or less than the
median ie exclude results=medianmedian ie exclude results=median
• Can be used for small or largeCan be used for small or large
samplessamples
Paired samples t-testPaired samples t-test
• DisadvantageDisadvantage: Assumes data are a: Assumes data are a
random sample from a populationrandom sample from a population
which is Normally distributedwhich is Normally distributed
• AdvantageAdvantage: Uses all detail of the: Uses all detail of the
available data, and if the data areavailable data, and if the data are
normally distributed it is the mostnormally distributed it is the most
powerful testpowerful test
The Wilcoxon Signed Rank TestThe Wilcoxon Signed Rank Test
for Paired Comparisonsfor Paired Comparisons
• DisadvantageDisadvantage: Only the sign (+ or -): Only the sign (+ or -)
of any change is analysedof any change is analysed
• AdvantageAdvantage: Easy to carry out and: Easy to carry out and
data can be analysed from anydata can be analysed from any
distribution or populationdistribution or population
Paired And Not PairedPaired And Not Paired
ComparisonsComparisons
• If you have the same sampleIf you have the same sample
measured on two separate occasionsmeasured on two separate occasions
then this is a paired comparisonthen this is a paired comparison
• Two independent samples is not aTwo independent samples is not a
paired comparisonpaired comparison
• Different samples which areDifferent samples which are
‘matched’ by age and gender are‘matched’ by age and gender are
pairedpaired
The Wilcoxon Signed Rank TestThe Wilcoxon Signed Rank Test
for Paired Comparisonsfor Paired Comparisons
• Similar calculation to the WilcoxonSimilar calculation to the Wilcoxon
Signed Rank test, only theSigned Rank test, only the
differences in the paired results aredifferences in the paired results are
rankedranked
• Example using SPSS:Example using SPSS:
A group of 10 patients with chronicA group of 10 patients with chronic
anxiety receive sessions of cognitiveanxiety receive sessions of cognitive
therapy. Quality of Life scores aretherapy. Quality of Life scores are
measured before and after therapy.measured before and after therapy.
QoL ScoreQoL Score
BeforeBefore AfterAfter DiffDiff RankRank -/+-/+
66 99 33 5.55.5 ++
55 1212 77 1010 ++
33 99 66 99 ++
44 99 55 88 ++
22 33 11 44 ++
11 11 00 33 tiedtied
33 22 -1-1 22 --
88 1212 44 77 ++
66 99 33 5.55.5 ++
1212 1010 -2-2 11 --
Wilcoxon Signed Rank TestWilcoxon Signed Rank Test
exampleexample
WW-- = 2= 2
WW++ = 7= 7
1 tied1 tied
Wilcoxon Signed Rank TestWilcoxon Signed Rank Test
exampleexample
p < 0.05
SPSS OutputSPSS Output
Wilcoxon testsWilcoxon tests
• Frank Wilcoxon was ChemistFrank Wilcoxon was Chemist
In USA who wanted to developIn USA who wanted to develop
test similar to t-test but withouttest similar to t-test but without
requirement of Normal distributionrequirement of Normal distribution
• Presented paper in 1945Presented paper in 1945
• Wilcoxon Signed RankWilcoxon Signed Rank ΞΞ paired t-testpaired t-test
• Wilcoxon Rank SumWilcoxon Rank Sum ΞΞ independent t-independent t-
testtest
Mann-Whitney testMann-Whitney test ΞΞ WilcoxonWilcoxon
Rank SumRank Sum
• Used when we want to compare twoUsed when we want to compare two
unrelated or INDEPENDENT groupsunrelated or INDEPENDENT groups
• For parametric data you would useFor parametric data you would use
the unpaired (independent) samplesthe unpaired (independent) samples
t-testt-test
• The assumptions of the t-testThe assumptions of the t-test
were:were:
1.1. The distribution of the measure in eachThe distribution of the measure in each
group is approx Normally distributedgroup is approx Normally distributed
2.2. The variances are similarThe variances are similar
HB Mann
Example (1)Example (1)
The following data shows the numberThe following data shows the number
of alcohol units per week collected in aof alcohol units per week collected in a
survey:survey:
Men (n=13): 0,0,1,5,10,30,45,5,5,1,0,0,0Men (n=13): 0,0,1,5,10,30,45,5,5,1,0,0,0
Women (n=14): 0,0,0,0,1,5,4,1,0,0,3,20,0,0Women (n=14): 0,0,0,0,1,5,4,1,0,0,3,20,0,0
Is the amount greater in men comparedIs the amount greater in men compared
to women?to women?
Example (2)Example (2)
How would you test whether theHow would you test whether the
distributions in both groups aredistributions in both groups are
approximately Normally distributed?approximately Normally distributed?
 Plot histogramsPlot histograms
 Stem and leaf plotStem and leaf plot
 Box-plotBox-plot
 Q-Q or P-P plotQ-Q or P-P plot
Male Female
Gender
0
10
20
30
40
50
Unitsofalcoholperweek
25
6
7
Boxplots of alcohol units per week by genderBoxplots of alcohol units per week by gender
Example (3)Example (3)
Are those distributions symmetrical?Are those distributions symmetrical?
Definitely not!Definitely not!
They are both highly skewed so notThey are both highly skewed so not
Normal. If transformation is still not NormalNormal. If transformation is still not Normal
then use non-parametric test – Mann Whitneythen use non-parametric test – Mann Whitney
Suggests perhaps that males tend toSuggests perhaps that males tend to
have a higher intake than women.have a higher intake than women.
Mann-Whitney on SPSSMann-Whitney on SPSS
Normal approx (NS)
Mann-Whitney (NS)
Spearman Rank CorrelationSpearman Rank Correlation
• Method for investigating theMethod for investigating the
relationship between 2 measuredrelationship between 2 measured
variablesvariables
• Non-parametric equivalent toNon-parametric equivalent to
Pearson correlationPearson correlation
• Variables are either non-Normal orVariables are either non-Normal or
measured on ordinal scalemeasured on ordinal scale
Spearman Rank CorrelationSpearman Rank Correlation
ExampleExample
A researcher wishes to assess whetherA researcher wishes to assess whether
the distance to general practicethe distance to general practice
influences the time of diagnosis ofinfluences the time of diagnosis of
colorectal cancer.colorectal cancer.
The null hypothesis would be thatThe null hypothesis would be that
distance is not associated with time todistance is not associated with time to
diagnosis. Data collected for 7 patientsdiagnosis. Data collected for 7 patients
Distance (km)Distance (km)
Time to diagnosisTime to diagnosis
(weeks)(weeks)
55 66
22 44
44 33
88 44
2020 55
4545 55
1010 44
Distance from GP and time to diagnosisDistance from GP and time to diagnosis
ScatterplotScatterplot
Distance from GP and time to diagnosisDistance from GP and time to diagnosis
DistanceDistance
(km)(km)
TimeTime
(weeks)(weeks)
Rank forRank for
distancedistance
Rank forRank for
timetime
DifferenceDifference
in Ranksin Ranks
DD22
22 44 11 33 -2-2 44
44 33 22 11 11 11
55 66 33 77 -4-4 1616
88 44 44 33 11 11
1010 44 55 33 22 44
2020 55 66 5.55.5 0.50.5 0.250.25
4545 55 77 5.55.5 1.51.5 2.252.25
Total = 0Total = 0 ∑∑dd22
=28.5=28.5
Spearman Rank CorrelationSpearman Rank Correlation
ExampleExample
The formula for Spearman’s rankThe formula for Spearman’s rank
correlation is:correlation is:
where n is the number of pairswhere n is the number of pairs
( )1
6
1 2
2
−
−=
∑
nn
d
rs
Spearman’s in SPSSSpearman’s in SPSS
Spearman Rank CorrelationSpearman Rank Correlation
ExampleExample
In our example, rIn our example, rss=0.468=0.468
In SPSS we can see that this value isIn SPSS we can see that this value is
not significant, ie.p=0.29not significant, ie.p=0.29
Therefore there is no significantTherefore there is no significant
relationship between the distance to arelationship between the distance to a
GP and the time to diagnosis but noteGP and the time to diagnosis but note
that correlation is quite high!that correlation is quite high!
Spearman Rank CorrelationSpearman Rank Correlation
• Correlations lie between –1 to +1Correlations lie between –1 to +1
• A correlation coefficient close toA correlation coefficient close to
zero indicates weak or nozero indicates weak or no
correlationcorrelation
• A significant rA significant rss value depends onvalue depends on
sample size and tells you that itssample size and tells you that its
unlikely these results have arisen byunlikely these results have arisen by
chancechance
• Correlation does NOT measureCorrelation does NOT measure
causality only associationcausality only association
Chi-squared testChi-squared test
• Used when comparing 2 or moreUsed when comparing 2 or more
groups of categorical or nominalgroups of categorical or nominal
data (as opposed to measured data)data (as opposed to measured data)
• Already covered!Already covered!
• In SPSS Chi-squared test is test ofIn SPSS Chi-squared test is test of
observed vs. expected in singleobserved vs. expected in single
categorical variablecategorical variable
More than 2 groupsMore than 2 groups
• So far we have been comparing 2So far we have been comparing 2
groupsgroups
• If we have 3 or more independentIf we have 3 or more independent
groups and data is not Normal wegroups and data is not Normal we
need NP equivalent to ANOVAneed NP equivalent to ANOVA
• If independent samples useIf independent samples use Kruskal-Kruskal-
WallisWallis
• If related samples useIf related samples use FriedmanFriedman
• Same assumptions as beforeSame assumptions as before
More than 2 groupsMore than 2 groups
Parametric related to Non-Parametric related to Non-
parametric testparametric test
Parametric TestsParametric Tests Non-parametric TestsNon-parametric Tests
Single sample t-testSingle sample t-test
Paired sample t-testPaired sample t-test
2 independent samples t-2 independent samples t-
testtest
One-way Analysis ofOne-way Analysis of
VarianceVariance
Pearson’s correlationPearson’s correlation
Parametric / Non-parametricParametric / Non-parametric
Parametric Tests Non-parametric Tests
Single sample t-test Wilcoxon-signed rank test
Paired sample t-test
2 independent samples t-
test
One-way Analysis of
Variance
Pearson’s correlation
Parametric / Non-parametricParametric / Non-parametric
Parametric Tests Non-parametric Tests
Single sample t-test Wilcoxon-signed rank test
Paired sample t-test Paired Wilcoxon-signed rank
2 independent samples t-
test
One-way Analysis of
Variance
Pearson’s correlation
Parametric / Non-parametricParametric / Non-parametric
Parametric Tests Non-parametric Tests
Single sample t-test Wilcoxon-signed rank test
Paired sample t-test Paired Wilcoxon-signed rank
2 independent samples t-
test
Mann-Whitney test (Note:
sometimes called Wilcoxon
Rank Sum test!)
One-way Analysis of
Variance
Kruskal-Wallis
Pearson’s correlation
Parametric / Non-parametricParametric / Non-parametric
Parametric Tests Non-parametric Tests
Single sample t-test Wilcoxon-signed rank test
Paired sample t-test Paired Wilcoxon-signed rank
2 independent samples t-
test
Mann-Whitney test(Note:
sometimes called Wilcoxon
Rank Sums test!)
One-way Analysis of
Variance
Kruskal-Wallis
Pearson’s correlation Spearman Rank
Repeated Measures Friedman
SummarySummary
Non-parametricNon-parametric
• Non-parametric methods have fewerNon-parametric methods have fewer
assumptions than parametric testsassumptions than parametric tests
• So useful when these assumptions not metSo useful when these assumptions not met
• Often used when sample size is small andOften used when sample size is small and
difficult to tell if Normally distributeddifficult to tell if Normally distributed
• Non-parametric methods are a ragbag ofNon-parametric methods are a ragbag of
tests developed over time with notests developed over time with no
consistent frameworkconsistent framework
• Read in datasets LDL, etc and carry outRead in datasets LDL, etc and carry out
appropriate Non-Parametric testsappropriate Non-Parametric tests
ReferencesReferences
Corder GW, Foreman DI. Non-parametric Statistics for
Non-Statisticians. Wiley, 2009.
Nonparametric statistics for the behavioural Sciences.
Siegel S, Castellan NJ, Jr. McGraw-Hill, 1988 (first edition
was 1956)

Non parametric methods

  • 1.
    Non-Parametric Methods Peter T. Donnan Professorof Epidemiology and Biostatistics Statistics for HealthStatistics for Health ResearchResearch
  • 2.
    Objectives of PresentationObjectivesof Presentation • IntroductionIntroduction • Ranks & MedianRanks & Median • Paired Wilcoxon Signed RankPaired Wilcoxon Signed Rank • Mann-Whitney test (or WilcoxonMann-Whitney test (or Wilcoxon Rank Sum test)Rank Sum test) • Spearman’s Rank CorrelationSpearman’s Rank Correlation CoefficientCoefficient • Others….Others….
  • 3.
    What are non-parametrictests?What are non-parametric tests? • ‘‘Parametric’ tests involve estimatingParametric’ tests involve estimating parameters such as the mean, andparameters such as the mean, and assume that distribution of sampleassume that distribution of sample means are ‘normally’ distributedmeans are ‘normally’ distributed • Often data does not follow a NormalOften data does not follow a Normal distribution eg number of cigarettesdistribution eg number of cigarettes smoked, cost to NHS etc.smoked, cost to NHS etc. • Positively skewed distributionsPositively skewed distributions
  • 4.
    A positively skeweddistributionA positively skewed distribution 0 10 20 30 40 50 Units of alcohol per week 0 5 10 15 20 Frequency Mean = 8.03 Std. Dev. = 12.952 N = 30
  • 5.
    What are non-parametrictests?What are non-parametric tests? • ‘‘Non-parametric’ tests were developed forNon-parametric’ tests were developed for these situations where fewer assumptionsthese situations where fewer assumptions have to be madehave to be made • Sometimes called Distribution-free testsSometimes called Distribution-free tests • NP tests STILL have assumptions but areNP tests STILL have assumptions but are less stringentless stringent • NP tests can be applied to Normal data butNP tests can be applied to Normal data but parametric tests have greater powerparametric tests have greater power IFIF assumptions metassumptions met
  • 6.
    RanksRanks • Practical differencesbetweenPractical differences between parametric and NP are that NPparametric and NP are that NP methods use themethods use the ranksranks of valuesof values rather than the actual valuesrather than the actual values • E.g.E.g. 1,2,3,4,5,7,13,22,38,45 - actual1,2,3,4,5,7,13,22,38,45 - actual 1,2,3,4,5,6, 7, 8, 9,10 - rank1,2,3,4,5,6, 7, 8, 9,10 - rank
  • 7.
    MedianMedian • The medianis the value above andThe median is the value above and below which 50% of the data lie.below which 50% of the data lie. • If the data is ranked in order, it isIf the data is ranked in order, it is the middle valuethe middle value • In symmetric distributions the meanIn symmetric distributions the mean and median are the sameand median are the same • In skewed distributions, median moreIn skewed distributions, median more appropriateappropriate
  • 8.
    MedianMedian • BPs:BPs: 135, 138,140, 140, 141, 142, 143135, 138, 140, 140, 141, 142, 143 Median=Median=
  • 9.
    MedianMedian • BPs:BPs: 135, 138,140, 140, 141, 142, 143135, 138, 140, 140, 141, 142, 143 Median=140Median=140 • No. of cigarettes smoked:No. of cigarettes smoked: 0, 1, 2, 2, 2, 3, 5, 5, 8, 100, 1, 2, 2, 2, 3, 5, 5, 8, 10 Median=Median=
  • 10.
    MedianMedian • BPs:BPs: 135, 138,140, 140, 141, 142, 143135, 138, 140, 140, 141, 142, 143 Median=140Median=140 • No. of cigarettes smoked:No. of cigarettes smoked: 0, 1, 2, 2, 2, 3, 5, 5, 8, 100, 1, 2, 2, 2, 3, 5, 5, 8, 10 Median=2.5Median=2.5
  • 11.
    T-testT-test • T-test usedto test whether theT-test used to test whether the mean of a sample is sig differentmean of a sample is sig different from a hypothesised sample meanfrom a hypothesised sample mean • T-test relies on the sample beingT-test relies on the sample being drawn from a normally distributeddrawn from a normally distributed populationpopulation • If sampleIf sample notnot Normal then use theNormal then use the Wilcoxon Signed Rank Test as anWilcoxon Signed Rank Test as an alternativealternative
  • 12.
    Wilcoxon testsWilcoxon tests •Frank Wilcoxon was ChemistFrank Wilcoxon was Chemist In USA who wanted to developIn USA who wanted to develop test similar to t-test but withouttest similar to t-test but without requirement of Normal distributionrequirement of Normal distribution • Presented paper in 1945Presented paper in 1945 • Wilcoxon Signed RankWilcoxon Signed Rank ΞΞ paired t-testpaired t-test • Wilcoxon Rank SumWilcoxon Rank Sum ΞΞ independent t-independent t- testtest
  • 13.
    Wilcoxon Signed RankTestWilcoxon Signed Rank Test • NP test relating to the median asNP test relating to the median as measure of central tendencymeasure of central tendency • The ranks of the absoluteThe ranks of the absolute differences between the data anddifferences between the data and the hypothesised median calculatedthe hypothesised median calculated • The ranks for the negative and theThe ranks for the negative and the positive differences are then summedpositive differences are then summed separately (Wseparately (W-- and Wand W++ resp.)resp.) • The minimum of these is the testThe minimum of these is the test statistic, Wstatistic, W
  • 14.
    Wilcoxon Signed RankTestWilcoxon Signed Rank Test Normal ApproximationNormal Approximation • As the number of ranks (n) becomesAs the number of ranks (n) becomes larger, the distribution of W becomeslarger, the distribution of W becomes approximately Normalapproximately Normal • Generally, if n>20Generally, if n>20 • Mean W=n(n+1)/4Mean W=n(n+1)/4 • Variance W=n(n+1)(2n+1)/24Variance W=n(n+1)(2n+1)/24 • Z=(W-mean W)/SD(W)Z=(W-mean W)/SD(W)
  • 15.
    Wilcoxon Signed RankTestWilcoxon Signed Rank Test AssumptionsAssumptions • Population should be approximatelyPopulation should be approximately symmetricalsymmetrical butbut need not be Normalneed not be Normal • Results must be classified as eitherResults must be classified as either being greater than or less than thebeing greater than or less than the median ie exclude results=medianmedian ie exclude results=median • Can be used for small or largeCan be used for small or large samplessamples
  • 16.
    Paired samples t-testPairedsamples t-test • DisadvantageDisadvantage: Assumes data are a: Assumes data are a random sample from a populationrandom sample from a population which is Normally distributedwhich is Normally distributed • AdvantageAdvantage: Uses all detail of the: Uses all detail of the available data, and if the data areavailable data, and if the data are normally distributed it is the mostnormally distributed it is the most powerful testpowerful test
  • 17.
    The Wilcoxon SignedRank TestThe Wilcoxon Signed Rank Test for Paired Comparisonsfor Paired Comparisons • DisadvantageDisadvantage: Only the sign (+ or -): Only the sign (+ or -) of any change is analysedof any change is analysed • AdvantageAdvantage: Easy to carry out and: Easy to carry out and data can be analysed from anydata can be analysed from any distribution or populationdistribution or population
  • 18.
    Paired And NotPairedPaired And Not Paired ComparisonsComparisons • If you have the same sampleIf you have the same sample measured on two separate occasionsmeasured on two separate occasions then this is a paired comparisonthen this is a paired comparison • Two independent samples is not aTwo independent samples is not a paired comparisonpaired comparison • Different samples which areDifferent samples which are ‘matched’ by age and gender are‘matched’ by age and gender are pairedpaired
  • 19.
    The Wilcoxon SignedRank TestThe Wilcoxon Signed Rank Test for Paired Comparisonsfor Paired Comparisons • Similar calculation to the WilcoxonSimilar calculation to the Wilcoxon Signed Rank test, only theSigned Rank test, only the differences in the paired results aredifferences in the paired results are rankedranked • Example using SPSS:Example using SPSS: A group of 10 patients with chronicA group of 10 patients with chronic anxiety receive sessions of cognitiveanxiety receive sessions of cognitive therapy. Quality of Life scores aretherapy. Quality of Life scores are measured before and after therapy.measured before and after therapy.
  • 20.
    QoL ScoreQoL Score BeforeBeforeAfterAfter DiffDiff RankRank -/+-/+ 66 99 33 5.55.5 ++ 55 1212 77 1010 ++ 33 99 66 99 ++ 44 99 55 88 ++ 22 33 11 44 ++ 11 11 00 33 tiedtied 33 22 -1-1 22 -- 88 1212 44 77 ++ 66 99 33 5.55.5 ++ 1212 1010 -2-2 11 -- Wilcoxon Signed Rank TestWilcoxon Signed Rank Test exampleexample WW-- = 2= 2 WW++ = 7= 7 1 tied1 tied
  • 21.
    Wilcoxon Signed RankTestWilcoxon Signed Rank Test exampleexample
  • 25.
    p < 0.05 SPSSOutputSPSS Output
  • 26.
    Wilcoxon testsWilcoxon tests •Frank Wilcoxon was ChemistFrank Wilcoxon was Chemist In USA who wanted to developIn USA who wanted to develop test similar to t-test but withouttest similar to t-test but without requirement of Normal distributionrequirement of Normal distribution • Presented paper in 1945Presented paper in 1945 • Wilcoxon Signed RankWilcoxon Signed Rank ΞΞ paired t-testpaired t-test • Wilcoxon Rank SumWilcoxon Rank Sum ΞΞ independent t-independent t- testtest
  • 27.
    Mann-Whitney testMann-Whitney testΞΞ WilcoxonWilcoxon Rank SumRank Sum • Used when we want to compare twoUsed when we want to compare two unrelated or INDEPENDENT groupsunrelated or INDEPENDENT groups • For parametric data you would useFor parametric data you would use the unpaired (independent) samplesthe unpaired (independent) samples t-testt-test • The assumptions of the t-testThe assumptions of the t-test were:were: 1.1. The distribution of the measure in eachThe distribution of the measure in each group is approx Normally distributedgroup is approx Normally distributed 2.2. The variances are similarThe variances are similar HB Mann
  • 28.
    Example (1)Example (1) Thefollowing data shows the numberThe following data shows the number of alcohol units per week collected in aof alcohol units per week collected in a survey:survey: Men (n=13): 0,0,1,5,10,30,45,5,5,1,0,0,0Men (n=13): 0,0,1,5,10,30,45,5,5,1,0,0,0 Women (n=14): 0,0,0,0,1,5,4,1,0,0,3,20,0,0Women (n=14): 0,0,0,0,1,5,4,1,0,0,3,20,0,0 Is the amount greater in men comparedIs the amount greater in men compared to women?to women?
  • 29.
    Example (2)Example (2) Howwould you test whether theHow would you test whether the distributions in both groups aredistributions in both groups are approximately Normally distributed?approximately Normally distributed?  Plot histogramsPlot histograms  Stem and leaf plotStem and leaf plot  Box-plotBox-plot  Q-Q or P-P plotQ-Q or P-P plot
  • 30.
    Male Female Gender 0 10 20 30 40 50 Unitsofalcoholperweek 25 6 7 Boxplots ofalcohol units per week by genderBoxplots of alcohol units per week by gender
  • 31.
    Example (3)Example (3) Arethose distributions symmetrical?Are those distributions symmetrical? Definitely not!Definitely not! They are both highly skewed so notThey are both highly skewed so not Normal. If transformation is still not NormalNormal. If transformation is still not Normal then use non-parametric test – Mann Whitneythen use non-parametric test – Mann Whitney Suggests perhaps that males tend toSuggests perhaps that males tend to have a higher intake than women.have a higher intake than women.
  • 32.
  • 34.
  • 35.
    Spearman Rank CorrelationSpearmanRank Correlation • Method for investigating theMethod for investigating the relationship between 2 measuredrelationship between 2 measured variablesvariables • Non-parametric equivalent toNon-parametric equivalent to Pearson correlationPearson correlation • Variables are either non-Normal orVariables are either non-Normal or measured on ordinal scalemeasured on ordinal scale
  • 36.
    Spearman Rank CorrelationSpearmanRank Correlation ExampleExample A researcher wishes to assess whetherA researcher wishes to assess whether the distance to general practicethe distance to general practice influences the time of diagnosis ofinfluences the time of diagnosis of colorectal cancer.colorectal cancer. The null hypothesis would be thatThe null hypothesis would be that distance is not associated with time todistance is not associated with time to diagnosis. Data collected for 7 patientsdiagnosis. Data collected for 7 patients
  • 37.
    Distance (km)Distance (km) Timeto diagnosisTime to diagnosis (weeks)(weeks) 55 66 22 44 44 33 88 44 2020 55 4545 55 1010 44 Distance from GP and time to diagnosisDistance from GP and time to diagnosis
  • 38.
  • 39.
    Distance from GPand time to diagnosisDistance from GP and time to diagnosis DistanceDistance (km)(km) TimeTime (weeks)(weeks) Rank forRank for distancedistance Rank forRank for timetime DifferenceDifference in Ranksin Ranks DD22 22 44 11 33 -2-2 44 44 33 22 11 11 11 55 66 33 77 -4-4 1616 88 44 44 33 11 11 1010 44 55 33 22 44 2020 55 66 5.55.5 0.50.5 0.250.25 4545 55 77 5.55.5 1.51.5 2.252.25 Total = 0Total = 0 ∑∑dd22 =28.5=28.5
  • 40.
    Spearman Rank CorrelationSpearmanRank Correlation ExampleExample The formula for Spearman’s rankThe formula for Spearman’s rank correlation is:correlation is: where n is the number of pairswhere n is the number of pairs ( )1 6 1 2 2 − −= ∑ nn d rs
  • 41.
  • 42.
  • 43.
    Spearman Rank CorrelationSpearmanRank Correlation ExampleExample In our example, rIn our example, rss=0.468=0.468 In SPSS we can see that this value isIn SPSS we can see that this value is not significant, ie.p=0.29not significant, ie.p=0.29 Therefore there is no significantTherefore there is no significant relationship between the distance to arelationship between the distance to a GP and the time to diagnosis but noteGP and the time to diagnosis but note that correlation is quite high!that correlation is quite high!
  • 44.
    Spearman Rank CorrelationSpearmanRank Correlation • Correlations lie between –1 to +1Correlations lie between –1 to +1 • A correlation coefficient close toA correlation coefficient close to zero indicates weak or nozero indicates weak or no correlationcorrelation • A significant rA significant rss value depends onvalue depends on sample size and tells you that itssample size and tells you that its unlikely these results have arisen byunlikely these results have arisen by chancechance • Correlation does NOT measureCorrelation does NOT measure causality only associationcausality only association
  • 45.
    Chi-squared testChi-squared test •Used when comparing 2 or moreUsed when comparing 2 or more groups of categorical or nominalgroups of categorical or nominal data (as opposed to measured data)data (as opposed to measured data) • Already covered!Already covered! • In SPSS Chi-squared test is test ofIn SPSS Chi-squared test is test of observed vs. expected in singleobserved vs. expected in single categorical variablecategorical variable
  • 46.
    More than 2groupsMore than 2 groups • So far we have been comparing 2So far we have been comparing 2 groupsgroups • If we have 3 or more independentIf we have 3 or more independent groups and data is not Normal wegroups and data is not Normal we need NP equivalent to ANOVAneed NP equivalent to ANOVA • If independent samples useIf independent samples use Kruskal-Kruskal- WallisWallis • If related samples useIf related samples use FriedmanFriedman • Same assumptions as beforeSame assumptions as before
  • 47.
    More than 2groupsMore than 2 groups
  • 48.
    Parametric related toNon-Parametric related to Non- parametric testparametric test Parametric TestsParametric Tests Non-parametric TestsNon-parametric Tests Single sample t-testSingle sample t-test Paired sample t-testPaired sample t-test 2 independent samples t-2 independent samples t- testtest One-way Analysis ofOne-way Analysis of VarianceVariance Pearson’s correlationPearson’s correlation
  • 49.
    Parametric / Non-parametricParametric/ Non-parametric Parametric Tests Non-parametric Tests Single sample t-test Wilcoxon-signed rank test Paired sample t-test 2 independent samples t- test One-way Analysis of Variance Pearson’s correlation
  • 50.
    Parametric / Non-parametricParametric/ Non-parametric Parametric Tests Non-parametric Tests Single sample t-test Wilcoxon-signed rank test Paired sample t-test Paired Wilcoxon-signed rank 2 independent samples t- test One-way Analysis of Variance Pearson’s correlation
  • 51.
    Parametric / Non-parametricParametric/ Non-parametric Parametric Tests Non-parametric Tests Single sample t-test Wilcoxon-signed rank test Paired sample t-test Paired Wilcoxon-signed rank 2 independent samples t- test Mann-Whitney test (Note: sometimes called Wilcoxon Rank Sum test!) One-way Analysis of Variance Pearson’s correlation
  • 52.
    Parametric / Non-parametricParametric/ Non-parametric Parametric Tests Non-parametric Tests Single sample t-test Wilcoxon-signed rank test Paired sample t-test Paired Wilcoxon-signed rank 2 independent samples t- test Mann-Whitney test (Note: sometimes called Wilcoxon Rank Sum test!) One-way Analysis of Variance Kruskal-Wallis Pearson’s correlation
  • 53.
    Parametric / Non-parametricParametric/ Non-parametric Parametric Tests Non-parametric Tests Single sample t-test Wilcoxon-signed rank test Paired sample t-test Paired Wilcoxon-signed rank 2 independent samples t- test Mann-Whitney test(Note: sometimes called Wilcoxon Rank Sums test!) One-way Analysis of Variance Kruskal-Wallis Pearson’s correlation Spearman Rank Repeated Measures Friedman
  • 54.
    SummarySummary Non-parametricNon-parametric • Non-parametric methodshave fewerNon-parametric methods have fewer assumptions than parametric testsassumptions than parametric tests • So useful when these assumptions not metSo useful when these assumptions not met • Often used when sample size is small andOften used when sample size is small and difficult to tell if Normally distributeddifficult to tell if Normally distributed • Non-parametric methods are a ragbag ofNon-parametric methods are a ragbag of tests developed over time with notests developed over time with no consistent frameworkconsistent framework • Read in datasets LDL, etc and carry outRead in datasets LDL, etc and carry out appropriate Non-Parametric testsappropriate Non-Parametric tests
  • 55.
    ReferencesReferences Corder GW, ForemanDI. Non-parametric Statistics for Non-Statisticians. Wiley, 2009. Nonparametric statistics for the behavioural Sciences. Siegel S, Castellan NJ, Jr. McGraw-Hill, 1988 (first edition was 1956)