This document discusses parametric and non-parametric statistical methods. It defines different levels of measurement and provides examples of parametric and non-parametric tests. Key points include:
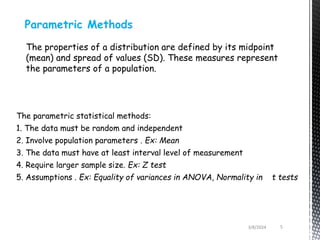
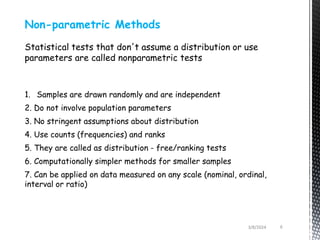
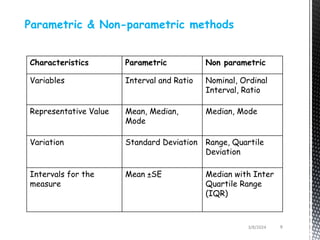
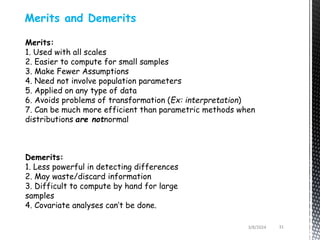
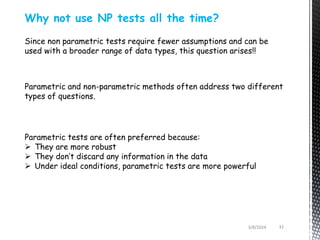
- Parametric tests assume normal distributions and make inferences about population parameters, while non-parametric tests do not require assumptions about the distribution and can be used on ordinal or nominal data.
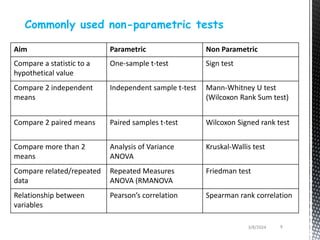
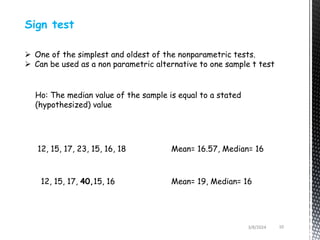
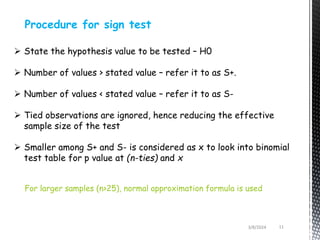
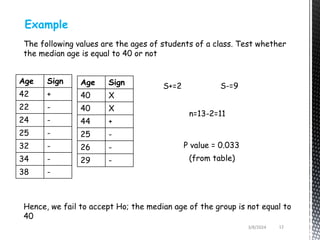
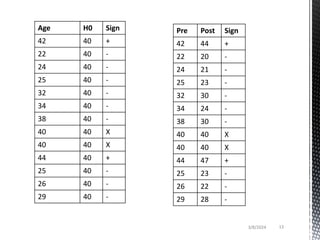
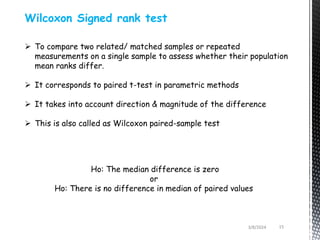
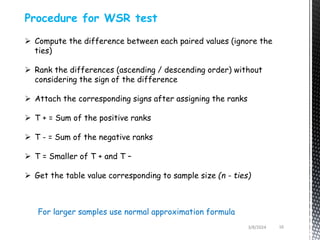
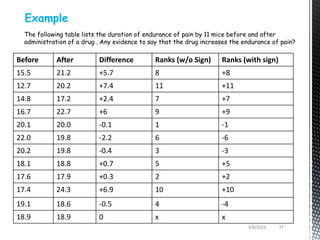
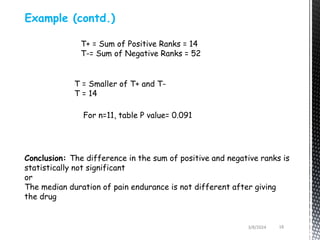
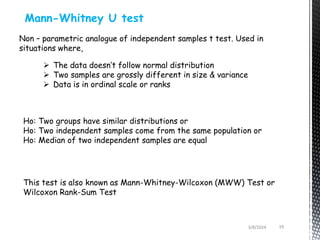
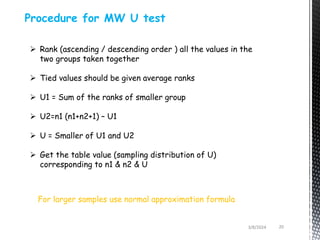
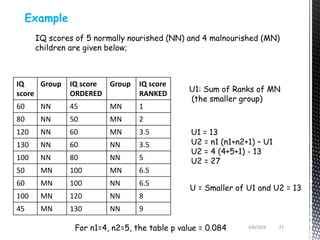
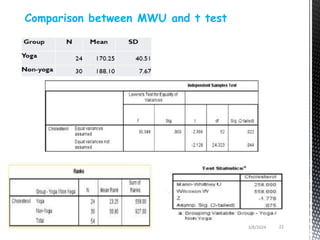
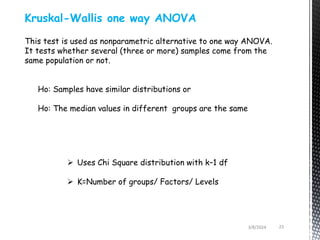
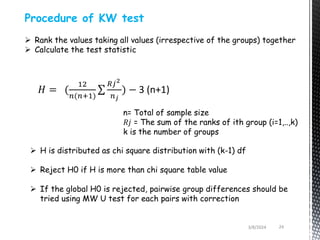
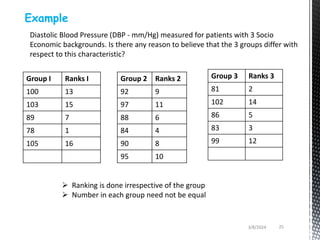
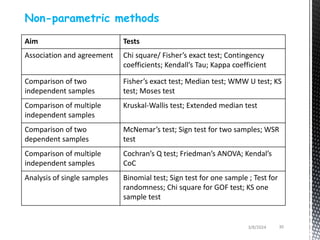
- Common non-parametric tests described are the sign test, Wilcoxon signed-rank test, Mann-Whitney U test, and Kruskal-Wallis one-way ANOVA. Examples are provided to demonstrate how to perform and interpret each test.
- Non-parametric tests are recommended when the data does not
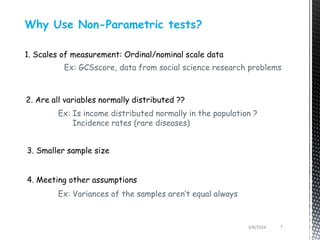


![Non_parametric_test-4[1].pptx -[1] 2.pptx](https://cdn.slidesharecdn.com/ss_thumbnails/nonparametrictest-41-260115135338-f2d1eaa3-thumbnail.jpg?width=640&height=640&fit=bounds)


