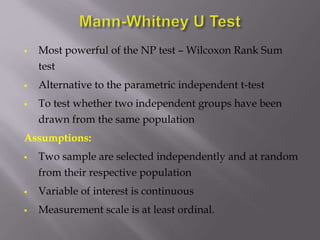
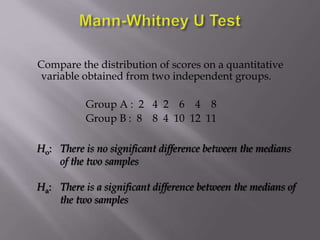
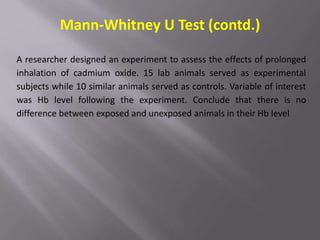
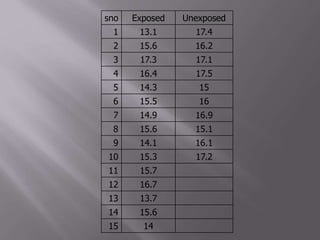
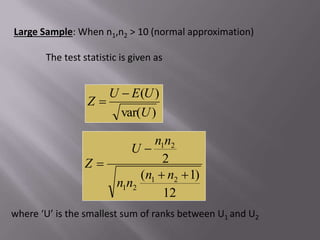
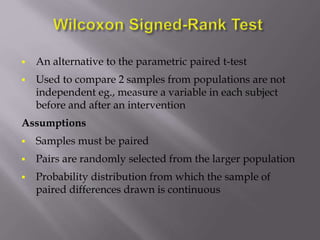
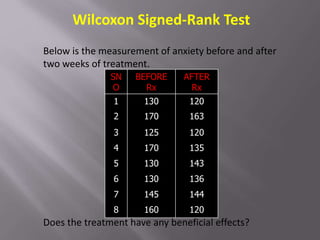
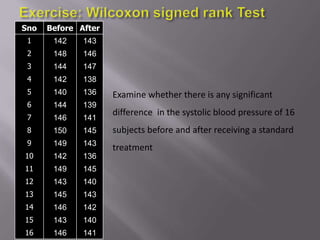
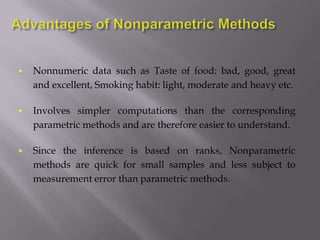
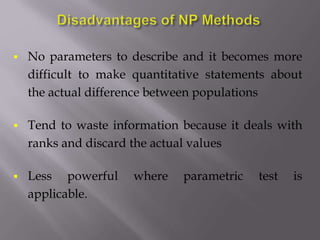
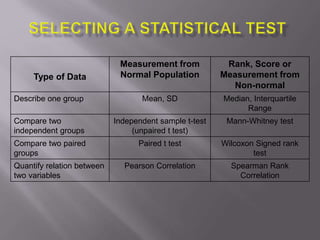
non-parametric test with examples and data problems
1.
2. No rigid assumptions about the distribution of the
populations - “Distribution-free tests”
Answers the same sort of questions as the parametric
test – for each Parametric tests (PT) there is an
alternative Non-Parametric Test (NP) Test
Applied to a wide variety of situations
continuous ordinal scores
3. Assumptions of parametric test are violated
Non-normal or skewed
Variance very high in relative to mean
Data is on an ordinal scale
Very few observations
4. Most powerful of the NP test – Wilcoxon Rank Sum
test
Alternative to the parametric independent t-test
To test whether two independent groups have been
drawn from the same population
Assumptions:
Two sample are selected independently and at random
from their respective population
Variable of interest is continuous
Measurement scale is at least ordinal.
5. Compare the distribution of scores on a quantitative
variable obtained from two independent groups.
Group A : 2 4 2 6 4 8
Group B : 8 8 4 10 12 11
Ho: There is no significant difference between the medians
of the two samples
Ha: There is a significant difference between the medians of
the two samples
6. Mann-Whitney U Test (contd.)
A researcher designed an experiment to assess the effects of prolonged
inhalation of cadmium oxide. 15 lab animals served as experimental
subjects while 10 similar animals served as controls. Variable of interest
was Hb level following the experiment. Conclude that there is no
difference between exposed and unexposed animals in their Hb level
9. Large Sample: When n1,n2 > 10 (normal approximation)
The test statistic is given as
12
)
1
(
2
2
1
2
1
2
1
n
n
n
n
n
n
U
Z
)
var(
)
(
U
U
E
U
Z
where ‘U’ is the smallest sum of ranks between U1 and U2
10. An alternative to the parametric paired t-test
Used to compare 2 samples from populations are not
independent eg., measure a variable in each subject
before and after an intervention
Assumptions
Samples must be paired
Pairs are randomly selected from the larger population
Probability distribution from which the sample of
paired differences drawn is continuous
11. Below is the measurement of anxiety before and after
two weeks of treatment.
SN
O
BEFORE
Rx
AFTER
Rx
1 130 120
2 170 163
3 125 120
4 170 135
5 130 143
6 130 136
7 145 144
8 160 120
Does the treatment have any beneficial effects?
Wilcoxon Signed-Rank Test
12. Examine whether there is any significant
difference in the systolic blood pressure of 16
subjects before and after receiving a standard
treatment
Sno Before After
1 142 143
2 148 146
3 144 147
4 142 138
5 140 136
6 144 139
7 146 141
8 150 145
9 149 143
10 142 136
11 149 145
12 143 140
13 145 143
14 146 142
15 143 140
16 146 141
13. Nonnumeric data such as Taste of food: bad, good, great
and excellent, Smoking habit: light, moderate and heavy etc.
Involves simpler computations than the corresponding
parametric methods and are therefore easier to understand.
Since the inference is based on ranks, Nonparametric
methods are quick for small samples and less subject to
measurement error than parametric methods.
14. No parameters to describe and it becomes more
difficult to make quantitative statements about
the actual difference between populations
Tend to waste information because it deals with
ranks and discard the actual values
Less powerful where parametric test is
applicable.
15. Type of Data
Measurement from
Normal Population
Rank, Score or
Measurement from
Non-normal
Describe one group Mean, SD Median, Interquartile
Range
Compare two
independent groups
Independent sample t-test
(unpaired t test)
Mann-Whitney test
Compare two paired
groups
Paired t test Wilcoxon Signed rank
test
Quantify relation between
two variables
Pearson Correlation Spearman Rank
Correlation