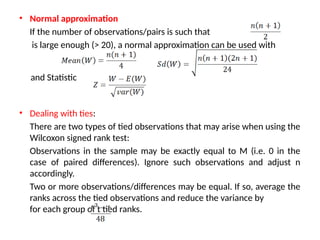
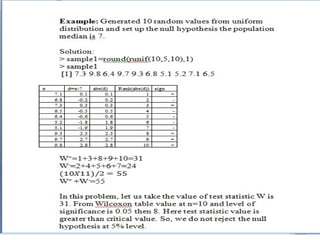
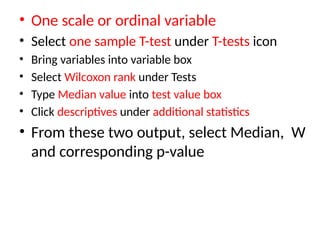
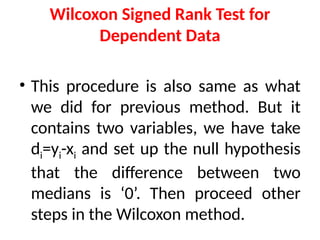
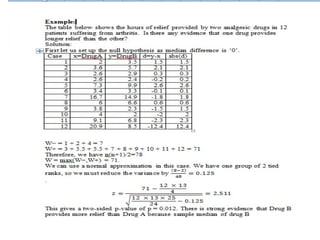
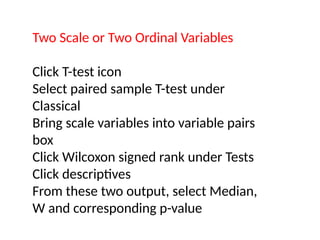
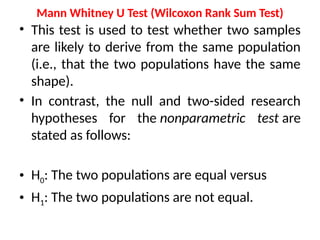
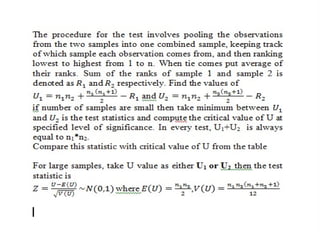
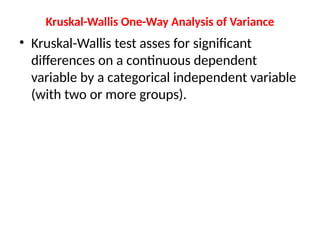
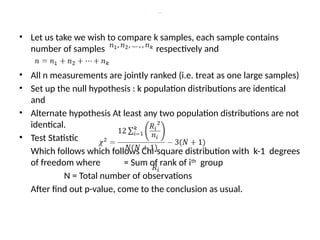
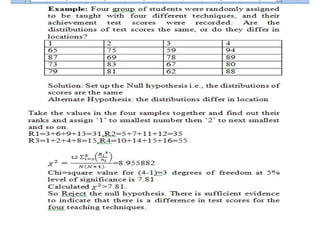
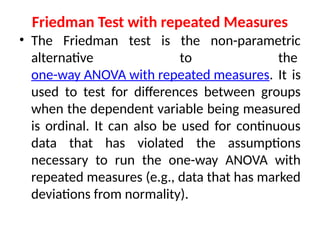
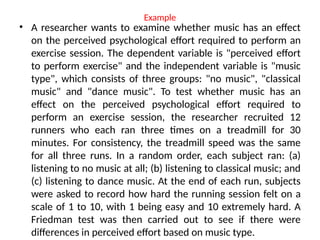
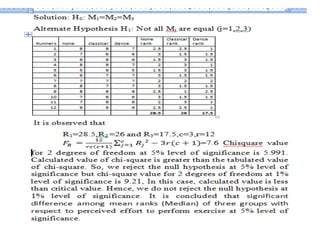
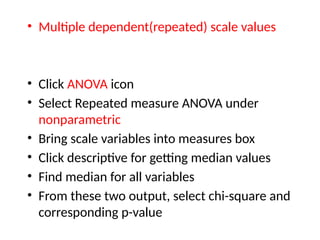
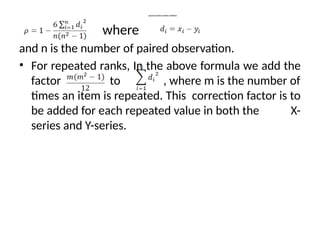
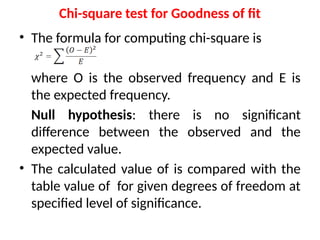
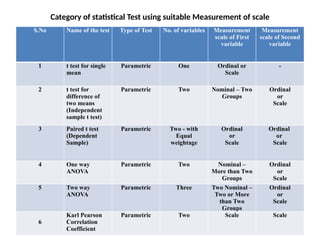
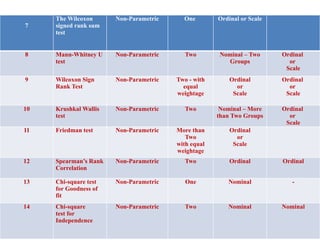
Nonparametric Test
• Nonparametric statistics are called distribution-free
statistics because they are not constrained by
assumptions about the distribution of the population.
• Non-parametric methods are widely used for
studying populations that take on a ranked order
(such as movie reviews receiving one to four stars).
NP test can be used even for nominal data
(qualitative data like greater or less, etc.) and
ordinal data, like ranked data.
NP test required less calculation, because there is no
need to compute parameters.
The Wilcoxon signed rank sum test
• Wilcoxon signed rank sum test is used to test the null
hypothesis that the median of a distribution is equal to
some value.
• It can be used in place of a one-sample t-test
• Procedure:
• 1. State the null hypothesis - the median value is equal
to some value M.
• 2. Calculate the difference between each observation
and the hypothesised median,
• di = xi −M.
• 3. Rank the di’s, ignoring the signs (i.e. assign rank 1 to
the smallest |di|, rank 2 to the next etc.)
• 4. Label each rank with its sign, according to the sign of di.
• 5. Calculate W+, the sum of the ranks of the positive di’s,
and W−, the sum of the ranks of the negative di’s. (As a
check the total, W+ + W−, should be equal to
where n is the number of pairs of observations
in the sample).
• 6. Choose W = min(W−,W+).
• 7. Use tables of critical values for the Wilcoxon signed
rank sum test to find the probability of observing a value
of W or more extreme. Most tables give both one-sided
and two-sided p-values. If not, double the one-sided p-
value to obtain the two-sided p-value. This is an exact
test.
• Normal approximation
If the number of observations/pairs is such that
is large enough (> 20), a normal approximation can be used with
and Statistic
• Dealing with ties:
There are two types of tied observations that may arise when using the
Wilcoxon signed rank test:
Observations in the sample may be exactly equal to M (i.e. 0 in the
case of paired differences). Ignore such observations and adjust n
accordingly.
Two or more observations/differences may be equal. If so, average the
ranks across the tied observations and reduce the variance by
for each group of t tied ranks.
• One scale or ordinal variable
• Select one sample T-test under T-tests icon
• Bring variables into variable box
• Select Wilcoxon rank under Tests
• Type Median value into test value box
• Click descriptives under additional statistics
• From these two output, select Median, W
and corresponding p-value
Wilcoxon Signed Rank Test for
Dependent Data
• This procedure is also same as what
we did for previous method. But it
contains two variables, we have take
di=yi-xi and set up the null hypothesis
that the difference between two
medians is ‘0’. Then proceed other
steps in the Wilcoxon method.
Two Scale or Two Ordinal Variables
Click T-test icon
Select paired sample T-test under
Classical
Bring scale variables into variable pairs
box
Click Wilcoxon signed rank under Tests
Click descriptives
From these two output, select Median,
W and corresponding p-value
Mann Whitney U Test (Wilcoxon Rank Sum Test)
• This test is used to test whether two samples
are likely to derive from the same population
(i.e., that the two populations have the same
shape).
• In contrast, the null and two-sided research
hypotheses for the nonparametric test are
stated as follows:
• H0: The two populations are equal versus
• H1: The two populations are not equal.
• One Scale (Ordinal) and One Factor variable with two
levels
• T-test – Independent Samples T-test
• Bring scale variables into dependent variable box
• Bring nominal variable into Grouping variable box
• Click Mann-Whitney U under Tests
• Click descriptives
• From these two output, select Median, U statistic
and corresponding p-value
Mann-Whitney U test between Medians
Kruskal-Wallis One-Way Analysis of Variance
• Kruskal-Wallis test asses for significant
differences on a continuous dependent
variable by a categorical independent variable
(with two or more groups).
Procedure
• Let us take we wish to compare k samples, each sample contains
number of samples respectively and
• All n measurements are jointly ranked (i.e. treat as one large samples)
• Set up the null hypothesis : k population distributions are identical
and
• Alternate hypothesis At least any two population distributions are not
identical.
• Test Statistic
Which follows which follows Chi-square distribution with k-1 degrees
of freedom where = Sum of rank of ith
group
N = Total number of observations
After find out p-value, come to the conclusion as usual.
• one Scale (Ordinal) and one nominal with two or
more levels
• Click ANOVA icon
• Select one way ANOVA under nonparametric
• Bring scale variables into dependent variable box
• Bring nominal variable into Grouping Variable box
• Click descriptive table under additional statistics
• From these two output, select mean, SD, F and
corresponding p-value
Friedman Test with repeated Measures
• The Friedman test is the non-parametric
alternative to the
one-way ANOVA with repeated measures. It is
used to test for differences between groups
when the dependent variable being measured
is ordinal. It can also be used for continuous
data that has violated the assumptions
necessary to run the one-way ANOVA with
repeated measures (e.g., data that has marked
deviations from normality).
Example
• A researcher wants to examine whether music has an effect
on the perceived psychological effort required to perform an
exercise session. The dependent variable is "perceived effort
to perform exercise" and the independent variable is "music
type", which consists of three groups: "no music", "classical
music" and "dance music". To test whether music has an
effect on the perceived psychological effort required to
perform an exercise session, the researcher recruited 12
runners who each ran three times on a treadmill for 30
minutes. For consistency, the treadmill speed was the same
for all three runs. In a random order, each subject ran: (a)
listening to no music at all; (b) listening to classical music; and
(c) listening to dance music. At the end of each run, subjects
were asked to record how hard the running session felt on a
scale of 1 to 10, with 1 being easy and 10 extremely hard. A
Friedman test was then carried out to see if there were
differences in perceived effort based on music type.
• Multiple dependent(repeated) scale values
• Click ANOVA icon
• Select Repeated measure ANOVA under
nonparametric
• Bring scale variables into measures box
• Click descriptive for getting median values
• Find median for all variables
• From these two output, select chi-square and
corresponding p-value
Spearman Rank Correlation Coefficient
where
and n is the number of paired observation.
• For repeated ranks, In the above formula we add the
factor to , where m is the number of
times an item is repeated. This correction factor is to
be added for each repeated value in both the X-
series and Y-series.
• Click Regression icon
• Select correlation matrix
• Bring scale variables into variables box
• Select Spearman under Correlation coefficients
• From the output copy the table which contains
correlation coefficient value and its
corresponding p-value
Chi-square test for Goodness of fit
• The formula for computing chi-square is
where O is the observed frequency and E is
the expected frequency.
Null hypothesis: there is no significant
difference between the observed and the
expected value.
• The calculated value of is compared with the
table value of for given degrees of freedom at
specified level of significance.
• Click chi-square Goodness of fit under
Frequencies icon
• Bring nominal variable into variable box
• From the output take observed value,
proportions, chi-square and p-value
Chi-square Test of Independence
• The null hypothesis that two criteria of classification are
independent. i.e. There is no relation ship between two
factor variables
•
• Click independent samples under frequencies
icon
• Bring one nominal variable into Row box and
another nominal variable into column box
• Click row, column and total percentages under
cells option
• From the output take chi-square and p-value
Category of statistical Test using suitable Measurement of scale
S.No Name of the test Type of Test No. of variables Measurement
scale of First
variable
Measurement
scale of Second
variable
1 t test for single
mean
Parametric One Ordinal or
Scale
-
2 t test for
difference of
two means
(Independent
sample t test)
Parametric Two Nominal – Two
Groups
Ordinal
or
Scale
3 Paired t test
(Dependent
Sample)
Parametric Two - with
Equal
weightage
Ordinal
or
Scale
Ordinal
or
Scale
4 One way
ANOVA
Parametric Two Nominal –
More than Two
Groups
Ordinal
or
Scale
5 Two way
ANOVA
Parametric Three Two Nominal –
Two or More
than Two
Groups
Ordinal
or
Scale
6
Karl Pearson
Correlation
Coefficient
Parametric Two Scale Scale
7
The Wilcoxon
signed rank sum
test
Non-Parametric One Ordinal or Scale
8 Mann-Whitney U
test
Non-Parametric Two Nominal – Two
Groups
Ordinal
or
Scale
9 Wilcoxon Sign
Rank Test
Non-Parametric Two - with
equal
weightage
Ordinal
or
Scale
Ordinal
or
Scale
10 Krushkal Wallis
test
Non-Parametric Two Nominal – More
than Two Groups
Ordinal
or
Scale
11 Friedman test Non-Parametric More than
Two
with equal
weightage
Ordinal
or
Scale
12 Spearman’s Rank
Correlation
Non-Parametric Two Ordinal Ordinal
13 Chi-square test
for Goodness of
fit
Non-Parametric One Nominal -
14 Chi-square
test for
Independence
Non-Parametric Two Nominal Nominal

Nonparametric Test_JAMOVI.ppt- Statistical data analysis

  • 1.
    Nonparametric Test • Nonparametricstatistics are called distribution-free statistics because they are not constrained by assumptions about the distribution of the population. • Non-parametric methods are widely used for studying populations that take on a ranked order (such as movie reviews receiving one to four stars). NP test can be used even for nominal data (qualitative data like greater or less, etc.) and ordinal data, like ranked data. NP test required less calculation, because there is no need to compute parameters.
  • 2.
    The Wilcoxon signedrank sum test • Wilcoxon signed rank sum test is used to test the null hypothesis that the median of a distribution is equal to some value. • It can be used in place of a one-sample t-test • Procedure: • 1. State the null hypothesis - the median value is equal to some value M. • 2. Calculate the difference between each observation and the hypothesised median, • di = xi −M. • 3. Rank the di’s, ignoring the signs (i.e. assign rank 1 to the smallest |di|, rank 2 to the next etc.)
  • 3.
    • 4. Labeleach rank with its sign, according to the sign of di. • 5. Calculate W+, the sum of the ranks of the positive di’s, and W−, the sum of the ranks of the negative di’s. (As a check the total, W+ + W−, should be equal to where n is the number of pairs of observations in the sample). • 6. Choose W = min(W−,W+). • 7. Use tables of critical values for the Wilcoxon signed rank sum test to find the probability of observing a value of W or more extreme. Most tables give both one-sided and two-sided p-values. If not, double the one-sided p- value to obtain the two-sided p-value. This is an exact test.
  • 4.
    • Normal approximation Ifthe number of observations/pairs is such that is large enough (> 20), a normal approximation can be used with and Statistic • Dealing with ties: There are two types of tied observations that may arise when using the Wilcoxon signed rank test: Observations in the sample may be exactly equal to M (i.e. 0 in the case of paired differences). Ignore such observations and adjust n accordingly. Two or more observations/differences may be equal. If so, average the ranks across the tied observations and reduce the variance by for each group of t tied ranks.
  • 6.
    • One scaleor ordinal variable • Select one sample T-test under T-tests icon • Bring variables into variable box • Select Wilcoxon rank under Tests • Type Median value into test value box • Click descriptives under additional statistics • From these two output, select Median, W and corresponding p-value
  • 7.
    Wilcoxon Signed RankTest for Dependent Data • This procedure is also same as what we did for previous method. But it contains two variables, we have take di=yi-xi and set up the null hypothesis that the difference between two medians is ‘0’. Then proceed other steps in the Wilcoxon method.
  • 9.
    Two Scale orTwo Ordinal Variables Click T-test icon Select paired sample T-test under Classical Bring scale variables into variable pairs box Click Wilcoxon signed rank under Tests Click descriptives From these two output, select Median, W and corresponding p-value
  • 10.
    Mann Whitney UTest (Wilcoxon Rank Sum Test) • This test is used to test whether two samples are likely to derive from the same population (i.e., that the two populations have the same shape). • In contrast, the null and two-sided research hypotheses for the nonparametric test are stated as follows: • H0: The two populations are equal versus • H1: The two populations are not equal.
  • 14.
    • One Scale(Ordinal) and One Factor variable with two levels • T-test – Independent Samples T-test • Bring scale variables into dependent variable box • Bring nominal variable into Grouping variable box • Click Mann-Whitney U under Tests • Click descriptives • From these two output, select Median, U statistic and corresponding p-value Mann-Whitney U test between Medians
  • 15.
    Kruskal-Wallis One-Way Analysisof Variance • Kruskal-Wallis test asses for significant differences on a continuous dependent variable by a categorical independent variable (with two or more groups).
  • 16.
    Procedure • Let ustake we wish to compare k samples, each sample contains number of samples respectively and • All n measurements are jointly ranked (i.e. treat as one large samples) • Set up the null hypothesis : k population distributions are identical and • Alternate hypothesis At least any two population distributions are not identical. • Test Statistic Which follows which follows Chi-square distribution with k-1 degrees of freedom where = Sum of rank of ith group N = Total number of observations After find out p-value, come to the conclusion as usual.
  • 18.
    • one Scale(Ordinal) and one nominal with two or more levels • Click ANOVA icon • Select one way ANOVA under nonparametric • Bring scale variables into dependent variable box • Bring nominal variable into Grouping Variable box • Click descriptive table under additional statistics • From these two output, select mean, SD, F and corresponding p-value
  • 19.
    Friedman Test withrepeated Measures • The Friedman test is the non-parametric alternative to the one-way ANOVA with repeated measures. It is used to test for differences between groups when the dependent variable being measured is ordinal. It can also be used for continuous data that has violated the assumptions necessary to run the one-way ANOVA with repeated measures (e.g., data that has marked deviations from normality).
  • 21.
    Example • A researcherwants to examine whether music has an effect on the perceived psychological effort required to perform an exercise session. The dependent variable is "perceived effort to perform exercise" and the independent variable is "music type", which consists of three groups: "no music", "classical music" and "dance music". To test whether music has an effect on the perceived psychological effort required to perform an exercise session, the researcher recruited 12 runners who each ran three times on a treadmill for 30 minutes. For consistency, the treadmill speed was the same for all three runs. In a random order, each subject ran: (a) listening to no music at all; (b) listening to classical music; and (c) listening to dance music. At the end of each run, subjects were asked to record how hard the running session felt on a scale of 1 to 10, with 1 being easy and 10 extremely hard. A Friedman test was then carried out to see if there were differences in perceived effort based on music type.
  • 23.
    • Multiple dependent(repeated)scale values • Click ANOVA icon • Select Repeated measure ANOVA under nonparametric • Bring scale variables into measures box • Click descriptive for getting median values • Find median for all variables • From these two output, select chi-square and corresponding p-value
  • 24.
    Spearman Rank CorrelationCoefficient where and n is the number of paired observation. • For repeated ranks, In the above formula we add the factor to , where m is the number of times an item is repeated. This correction factor is to be added for each repeated value in both the X- series and Y-series.
  • 25.
    • Click Regressionicon • Select correlation matrix • Bring scale variables into variables box • Select Spearman under Correlation coefficients • From the output copy the table which contains correlation coefficient value and its corresponding p-value
  • 26.
    Chi-square test forGoodness of fit • The formula for computing chi-square is where O is the observed frequency and E is the expected frequency. Null hypothesis: there is no significant difference between the observed and the expected value. • The calculated value of is compared with the table value of for given degrees of freedom at specified level of significance.
  • 27.
    • Click chi-squareGoodness of fit under Frequencies icon • Bring nominal variable into variable box • From the output take observed value, proportions, chi-square and p-value
  • 28.
    Chi-square Test ofIndependence • The null hypothesis that two criteria of classification are independent. i.e. There is no relation ship between two factor variables •
  • 29.
    • Click independentsamples under frequencies icon • Bring one nominal variable into Row box and another nominal variable into column box • Click row, column and total percentages under cells option • From the output take chi-square and p-value
  • 30.
    Category of statisticalTest using suitable Measurement of scale S.No Name of the test Type of Test No. of variables Measurement scale of First variable Measurement scale of Second variable 1 t test for single mean Parametric One Ordinal or Scale - 2 t test for difference of two means (Independent sample t test) Parametric Two Nominal – Two Groups Ordinal or Scale 3 Paired t test (Dependent Sample) Parametric Two - with Equal weightage Ordinal or Scale Ordinal or Scale 4 One way ANOVA Parametric Two Nominal – More than Two Groups Ordinal or Scale 5 Two way ANOVA Parametric Three Two Nominal – Two or More than Two Groups Ordinal or Scale 6 Karl Pearson Correlation Coefficient Parametric Two Scale Scale
  • 31.
    7 The Wilcoxon signed ranksum test Non-Parametric One Ordinal or Scale 8 Mann-Whitney U test Non-Parametric Two Nominal – Two Groups Ordinal or Scale 9 Wilcoxon Sign Rank Test Non-Parametric Two - with equal weightage Ordinal or Scale Ordinal or Scale 10 Krushkal Wallis test Non-Parametric Two Nominal – More than Two Groups Ordinal or Scale 11 Friedman test Non-Parametric More than Two with equal weightage Ordinal or Scale 12 Spearman’s Rank Correlation Non-Parametric Two Ordinal Ordinal 13 Chi-square test for Goodness of fit Non-Parametric One Nominal - 14 Chi-square test for Independence Non-Parametric Two Nominal Nominal