Level of Significance
The level of significance, also denoted as alpha or 𝛼, is a
measure of the strength of the evidence that must be present in
your sample before you will reject the null hypothesis and
conclude that the effect is statistically significant. The
researcher determines the significance level before conducting
the experiment. To obtain the level of significance use the
formula 𝛼=1− confidence level.
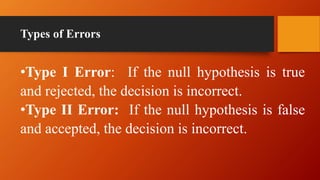
Types of Errors
•Type I Error: If the null hypothesis is true
and rejected, the decision is incorrect.
•Type II Error: If the null hypothesis is false
and accepted, the decision is incorrect.
EXAMPLE
•A person is on trial for a criminal offense and the judge
needs to provide a verdict on his case. Now, there are four
possible combinations in such a case:
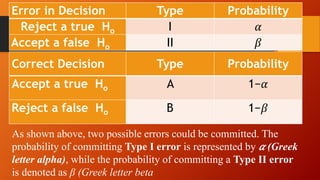
Error in Decision Type Probability
Reject a true Ho I 𝛼
Accept a false Ho II 𝛽
Correct Decision Type Probability
Accept a true Ho A 1−𝛼
Reject a false Ho B 1−𝛽
As shown above, two possible errors could be committed. The
probability of committing Type I error is represented by 𝛼 (Greek
letter alpha), while the probability of committing a Type II error
is denoted as β (Greek letter beta
Rejection Region
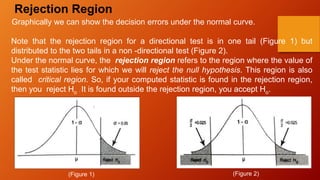
Graphically we can show the decision errors under the normal curve.
Note that the rejection region for a directional test is in one tail (Figure 1) but
distributed to the two tails in a non -directional test (Figure 2).
Under the normal curve, the rejection region refers to the region where the value of
the test statistic lies for which we will reject the null hypothesis. This region is also
called critical region. So, if your computed statistic is found in the rejection region,
then you reject Ho . It is found outside the rejection region, you accept Ho.
(Figure 1) (Figure 2)
Population
Population – refers to the totality of objects, individuals,
characteristics, or reactions of interest (e.g. based on the total
count of votes in the national level Grace Poe was proclaimed
as the number 1 senator.)
Sample – is a group of subjects carefully selected from a population of interest (e.g. As of May
15, 8:15pm, 10% of the votes have been counted and
Nancy Binay is in the 5th spot.)
Parameter – is the numerical value that describes characteristics of a population (e.g. total votes)
Statistic – is the numerical value that describes a particular sample (e.g. 10% of
votes)
Sample
• Sample – is a group of subjects
carefully selected from a population of
interest.
(e.g. As of May 15, 8:15pm, 10% of the
votes have been counted and Nancy
Binay is in the 5th spot.)
Parameter – is the numerical value that
describes characteristics of a population
(e.g. total votes)
Statistic
Statistic – is the numerical value that
describes a particular sample (e.g. 10% of
votes)
Activity:
Identify the term that is being described in the given statement.
___________________ 1. Accepting a false null hypothesis.
___________________ 2. Rejecting a true null hypothesis.
___________________ 3. The region where the value of the test
statistic lies for which we will reject the null hypothesis.
___________________ 4. It is a measure of the strength of the
evidence that must be present in your sample before you will reject
the null hypothesis and conclude that the effect is statistically
significant. ___________________ 5. It refers to the probability of
committing a type I error.