Downloaded 1,027 times

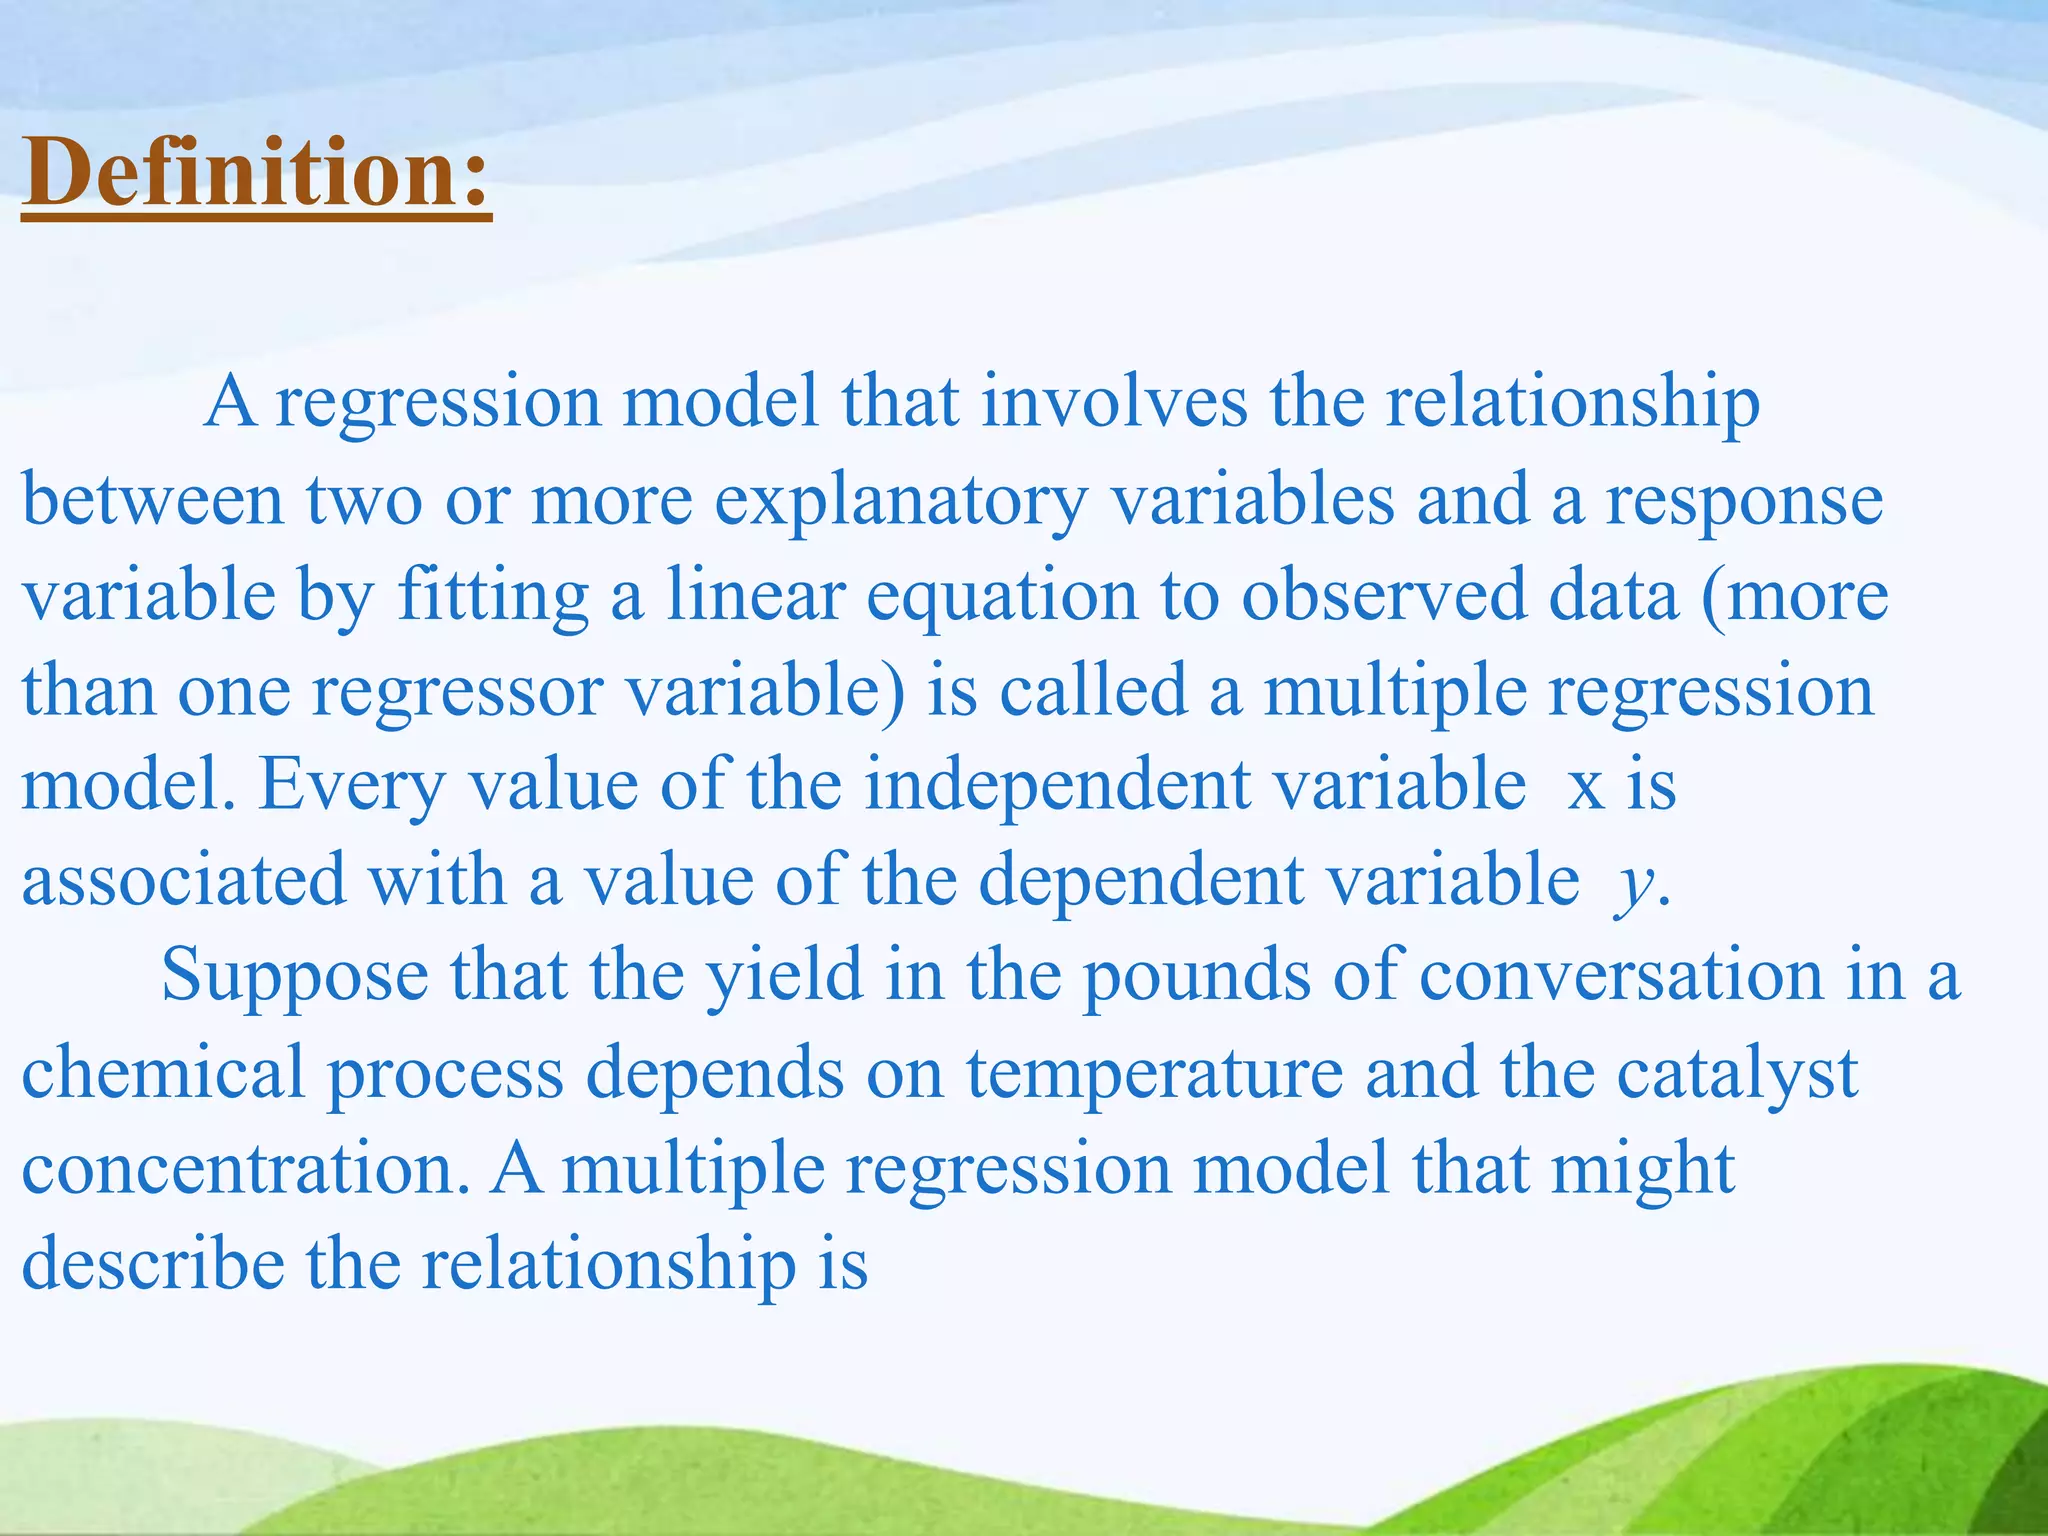
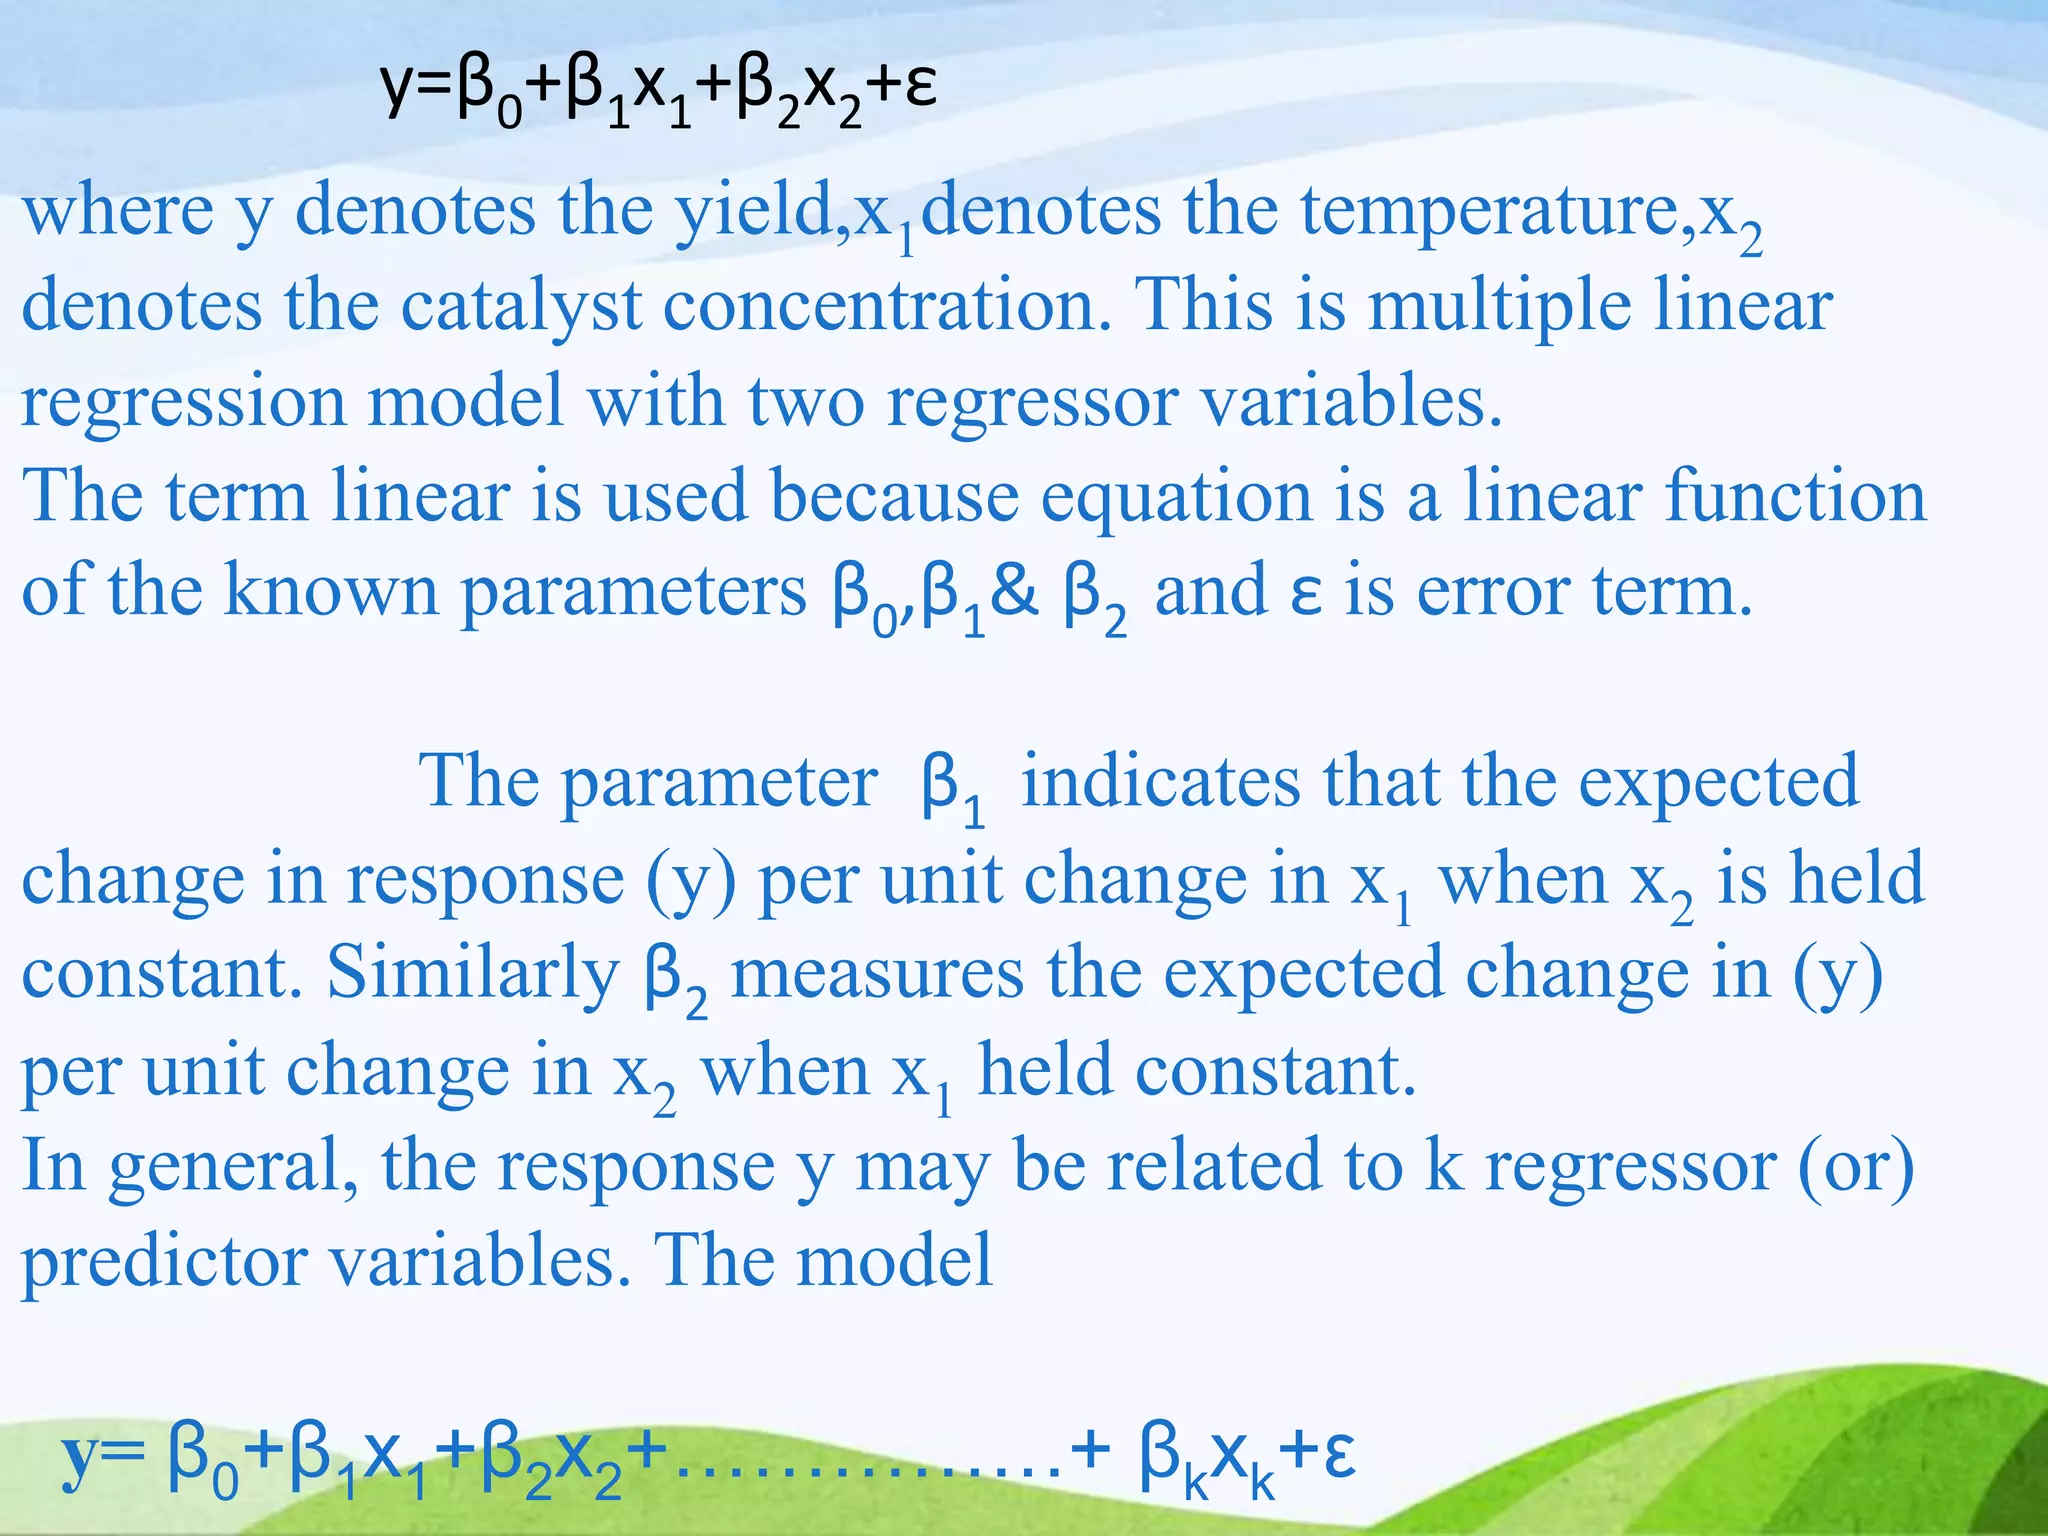


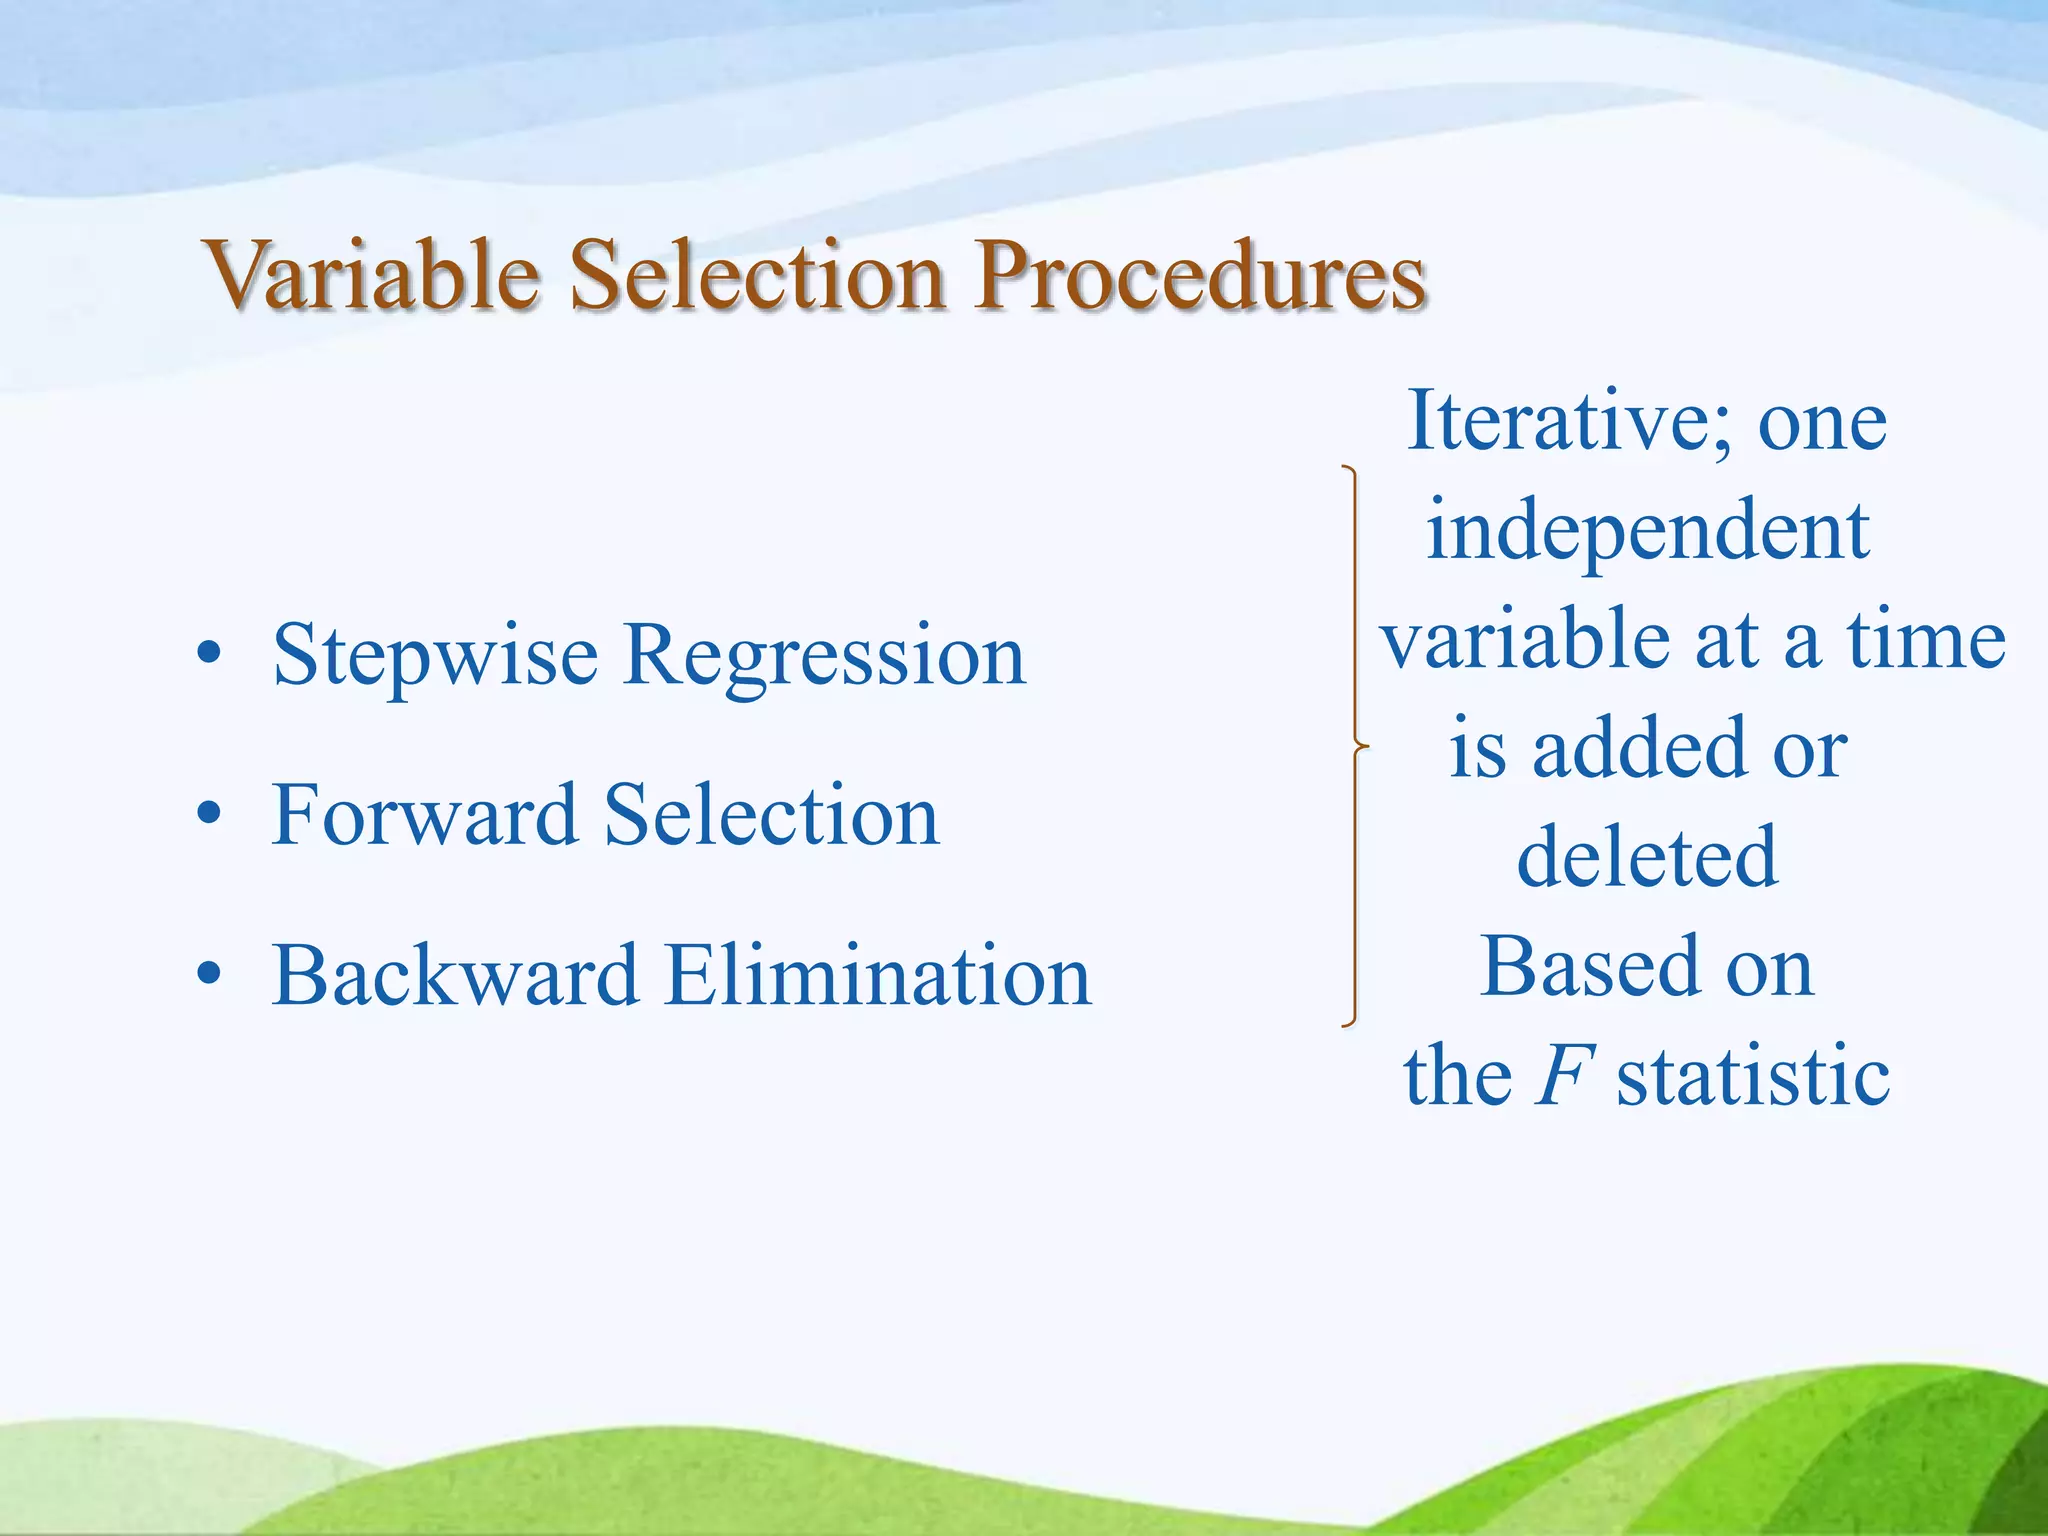
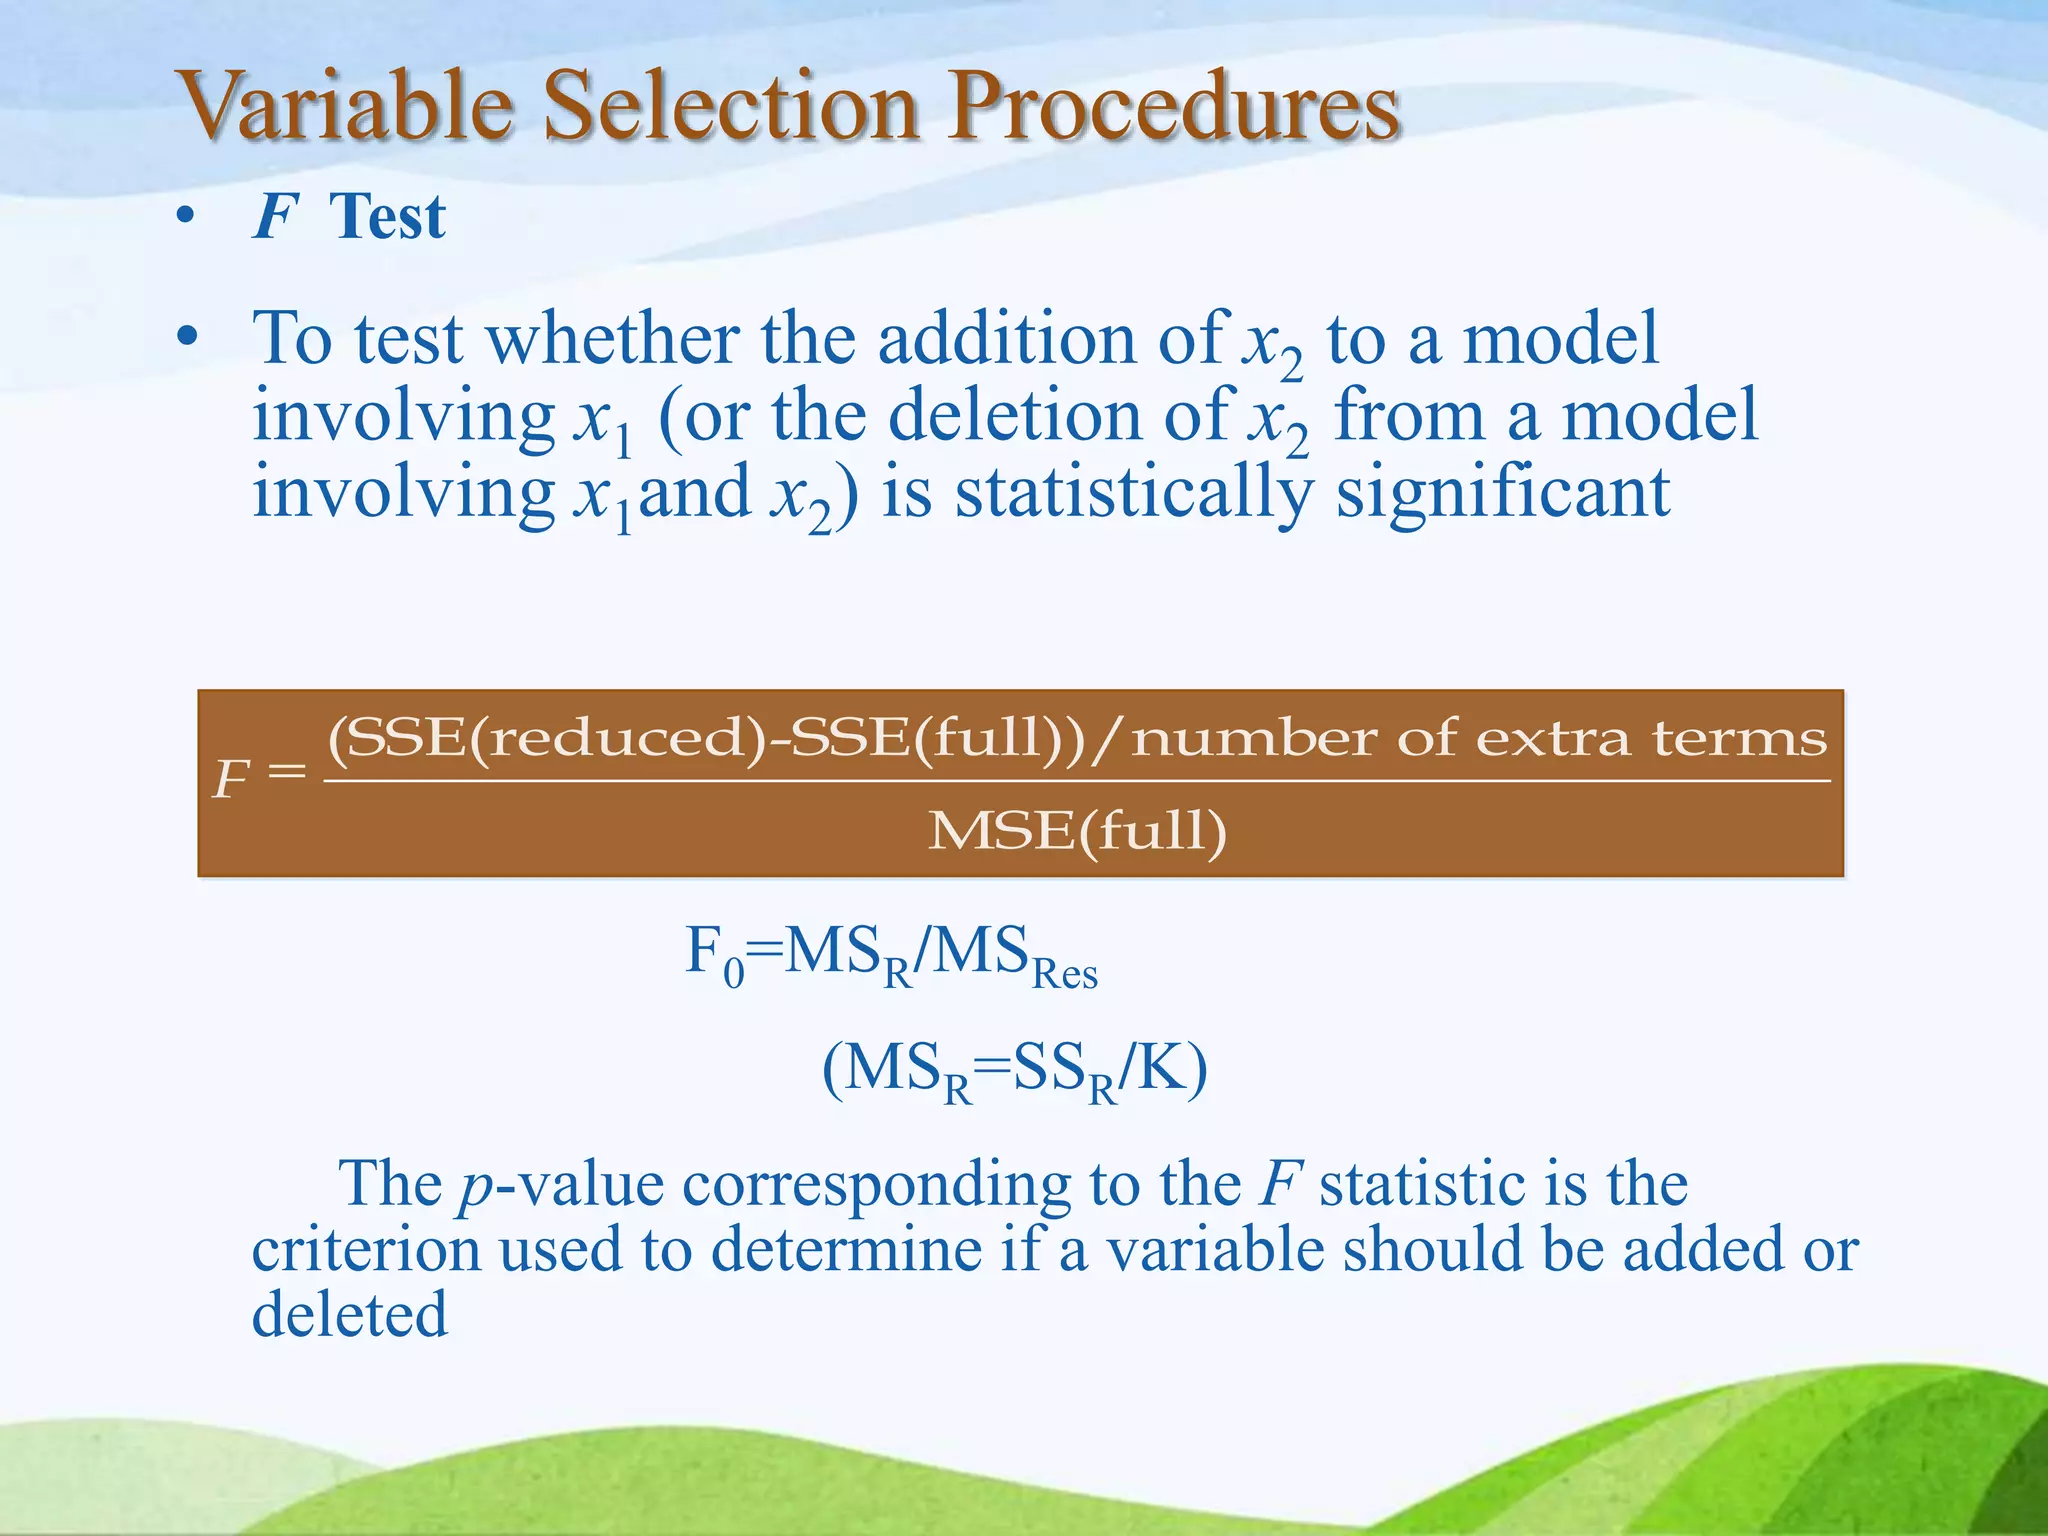
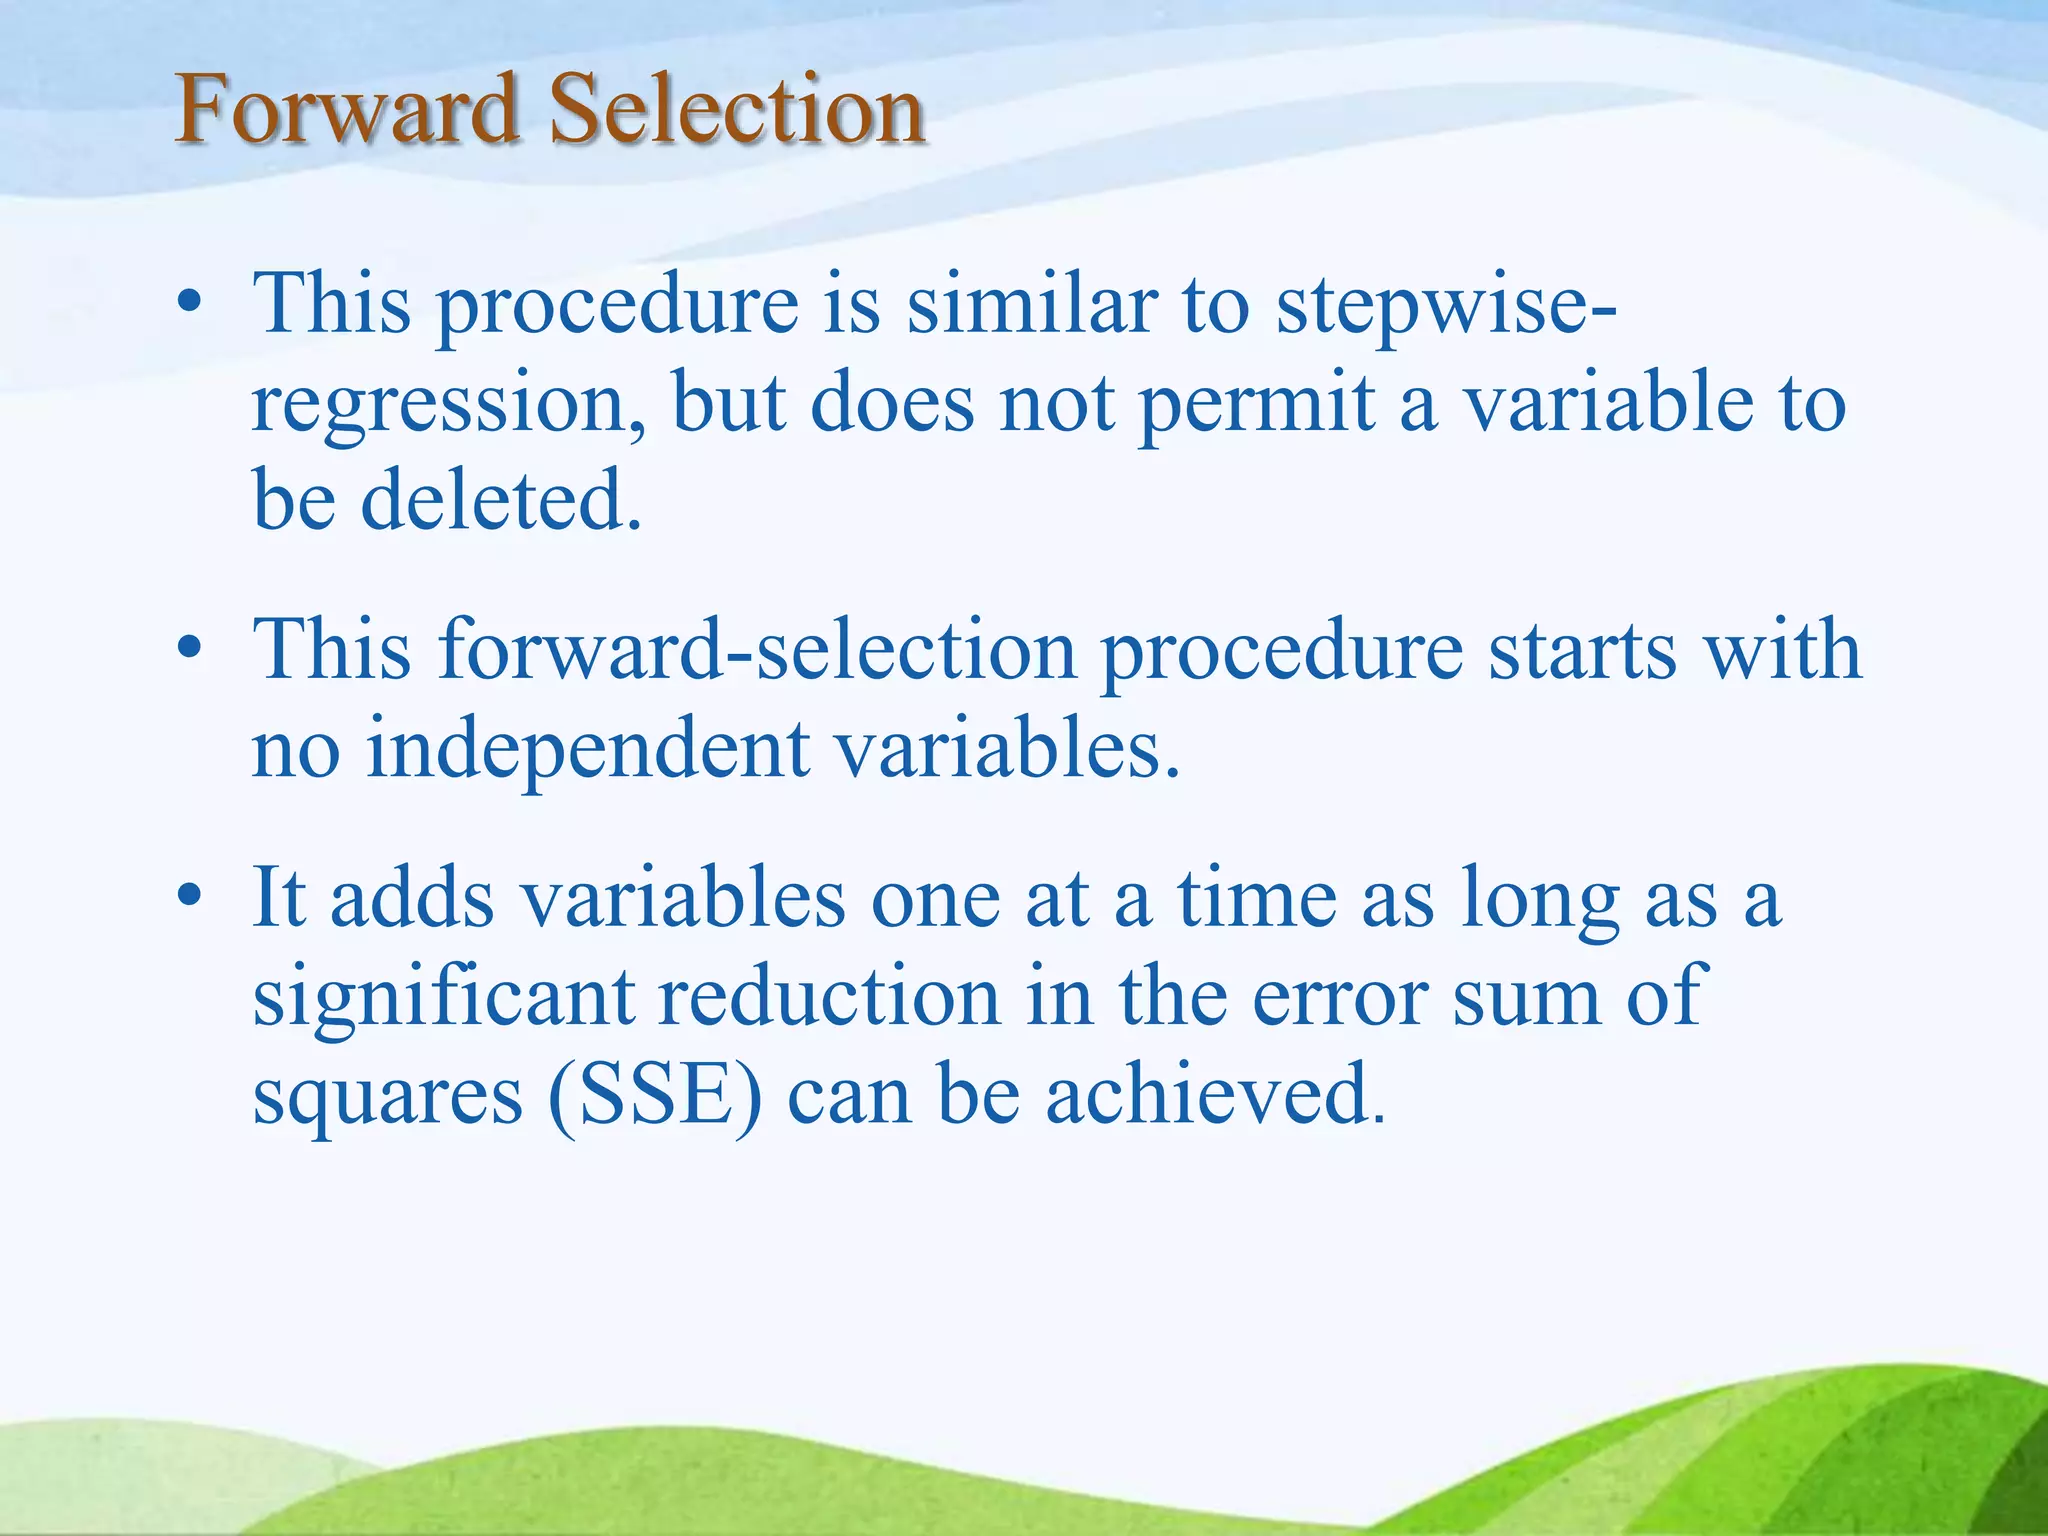
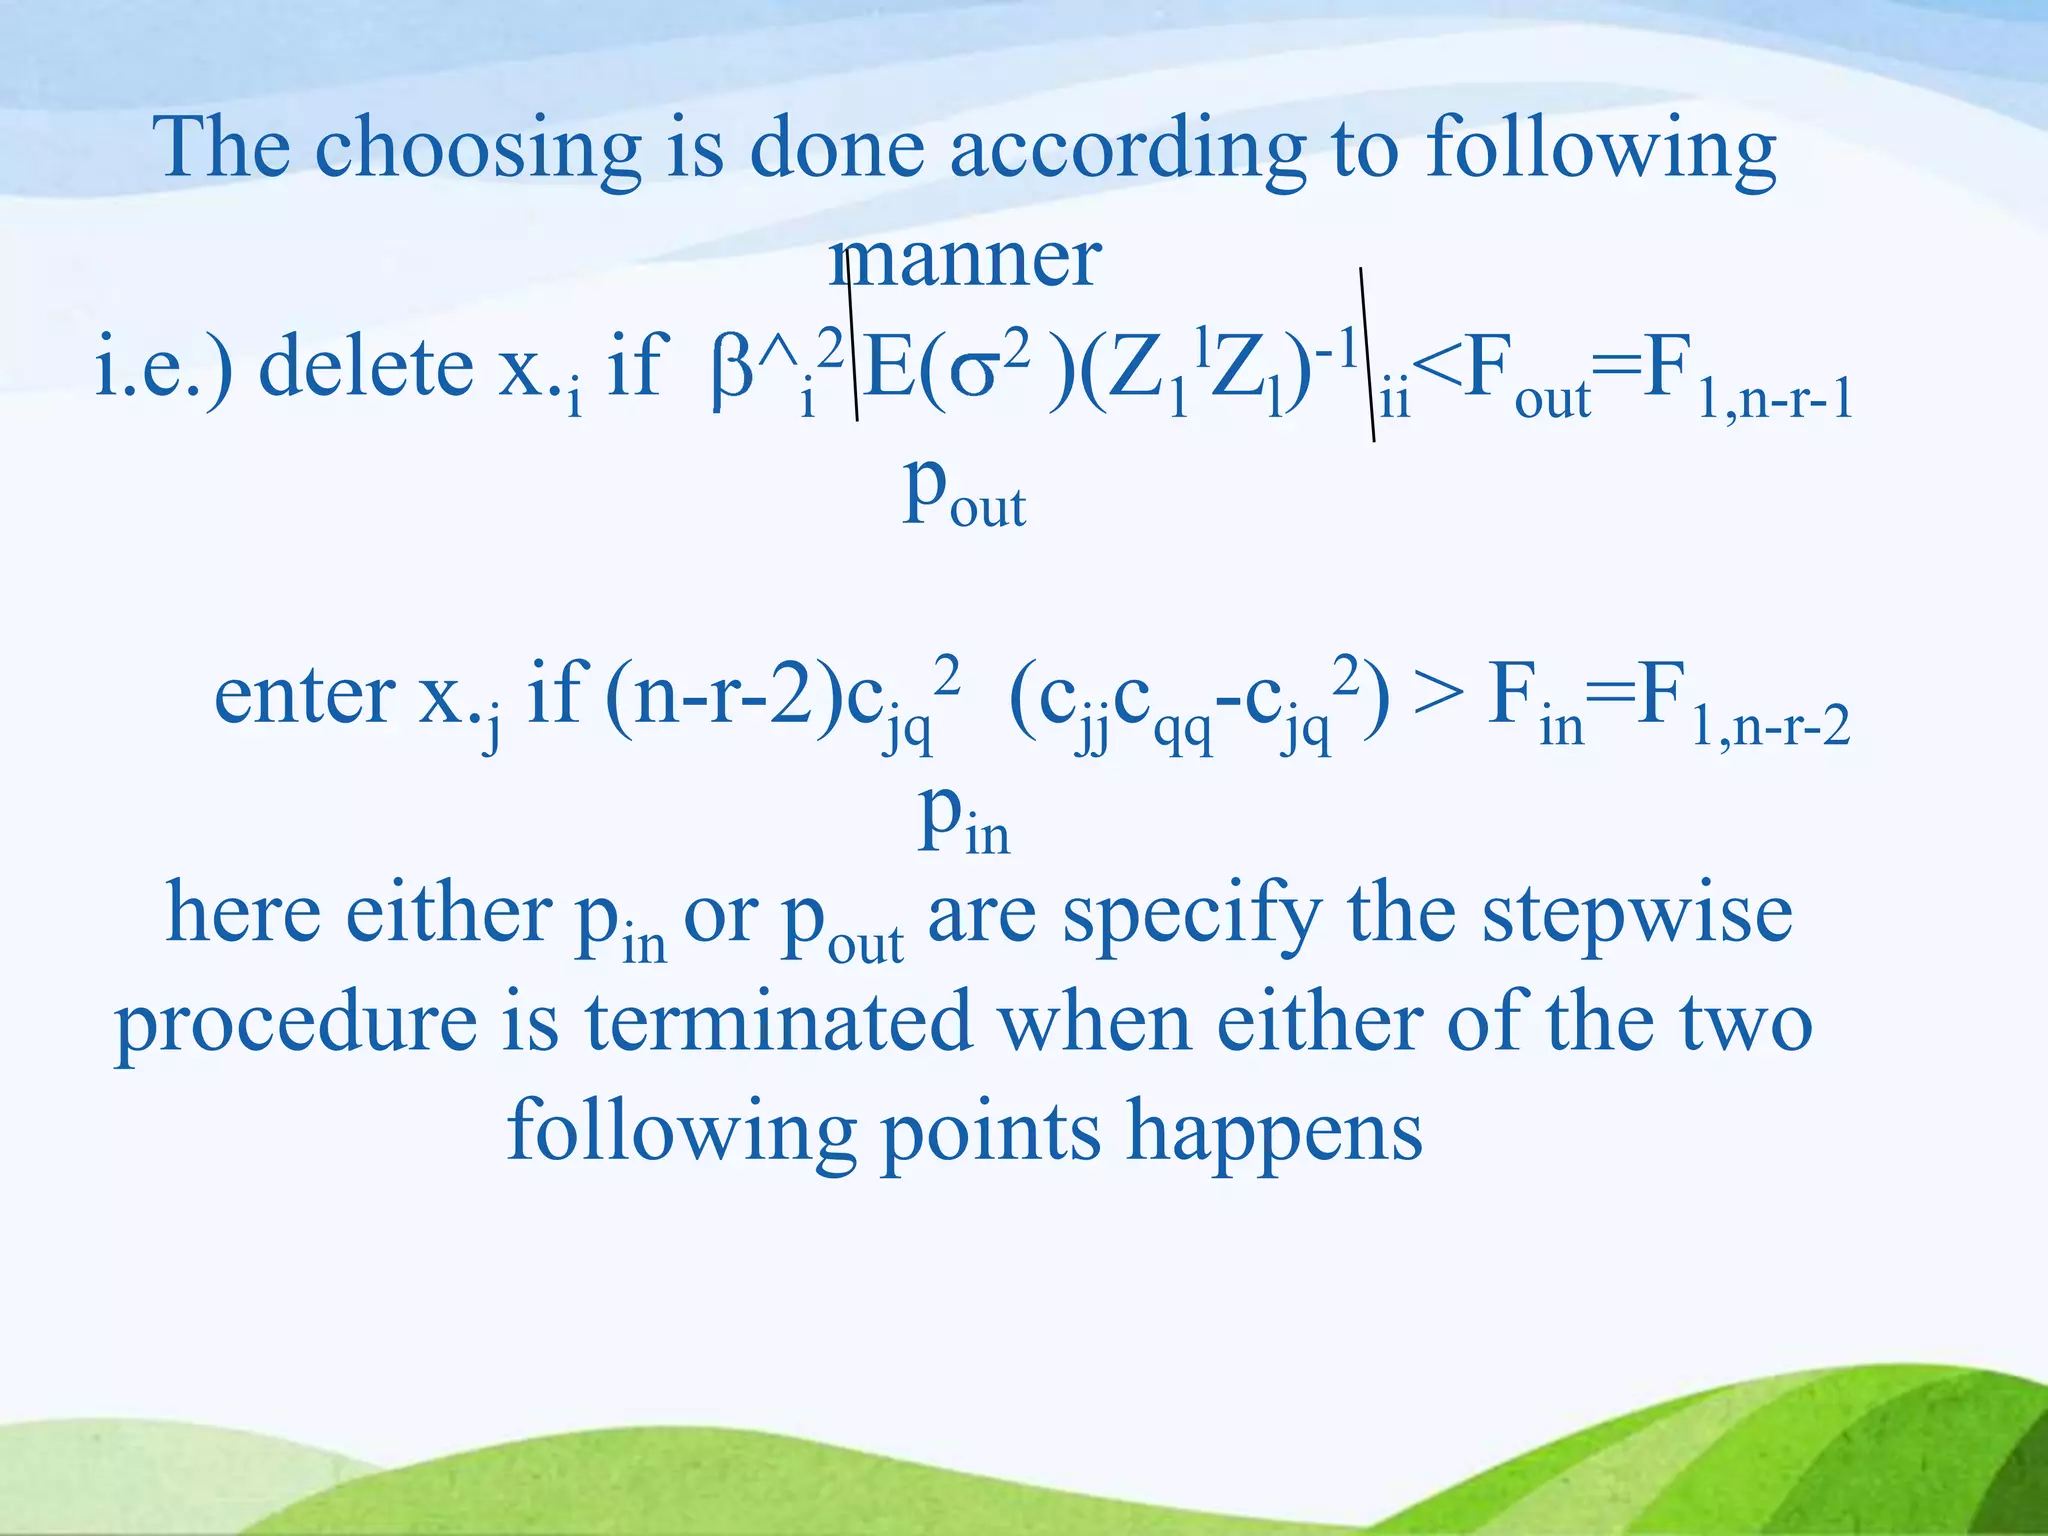
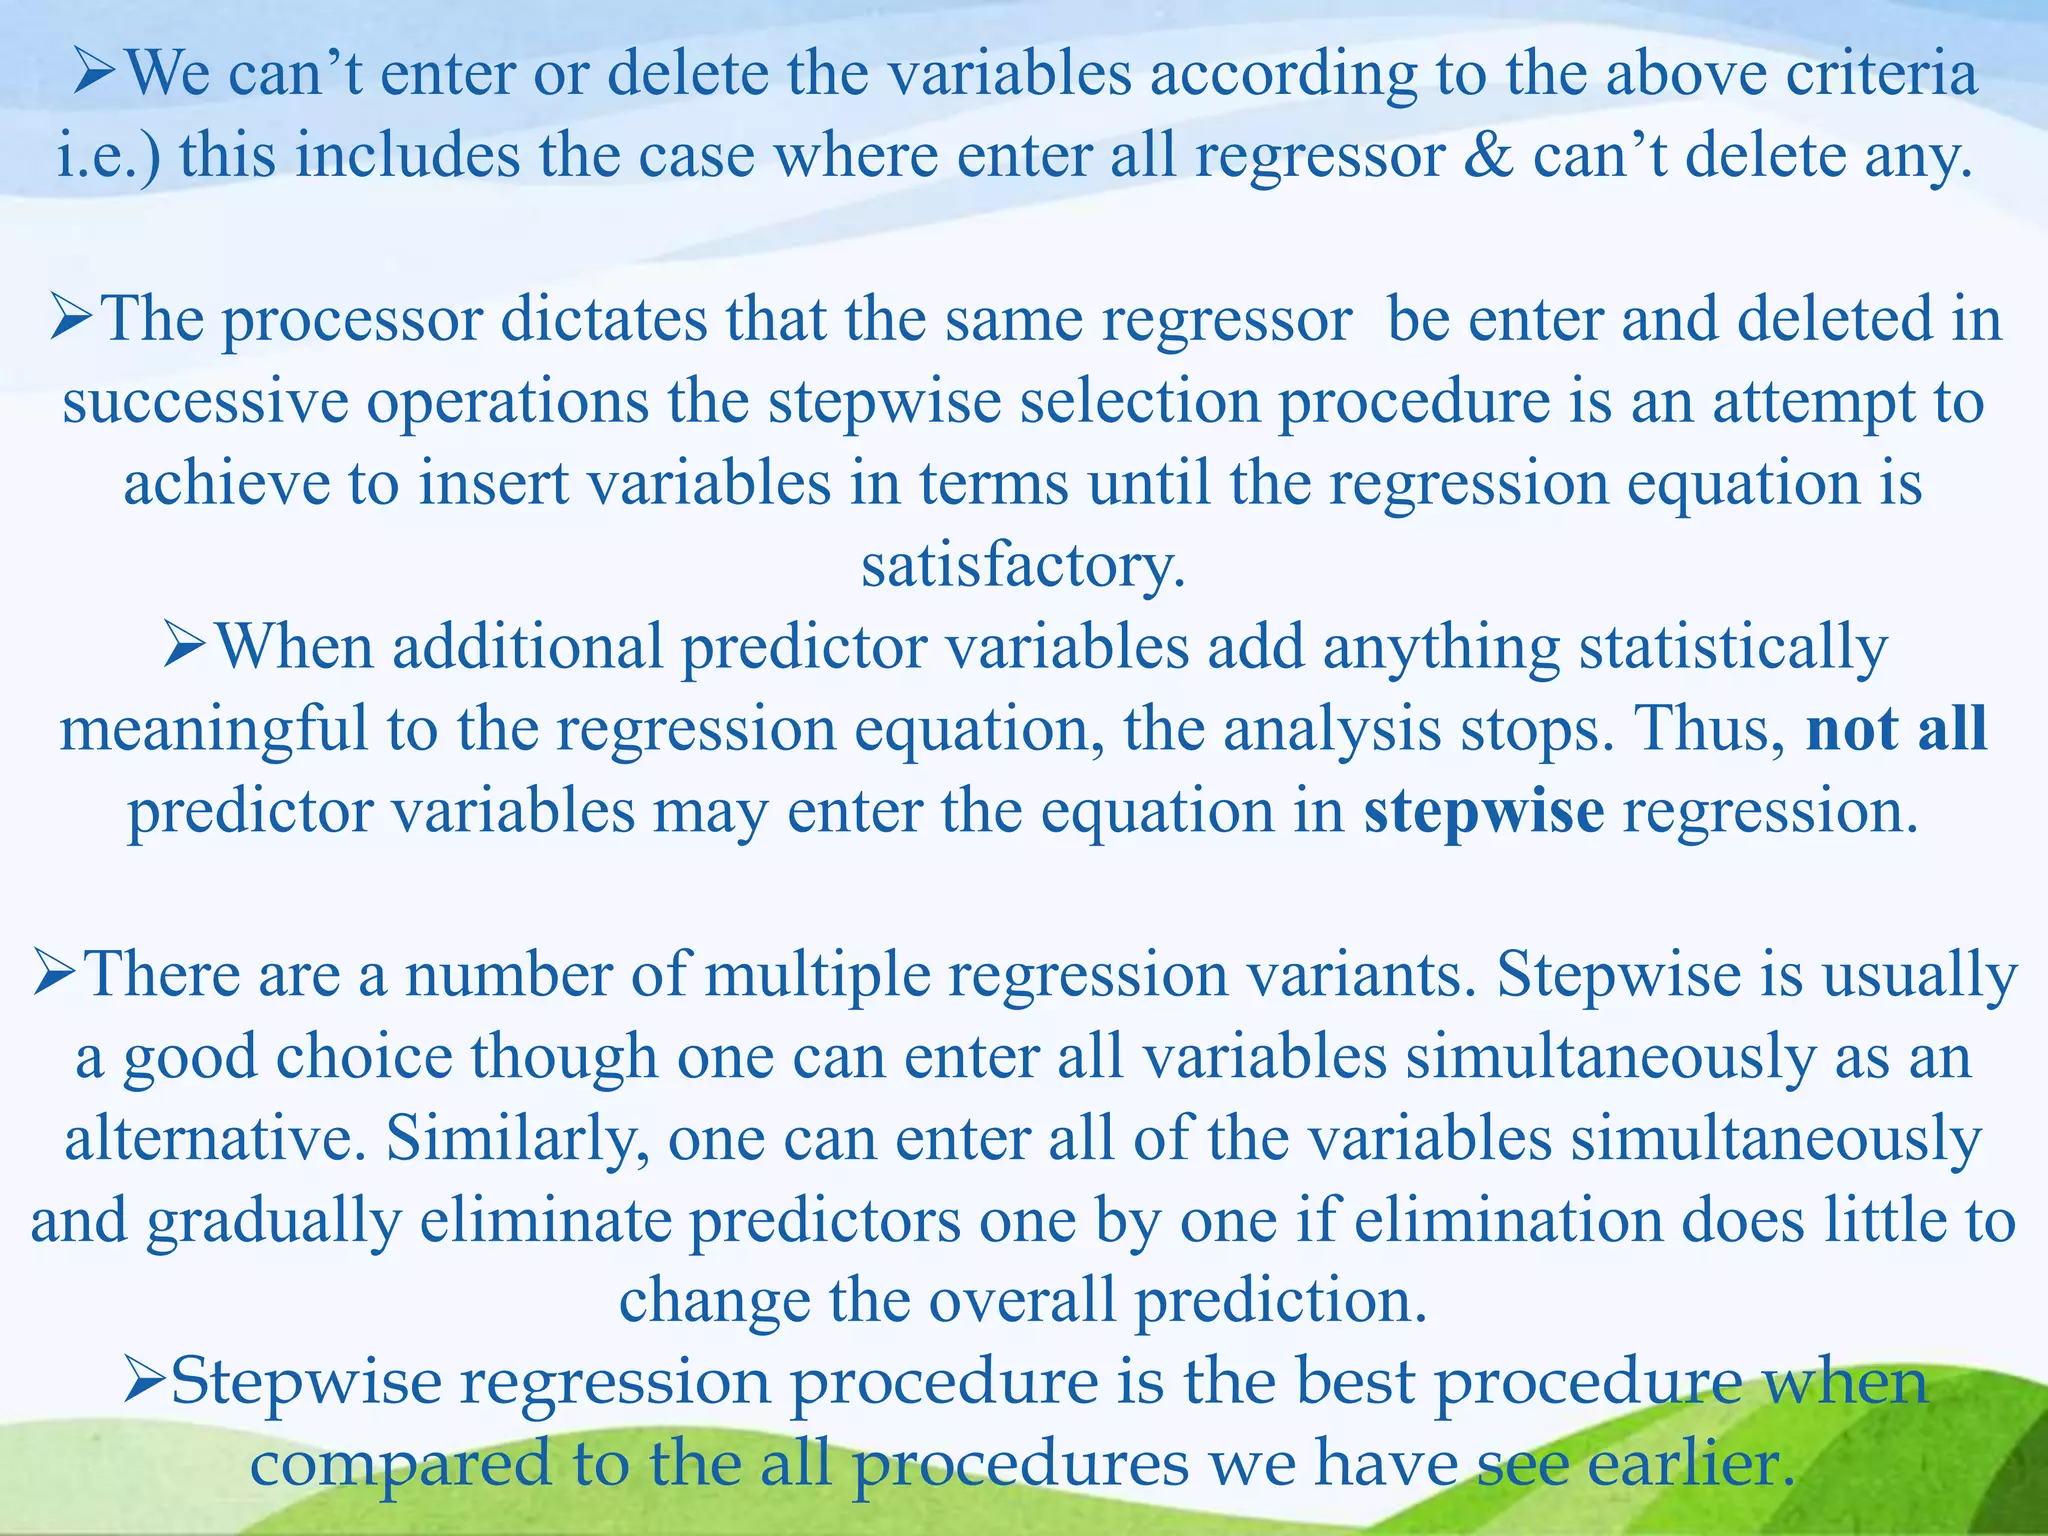


Multiple regression analysis allows researchers to examine the relationship between one dependent or outcome variable and two or more independent or predictor variables. It extends simple linear regression to model more complex relationships. Stepwise regression is a technique that automates the process of building regression models by sequentially adding or removing variables based on statistical criteria. It begins with no variables in the model and adds variables one at a time based on their contribution to the model until none improve it significantly.


![Vibe Coding vs. Spec-Driven Development [Free Meetup]](https://cdn.slidesharecdn.com/ss_thumbnails/vibecodingvsspecdrivendevelopment-251209105622-43f455e7-thumbnail.jpg?width=640&height=640&fit=bounds)


