Downloaded 298 times


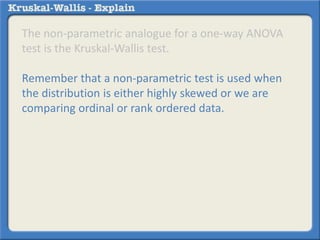
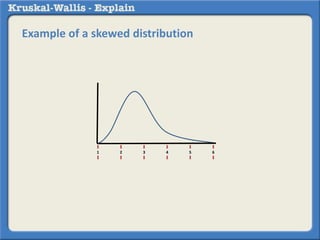
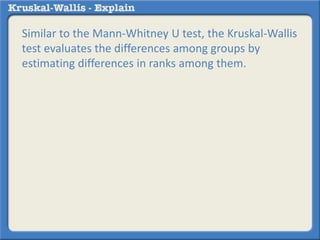
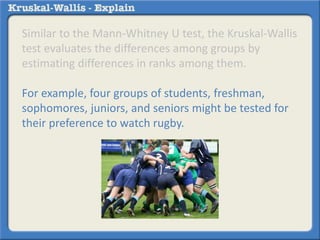
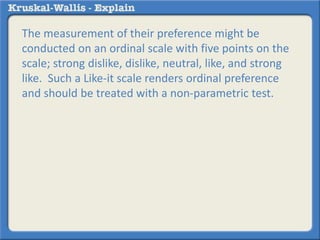
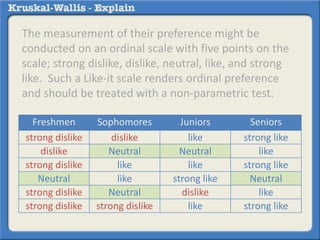
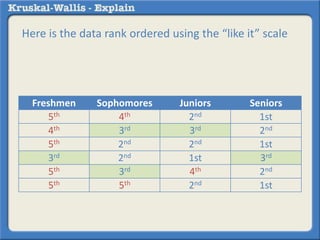
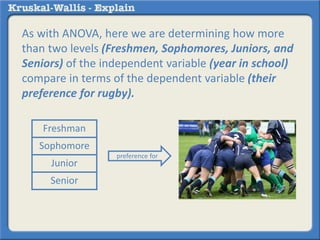
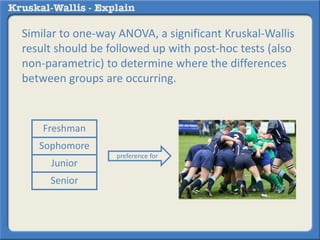

The Kruskal-Wallis test is a non-parametric analogue to a one-way ANOVA test used to compare differences between two or more independent groups when the dependent variable is measured on an ordinal scale or when the distribution is skewed. It works by ranking the data and estimating differences in ranks among the groups. For example, it could be used to test for differences in student preference for watching rugby (measured on a scale from strong dislike to strong like) between freshmen, sophomores, juniors, and seniors. A significant Kruskal-Wallis result should then be followed up with post-hoc non-parametric tests to determine where the differences between groups occur.