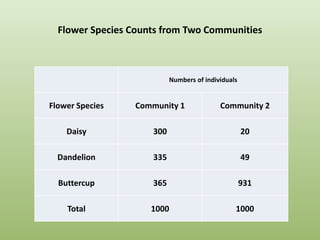
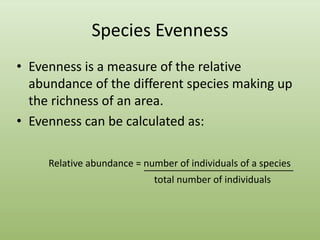
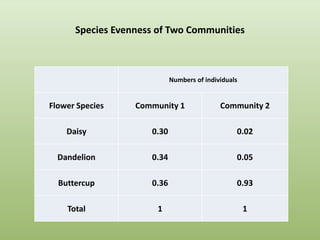
Measuring Biodiversity
Biological Diversity
• Biodiversity can be quantified in many
different ways.
• Two main factors taken into account by
ecologists are:
1. Species richness
2. Species evenness
Species Richness
• Is a measure of the number of different kinds
of organisms present in a particular area.
• This is a simple count of the species in a
community.
• Each species contributes one count to the
total regardless of whether the species
population is 1 or 1 million.
Flower Species Counts from Two Communities
Numbers of individuals
Flower Species Community 1 Community 2
Daisy 300 20
Dandelion 335 49
Buttercup 365 931
Total 1000 1000
Species Richness for Two Flower Communities
Community Species Richness
1 3
2 3
Species Evenness
• Evenness is a measure of the relative
abundance of the different species making up
the richness of an area.
• Evenness can be calculated as:
Relative abundance = number of individuals of a species
total number of individuals
Flower Species Counts from Two Communities
Numbers of individuals
Flower Species Community 1 Community 2
Daisy 300 20
Dandelion 335 49
Buttercup 365 931
Total 1000 1000
Species Evenness of Two Communities
Numbers of individuals
Flower Species Community 1 Community 2
Daisy 0.30 0.02
Dandelion 0.34 0.05
Buttercup 0.36 0.93
Total 1 1
Biodiversity
• A community dominated by one or two
species is considered to be less diverse than
one in which several different species have
similar abundance.
• As species richness and evenness increase, so
does diversity.
*handout
Simpson’s Index
• Simpson’s Index is a calculation done by ecologists
that is a measure of diversity which takes into
account both richness and evenness of species.
n = the total number of organisms of a particular species
N = the total number of organisms of all species
Simpson’s Index of Diversity
• The value of D ranges between 0 and 1.
• With this index, 0 represents infinite diversity
and 1 represents no diversity.
– The greater the value of D, the lower the diversity.
– The less the value of D, the higher the diversity.
Using Simpson’s index to measure biodiversity – a worked example
It may be easier to understand the use of Simpson’s index with the following example.
Consider three communities, each made up of a total of 100 organisms, drawn from
combinations of ten species, A to J.
Community 1 has the highest diversity. It has the joint highest species richness (10) and each
species has a similar relative abundance. Community 2 has the same species richness as
community 1, but is dominated by one species (A) so that the diversity of this community is
lower than in community 1. Community 3 has a lower diversity than community 1, due to its
lower species richness.
Table 1 Species composition of three different communities.
Species Community 1 Community 2 Community 3
A 10 72 35
B 9 6 34
C 11 3 31
D 10 3 0
E 8 1 0
F 12 3 0
G 10 4 0
H 11 3 0
I 10 2 0
J 9 3 0
Total 100 100 100
The formula for calculating Simpson’s index is:
 
 1NN
1nn
D



 ii
Where N = the total number of all organisms
ni = the numbers of individuals of each individual species
The lower the value of D, the greater is the species diversity. Take for example community 1
in the table 1 above. The values of (n-1) and ni(n-1) in the computation of D are shown in
table 2 opposite.
Simpson’s Index Scale: Level of Diversity
1 no diversity
0.9 extremely low diversity
0.8 very low diversity
0.7 low diversity
0.6 moderate-low diversity
0.5 moderate diversity
0.4 moderate-high diversity
0.3 high diversity
0.2 very high diversity
0.1 extremely high diversity
0 infinite diversity

Measuring biodiversity

  • 1.
  • 2.
    Biological Diversity • Biodiversitycan be quantified in many different ways. • Two main factors taken into account by ecologists are: 1. Species richness 2. Species evenness
  • 3.
    Species Richness • Isa measure of the number of different kinds of organisms present in a particular area. • This is a simple count of the species in a community. • Each species contributes one count to the total regardless of whether the species population is 1 or 1 million.
  • 4.
    Flower Species Countsfrom Two Communities Numbers of individuals Flower Species Community 1 Community 2 Daisy 300 20 Dandelion 335 49 Buttercup 365 931 Total 1000 1000
  • 5.
    Species Richness forTwo Flower Communities Community Species Richness 1 3 2 3
  • 6.
    Species Evenness • Evennessis a measure of the relative abundance of the different species making up the richness of an area. • Evenness can be calculated as: Relative abundance = number of individuals of a species total number of individuals
  • 7.
    Flower Species Countsfrom Two Communities Numbers of individuals Flower Species Community 1 Community 2 Daisy 300 20 Dandelion 335 49 Buttercup 365 931 Total 1000 1000
  • 8.
    Species Evenness ofTwo Communities Numbers of individuals Flower Species Community 1 Community 2 Daisy 0.30 0.02 Dandelion 0.34 0.05 Buttercup 0.36 0.93 Total 1 1
  • 9.
    Biodiversity • A communitydominated by one or two species is considered to be less diverse than one in which several different species have similar abundance. • As species richness and evenness increase, so does diversity. *handout
  • 10.
    Simpson’s Index • Simpson’sIndex is a calculation done by ecologists that is a measure of diversity which takes into account both richness and evenness of species. n = the total number of organisms of a particular species N = the total number of organisms of all species
  • 11.
    Simpson’s Index ofDiversity • The value of D ranges between 0 and 1. • With this index, 0 represents infinite diversity and 1 represents no diversity. – The greater the value of D, the lower the diversity. – The less the value of D, the higher the diversity.
  • 12.
    Using Simpson’s indexto measure biodiversity – a worked example It may be easier to understand the use of Simpson’s index with the following example. Consider three communities, each made up of a total of 100 organisms, drawn from combinations of ten species, A to J. Community 1 has the highest diversity. It has the joint highest species richness (10) and each species has a similar relative abundance. Community 2 has the same species richness as community 1, but is dominated by one species (A) so that the diversity of this community is lower than in community 1. Community 3 has a lower diversity than community 1, due to its lower species richness. Table 1 Species composition of three different communities. Species Community 1 Community 2 Community 3 A 10 72 35 B 9 6 34 C 11 3 31 D 10 3 0 E 8 1 0 F 12 3 0 G 10 4 0 H 11 3 0 I 10 2 0 J 9 3 0 Total 100 100 100 The formula for calculating Simpson’s index is:    1NN 1nn D     ii Where N = the total number of all organisms ni = the numbers of individuals of each individual species The lower the value of D, the greater is the species diversity. Take for example community 1 in the table 1 above. The values of (n-1) and ni(n-1) in the computation of D are shown in table 2 opposite.
  • 15.
    Simpson’s Index Scale:Level of Diversity 1 no diversity 0.9 extremely low diversity 0.8 very low diversity 0.7 low diversity 0.6 moderate-low diversity 0.5 moderate diversity 0.4 moderate-high diversity 0.3 high diversity 0.2 very high diversity 0.1 extremely high diversity 0 infinite diversity