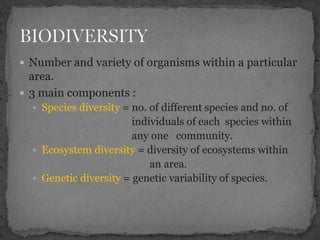
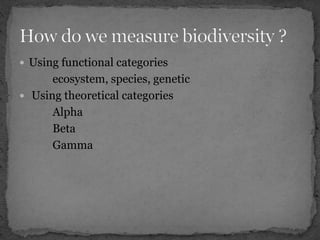
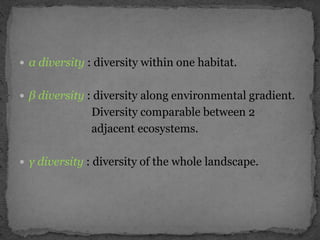
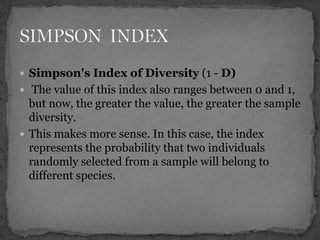
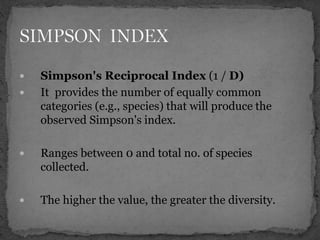
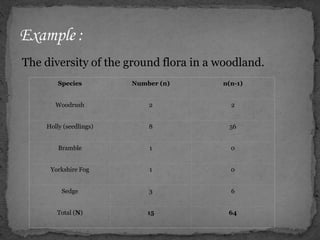
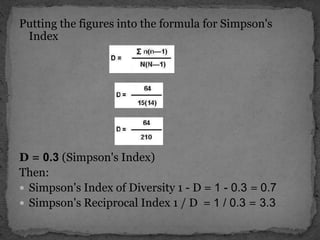
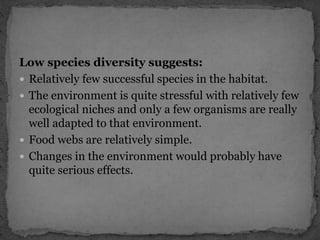
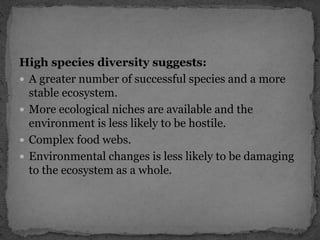
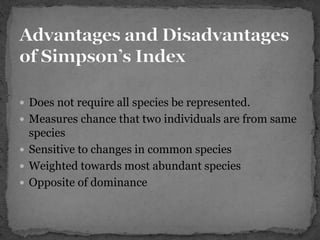
BY
PRIYANKA KUJUR
M.SC. ZOOLOGY
 Number and variety of organisms within a particular
area.
 3 main components :
 Species diversity = no. of different species and no. of
individuals of each species within
any one community.
 Ecosystem diversity = diversity of ecosystems within
an area.
 Genetic diversity = genetic variability of species.
 Using functional categories
ecosystem, species, genetic
 Using theoretical categories
Alpha
Beta
Gamma
 α diversity : diversity within one habitat.
 β diversity : diversity along environmental gradient.
Diversity comparable between 2
adjacent ecosystems.
 γ diversity : diversity of the whole landscape.
 To get a better description of the community we need
to get a measure of species richness and evenness of
their distribution.
 Over 60 indices are used in ecology to measure
biodiversity.
 Indices are used to measure proportional abundance.
 Two major forms :
Dominance Indices (eg. Simpson index)
Information Indices (eg. Shannon Weiner index)
 The Simpson index was introduced in 1949
by Edward H. Simpson.
 This index assumes that the proportion of
individuals in an area indicates their importance to
diversity.
 So, it measures not only diversity but dominance as
well.
 Simpson’s index considered a dominance index
because it weights towards the abundance of the
most common species.
 Can actually refer to any one of 3 closely related
indices.
 Simpson's Index (D) measures the probability
that two individuals randomly selected from a
sample will belong to the same species.
 There are two versions of the formula for
calculating D.
D = (n / N)2
n = the total number of organisms of a particular species
N = the total number of organisms of all species
 The value of D ranges between 0 and 1.
 With this index, 0 represents infinite diversity and 1,
no diversity. That is, the bigger the value of D, the
lower the diversity.
 This is neither intuitive nor logical, so to get over
this problem, D is often subtracted from 1 to give:
 Simpson's Index of Diversity (1 - D)
 The value of this index also ranges between 0 and 1,
but now, the greater the value, the greater the sample
diversity.
 This makes more sense. In this case, the index
represents the probability that two individuals
randomly selected from a sample will belong to
different species.
 Simpson's Reciprocal Index (1 / D)
 It provides the number of equally common
categories (e.g., species) that will produce the
observed Simpson's index.
 Ranges between 0 and total no. of species
collected.
 The higher the value, the greater the diversity.
The diversity of the ground flora in a woodland.
Species Number (n) n(n-1)
Woodrush 2 2
Holly (seedlings) 8 56
Bramble 1 0
Yorkshire Fog 1 0
Sedge 3 6
Total (N) 15 64
Putting the figures into the formula for Simpson's
Index
D = 0.3 (Simpson's Index)
Then:
 Simpson's Index of Diversity 1 - D = 1 - 0.3 = 0.7
 Simpson's Reciprocal Index 1 / D = 1 / 0.3 = 3.3
Low species diversity suggests:
 Relatively few successful species in the habitat.
 The environment is quite stressful with relatively few
ecological niches and only a few organisms are really
well adapted to that environment.
 Food webs are relatively simple.
 Changes in the environment would probably have
quite serious effects.
High species diversity suggests:
 A greater number of successful species and a more
stable ecosystem.
 More ecological niches are available and the
environment is less likely to be hostile.
 Complex food webs.
 Environmental changes is less likely to be damaging
to the ecosystem as a whole.
 Does not require all species be represented.
 Measures chance that two individuals are from same
species
 Sensitive to changes in common species
 Weighted towards most abundant species
 Opposite of dominance
Simpson index

Simpson index

  • 2.
  • 3.
     Number andvariety of organisms within a particular area.  3 main components :  Species diversity = no. of different species and no. of individuals of each species within any one community.  Ecosystem diversity = diversity of ecosystems within an area.  Genetic diversity = genetic variability of species.
  • 4.
     Using functionalcategories ecosystem, species, genetic  Using theoretical categories Alpha Beta Gamma
  • 5.
     α diversity: diversity within one habitat.  β diversity : diversity along environmental gradient. Diversity comparable between 2 adjacent ecosystems.  γ diversity : diversity of the whole landscape.
  • 6.
     To geta better description of the community we need to get a measure of species richness and evenness of their distribution.  Over 60 indices are used in ecology to measure biodiversity.  Indices are used to measure proportional abundance.  Two major forms : Dominance Indices (eg. Simpson index) Information Indices (eg. Shannon Weiner index)
  • 7.
     The Simpsonindex was introduced in 1949 by Edward H. Simpson.  This index assumes that the proportion of individuals in an area indicates their importance to diversity.  So, it measures not only diversity but dominance as well.  Simpson’s index considered a dominance index because it weights towards the abundance of the most common species.
  • 8.
     Can actuallyrefer to any one of 3 closely related indices.  Simpson's Index (D) measures the probability that two individuals randomly selected from a sample will belong to the same species.  There are two versions of the formula for calculating D. D = (n / N)2 n = the total number of organisms of a particular species N = the total number of organisms of all species
  • 9.
     The valueof D ranges between 0 and 1.  With this index, 0 represents infinite diversity and 1, no diversity. That is, the bigger the value of D, the lower the diversity.  This is neither intuitive nor logical, so to get over this problem, D is often subtracted from 1 to give:
  • 10.
     Simpson's Indexof Diversity (1 - D)  The value of this index also ranges between 0 and 1, but now, the greater the value, the greater the sample diversity.  This makes more sense. In this case, the index represents the probability that two individuals randomly selected from a sample will belong to different species.
  • 11.
     Simpson's ReciprocalIndex (1 / D)  It provides the number of equally common categories (e.g., species) that will produce the observed Simpson's index.  Ranges between 0 and total no. of species collected.  The higher the value, the greater the diversity.
  • 12.
    The diversity ofthe ground flora in a woodland. Species Number (n) n(n-1) Woodrush 2 2 Holly (seedlings) 8 56 Bramble 1 0 Yorkshire Fog 1 0 Sedge 3 6 Total (N) 15 64
  • 13.
    Putting the figuresinto the formula for Simpson's Index D = 0.3 (Simpson's Index) Then:  Simpson's Index of Diversity 1 - D = 1 - 0.3 = 0.7  Simpson's Reciprocal Index 1 / D = 1 / 0.3 = 3.3
  • 14.
    Low species diversitysuggests:  Relatively few successful species in the habitat.  The environment is quite stressful with relatively few ecological niches and only a few organisms are really well adapted to that environment.  Food webs are relatively simple.  Changes in the environment would probably have quite serious effects.
  • 15.
    High species diversitysuggests:  A greater number of successful species and a more stable ecosystem.  More ecological niches are available and the environment is less likely to be hostile.  Complex food webs.  Environmental changes is less likely to be damaging to the ecosystem as a whole.
  • 16.
     Does notrequire all species be represented.  Measures chance that two individuals are from same species  Sensitive to changes in common species  Weighted towards most abundant species  Opposite of dominance