SlideShare a Scribd company logo
Submitted by,
KONDURI ARUN
AEM-2018-20-06
INTRODUCTION:
 The term biodiversity was first coined by the entomologist E.O. WILSON
in 1986.
 Biodiversity is the heritage of million years of evolution.
 Diversity is a basic property of life.
 The striking feature of earth is the existence of life and the striking feature
of life is its diversity.
What is biodiversity?
In its simplest form, biological diversity is the variety of
different types of organisms present and interacting in an ecosystem.
BIODIVERSITY INDEX:
Introduction:
A diversity index is a mathematical measure of species diversity in a
community. Diversity indices provide more information about community
composition than simply species richness (i.e., the number of species present).
How do we measure biodiversity?
Use theoretical categories*
 Alpha
 Beta
 Gamma
Alpha diversity
 Diversity within a particular sample.
It refers to the average species diversity in habitat or specific area.
It is a local measure.
Beta Diversity
It refers to the ratio between local or alpha diversity and
regional diversity.
→ This is the diversity between two habitats or regions.
Gamma Diversity
It is a total diversity of landscape.
It is combination of both alpha and beta diversity.
 E.g. diversity of a forest landscape.
TYPES OF BIODIVERSITY INDICES:
1. Species richness
2. Simpson's index
3. Shannon-Wiener index
4. Evenness
1. RICHNESS: It is the total number of species found in an environment or
sample. This is quantitative description.
Richness is a simple numerical count of the number of different
types of organisms present. Species richness is a count of the number of
species that are present. Taxonomic richness is a count of the number of
different taxons present. One would presume that more species equals
more diversity.
However, comparing two areas of equal species richness may
show that they are not equally diverse. For example, lets consider a list of
tree species in two forest ecosystems:
Community A Community B
Water Oak Water Oak
Post Oak Post Oak
Blackjack Oak Hickory
Live Oak Pine
Bur Oak Cedar Elm
Pin Oak Pecan
Hickory Black Walnut
Although each community has seven different species, in A all are within
the same genus (and thus the same family, order, class, and division), whereas in
B we have representatives of six genera, four families, two orders, two classes,
and two divisions. Clearly B is more diverse.
Richness tends to increase over area. In other words, a larger area
will harbor more different species, probably because of a larger variety of
microhabitats and resources. Additionally, sampling over a larger area
increases the chance of finding rare species.
2.Simpson's Diversity Indices: Is the probability that two randomly
selected individuals belong to two different species/categories.
The term 'Simpson's Diversity Index' can actually refer to any one of
3 closely related indices.
a) Simpson's Index (D): measures the probability that two individuals
randomly selected from a sample will belong to the same species (or some
category other than species). There are two versions of the formula for
calculating D. Either is acceptable, but be consistent.
D =(n / N)2 (or)
n = the total number of organisms of a particular species
N = the total number of organisms of all species
The value of D ranges between 0 and 1.
With this index, 0 represents infinite diversity and 1, no diversity.
That is, the bigger the value of D, the lower the diversity. This is neither
intuitive nor logical, so to get over this problem, D is often subtracted
from 1 to give:
b) Simpson's Index of Diversity (1-D):
The value of this index also ranges between 0 and 1, but now, the
greater the value, the greater the sample diversity. This makes more sense.
In this case, the index represents the probability that two individuals
randomly selected from a sample will belong to different species.
Another way of overcoming the problem of the counter-intuitive
nature of Simpson's Index is to take the reciprocal of the Index:
a) Simpson's Reciprocal Index (1/D):
The value of this index starts with 1 as the lowest possible
figure. This figure would represent a community containing only one
species. The higher the value, the greater the diversity. The maximum
value is the number of species (or other category being used) in the
sample. For example if there are five species in the sample, then the
maximum value is 5.
 The name 'Simpson's Diversity Index' is often very loosely applied and all three related indices
described above (Simpson's Index, Simpson's Index of Diversity and Simpson's Reciprocal
Index) have been quoted under this blanket term, depending on author. It is therefore
important to ascertain which index has actually been used in any comparative studies of
diversity.
To calculate Simpson's Index for a particular area, the area must first be sampled. The
number of individuals of each species present in the samples must be noted.
For example, the diversity of the ground flora in a woodland, might be tested
by sampling random quadrants. The number of plant species within each quadrat, as well as the
number of individuals of each species is noted. There is no necessity to be able to identify all the
species, provided they can be distinguished from each other.
Simpson’s index scale: level of biodiversity
1 No diversity
0.9 Extremely low diversity
0.8 Very low biodiversity
0.7 Low biodiversity
0.6 Moderate low biodiversity
0.5 Moderate diversity
0.4 Moderate high diversity
0.3 High diversity
0.2 Very high diversity
0.1 Extremely high diversity
0 Infinite diversity
3. SHANNON INDEX: Methods: The Shannon diversity index (H) is
another index that is commonly used to characterize species diversity in a
community. Like Simpson's index, Shannon's index accounts for both
abundance and evenness of the species present.
The Shannon index has been a popular diversity index in the
ecological literature, where it is also known as Shannon's diversity index,
the Shannon-Wiener index, the Shannon entropy.
 Shannon Wiener Index:
s
H’ = -∑pi logepi
i=l
H’ = Value of SW diversity index.
 pi = Proportion of the ith species.
 loge = Natural logarithm of pi.
 s = Number of species in community.
Typical values are generally between 1.5 and 3.5 in most ecological
studies, and the index is rarely greater than 4. The Shannon index
increases as both the richness and the evenness of the community
increase.
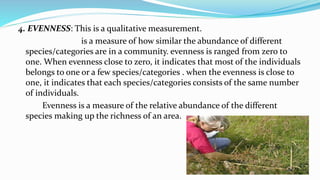
4. EVENNESS: This is a qualitative measurement.
is a measure of how similar the abundance of different
species/categories are in a community. evenness is ranged from zero to
one. When evenness close to zero, it indicates that most of the individuals
belongs to one or a few species/categories . when the evenness is close to
one, it indicates that each species/categories consists of the same number
of individuals.
Evenness is a measure of the relative abundance of the different
species making up the richness of an area.
NUMBER OF INDIVIDUALS
Flower species SAMPLE -A SAMPLE-B
Daisy 300 20
Dandelions 335 49
Buttercup 365 931
total 1000 1000
As species richness and evenness increase, so diversity
increases. Simpson's Diversity Index is a measure of
diversity which takes into accounts both richness and
evenness.
To give an example, we might have sampled two different fields
for wildflowers. The sample from the first field consists of 300 daisies, 335
dandelions and 365 buttercups. The sample from the second field
comprises 20 daisies, 49 dandelions and 931 buttercups (see the table
below). Both samples have the same richness (3 species) and the same
total number of individuals (1000). However, the first sample has more
evenness than the second. This is because the total number of individuals
in the sample is quite evenly distributed between the three species. In the
second sample, most of the individuals are buttercups, with only a few
daisies and dandelions present. Sample 2 is therefore considered to be less
diverse than sample 1.
Biodiversity indices uses:
 A biodiversity index is a way of measuring biodiversity.
 To restore and maintain the chemical , physical & biological integrity of
the ecosystem.
 Diversity indices provide important information about rarity and
commonness species in a community.
REFERENCE:
 Https://en.wikipedia.org/wiki/Diversity_index
 http://www.tiem.utk.edu/~gross/bioed/bealsmodules/shannonDI.html
 http://aquafind.com/articles/Biodiversity-Indices.php
THANK YOU

More Related Content

What's hot

Laws of limiting factors
Laws of limiting factors Laws of limiting factors
Laws of limiting factors
Surjya Kumar Saikia
 
Ecological niche
Ecological niche Ecological niche
Ecological niche
Dr. Karri Ramarao
 
Community ecology
Community ecologyCommunity ecology
Community ecology
Vidya Kalaivani Rajkumar
 
Community ecology
Community ecology Community ecology
Community ecology
Smawi GH
 
Species concepts 4
Species concepts 4Species concepts 4
Species concepts 4
Aftab Badshah
 
Mimicry (Evolutionary Biology)
Mimicry (Evolutionary Biology)Mimicry (Evolutionary Biology)
Mimicry (Evolutionary Biology)
Jsjahnabi
 
Speciation
SpeciationSpeciation
Speciation
Lumen Learning
 
Ecological indices report 2222222
Ecological indices report 2222222Ecological indices report 2222222
Ecological indices report 2222222
Hotaru Imai
 
Niche concept
Niche conceptNiche concept
Species concept
Species conceptSpecies concept
Species concept
Noor Zada
 
Population growth curves
Population growth curvesPopulation growth curves
Population growth curves
Kader Mullah
 
Law of limiting factors
Law of limiting factorsLaw of limiting factors
Law of limiting factors
ramkumarlodhi4
 
Optimal Foraging Theory (OFT)
Optimal Foraging Theory (OFT)Optimal Foraging Theory (OFT)
Optimal Foraging Theory (OFT)
Tikeshkumar7
 
Rep isolating mechanism evolution final
Rep isolating mechanism evolution finalRep isolating mechanism evolution final
Rep isolating mechanism evolution final
Naeem Ahmed
 
Competition intra and inter-specific
Competition  intra and inter-specificCompetition  intra and inter-specific
Competition intra and inter-specific
Ajay Sharma
 
Limiting factors
Limiting factorsLimiting factors
Limiting factors
Aftab Badshah
 
Zoologic al nomenclatures 5
Zoologic al nomenclatures 5Zoologic al nomenclatures 5
Zoologic al nomenclatures 5
Aftab Badshah
 
zonations of sea and ecological classification of marine biota
 zonations of sea and ecological classification of marine biota  zonations of sea and ecological classification of marine biota
zonations of sea and ecological classification of marine biota
Mariyam Nazeer Agha
 
Population counting method line transect, point count, mark and recapture
Population counting method line transect, point count, mark and recapturePopulation counting method line transect, point count, mark and recapture
Population counting method line transect, point count, mark and recapture
Tarique Bin Aziz
 
Species concept
Species conceptSpecies concept
Species concept
Alen Shaji
 

What's hot (20)

Laws of limiting factors
Laws of limiting factors Laws of limiting factors
Laws of limiting factors
 
Ecological niche
Ecological niche Ecological niche
Ecological niche
 
Community ecology
Community ecologyCommunity ecology
Community ecology
 
Community ecology
Community ecology Community ecology
Community ecology
 
Species concepts 4
Species concepts 4Species concepts 4
Species concepts 4
 
Mimicry (Evolutionary Biology)
Mimicry (Evolutionary Biology)Mimicry (Evolutionary Biology)
Mimicry (Evolutionary Biology)
 
Speciation
SpeciationSpeciation
Speciation
 
Ecological indices report 2222222
Ecological indices report 2222222Ecological indices report 2222222
Ecological indices report 2222222
 
Niche concept
Niche conceptNiche concept
Niche concept
 
Species concept
Species conceptSpecies concept
Species concept
 
Population growth curves
Population growth curvesPopulation growth curves
Population growth curves
 
Law of limiting factors
Law of limiting factorsLaw of limiting factors
Law of limiting factors
 
Optimal Foraging Theory (OFT)
Optimal Foraging Theory (OFT)Optimal Foraging Theory (OFT)
Optimal Foraging Theory (OFT)
 
Rep isolating mechanism evolution final
Rep isolating mechanism evolution finalRep isolating mechanism evolution final
Rep isolating mechanism evolution final
 
Competition intra and inter-specific
Competition  intra and inter-specificCompetition  intra and inter-specific
Competition intra and inter-specific
 
Limiting factors
Limiting factorsLimiting factors
Limiting factors
 
Zoologic al nomenclatures 5
Zoologic al nomenclatures 5Zoologic al nomenclatures 5
Zoologic al nomenclatures 5
 
zonations of sea and ecological classification of marine biota
 zonations of sea and ecological classification of marine biota  zonations of sea and ecological classification of marine biota
zonations of sea and ecological classification of marine biota
 
Population counting method line transect, point count, mark and recapture
Population counting method line transect, point count, mark and recapturePopulation counting method line transect, point count, mark and recapture
Population counting method line transect, point count, mark and recapture
 
Species concept
Species conceptSpecies concept
Species concept
 

Similar to biodiversity indices

Species diversity ist practical
Species diversity ist practicalSpecies diversity ist practical
Species diversity ist practical
asarfajar
 
Biodiversity quantification ppt @ rp sir.
Biodiversity quantification ppt @ rp sir.Biodiversity quantification ppt @ rp sir.
Biodiversity quantification ppt @ rp sir.
EAMANISIVASURYATEJA
 
BIO.pptx
BIO.pptxBIO.pptx
Lecture note on Biodiversity conservation
Lecture note on Biodiversity conservationLecture note on Biodiversity conservation
Lecture note on Biodiversity conservation
Talemos Seta
 
Introduction to Biodiversity
Introduction to  BiodiversityIntroduction to  Biodiversity
Introduction to BiodiversityMark McGinley
 
Levels of biodiversity (Plant Biodiversity)
Levels of biodiversity (Plant Biodiversity)Levels of biodiversity (Plant Biodiversity)
Levels of biodiversity (Plant Biodiversity)
nishakataria10
 
Biodiversity_Species_Diversity - Copy.pptx
Biodiversity_Species_Diversity - Copy.pptxBiodiversity_Species_Diversity - Copy.pptx
Biodiversity_Species_Diversity - Copy.pptx
EleazarValenciaIII1
 
Measurment of biodiversity surendra patel
Measurment of biodiversity surendra patelMeasurment of biodiversity surendra patel
Measurment of biodiversity surendra patel
SurendraPatel34
 
Symbiotic Lion King
Symbiotic Lion KingSymbiotic Lion King
Symbiotic Lion King
Christina Padilla
 
Cape biology uni 2 -_ecosystems_population_ecology_and_practical_methods_of_e...
Cape biology uni 2 -_ecosystems_population_ecology_and_practical_methods_of_e...Cape biology uni 2 -_ecosystems_population_ecology_and_practical_methods_of_e...
Cape biology uni 2 -_ecosystems_population_ecology_and_practical_methods_of_e...
Hilton Ritch
 
Biodiversity
Biodiversity Biodiversity
Biodiversity
K Lipinski
 
bio.ppt
bio.pptbio.ppt
bio.ppt
vibha79
 
populationdynamicspresentation-130313073741-phpapp02.pdf
populationdynamicspresentation-130313073741-phpapp02.pdfpopulationdynamicspresentation-130313073741-phpapp02.pdf
populationdynamicspresentation-130313073741-phpapp02.pdf
KifleLentiro1
 
Measuring Biodiversity
Measuring BiodiversityMeasuring Biodiversity
Measuring Biodiversity
Hawkesdale P12 College
 
Analysis of community
Analysis of community Analysis of community
Analysis of community
HarshKumar629060
 
Bioinformatics t6-phylogenetics v2014
Bioinformatics t6-phylogenetics v2014Bioinformatics t6-phylogenetics v2014
Bioinformatics t6-phylogenetics v2014
Prof. Wim Van Criekinge
 
BIOL4120_Lect17.ppt
BIOL4120_Lect17.pptBIOL4120_Lect17.ppt
BIOL4120_Lect17.ppt
LeaCamillePacle
 

Similar to biodiversity indices (20)

Species diversity ist practical
Species diversity ist practicalSpecies diversity ist practical
Species diversity ist practical
 
Biodiversity
BiodiversityBiodiversity
Biodiversity
 
Biodiversity quantification ppt @ rp sir.
Biodiversity quantification ppt @ rp sir.Biodiversity quantification ppt @ rp sir.
Biodiversity quantification ppt @ rp sir.
 
BIO.pptx
BIO.pptxBIO.pptx
BIO.pptx
 
Lecture note on Biodiversity conservation
Lecture note on Biodiversity conservationLecture note on Biodiversity conservation
Lecture note on Biodiversity conservation
 
Introduction to Biodiversity
Introduction to  BiodiversityIntroduction to  Biodiversity
Introduction to Biodiversity
 
Biodiversity um
Biodiversity   umBiodiversity   um
Biodiversity um
 
Levels of biodiversity (Plant Biodiversity)
Levels of biodiversity (Plant Biodiversity)Levels of biodiversity (Plant Biodiversity)
Levels of biodiversity (Plant Biodiversity)
 
Biodiversity_Species_Diversity - Copy.pptx
Biodiversity_Species_Diversity - Copy.pptxBiodiversity_Species_Diversity - Copy.pptx
Biodiversity_Species_Diversity - Copy.pptx
 
Measurment of biodiversity surendra patel
Measurment of biodiversity surendra patelMeasurment of biodiversity surendra patel
Measurment of biodiversity surendra patel
 
Symbiotic Lion King
Symbiotic Lion KingSymbiotic Lion King
Symbiotic Lion King
 
Cape biology uni 2 -_ecosystems_population_ecology_and_practical_methods_of_e...
Cape biology uni 2 -_ecosystems_population_ecology_and_practical_methods_of_e...Cape biology uni 2 -_ecosystems_population_ecology_and_practical_methods_of_e...
Cape biology uni 2 -_ecosystems_population_ecology_and_practical_methods_of_e...
 
Biodiversity
Biodiversity Biodiversity
Biodiversity
 
bio.ppt
bio.pptbio.ppt
bio.ppt
 
populationdynamicspresentation-130313073741-phpapp02.pdf
populationdynamicspresentation-130313073741-phpapp02.pdfpopulationdynamicspresentation-130313073741-phpapp02.pdf
populationdynamicspresentation-130313073741-phpapp02.pdf
 
Measuring Biodiversity
Measuring BiodiversityMeasuring Biodiversity
Measuring Biodiversity
 
Analysis of community
Analysis of community Analysis of community
Analysis of community
 
Biotic Interactions
Biotic InteractionsBiotic Interactions
Biotic Interactions
 
Bioinformatics t6-phylogenetics v2014
Bioinformatics t6-phylogenetics v2014Bioinformatics t6-phylogenetics v2014
Bioinformatics t6-phylogenetics v2014
 
BIOL4120_Lect17.ppt
BIOL4120_Lect17.pptBIOL4120_Lect17.ppt
BIOL4120_Lect17.ppt
 

Recently uploaded

Characterization and the Kinetics of drying at the drying oven and with micro...
Characterization and the Kinetics of drying at the drying oven and with micro...Characterization and the Kinetics of drying at the drying oven and with micro...
Characterization and the Kinetics of drying at the drying oven and with micro...
Open Access Research Paper
 
Celebrating World-environment-day-2024.pdf
Celebrating  World-environment-day-2024.pdfCelebrating  World-environment-day-2024.pdf
Celebrating World-environment-day-2024.pdf
rohankumarsinghrore1
 
Daan Park Hydrangea flower season I like it
Daan Park Hydrangea flower season I like itDaan Park Hydrangea flower season I like it
Daan Park Hydrangea flower season I like it
a0966109726
 
IPCC Vice Chair Ladislaus Change Central Asia Climate Change Conference 27 Ma...
IPCC Vice Chair Ladislaus Change Central Asia Climate Change Conference 27 Ma...IPCC Vice Chair Ladislaus Change Central Asia Climate Change Conference 27 Ma...
IPCC Vice Chair Ladislaus Change Central Asia Climate Change Conference 27 Ma...
ipcc-media
 
ppt on beauty of the nature by Palak.pptx
ppt on  beauty of the nature by Palak.pptxppt on  beauty of the nature by Palak.pptx
ppt on beauty of the nature by Palak.pptx
RaniJaiswal16
 
DRAFT NRW Recreation Strategy - People and Nature thriving together
DRAFT NRW Recreation Strategy - People and Nature thriving togetherDRAFT NRW Recreation Strategy - People and Nature thriving together
DRAFT NRW Recreation Strategy - People and Nature thriving together
Robin Grant
 
growbilliontrees.com-Trees for Granddaughter (1).pdf
growbilliontrees.com-Trees for Granddaughter (1).pdfgrowbilliontrees.com-Trees for Granddaughter (1).pdf
growbilliontrees.com-Trees for Granddaughter (1).pdf
yadavakashagra
 
NRW Board Paper - DRAFT NRW Recreation Strategy
NRW Board Paper - DRAFT NRW Recreation StrategyNRW Board Paper - DRAFT NRW Recreation Strategy
NRW Board Paper - DRAFT NRW Recreation Strategy
Robin Grant
 
Prevalence, biochemical and hematological study of diabetic patients
Prevalence, biochemical and hematological study of diabetic patientsPrevalence, biochemical and hematological study of diabetic patients
Prevalence, biochemical and hematological study of diabetic patients
Open Access Research Paper
 
Micro RNA genes and their likely influence in rice (Oryza sativa L.) dynamic ...
Micro RNA genes and their likely influence in rice (Oryza sativa L.) dynamic ...Micro RNA genes and their likely influence in rice (Oryza sativa L.) dynamic ...
Micro RNA genes and their likely influence in rice (Oryza sativa L.) dynamic ...
Open Access Research Paper
 
Willie Nelson Net Worth: A Journey Through Music, Movies, and Business Ventures
Willie Nelson Net Worth: A Journey Through Music, Movies, and Business VenturesWillie Nelson Net Worth: A Journey Through Music, Movies, and Business Ventures
Willie Nelson Net Worth: A Journey Through Music, Movies, and Business Ventures
greendigital
 
UNDERSTANDING WHAT GREEN WASHING IS!.pdf
UNDERSTANDING WHAT GREEN WASHING IS!.pdfUNDERSTANDING WHAT GREEN WASHING IS!.pdf
UNDERSTANDING WHAT GREEN WASHING IS!.pdf
JulietMogola
 
Environmental Science Book By Dr. Y.K. Singh
Environmental Science Book By Dr. Y.K. SinghEnvironmental Science Book By Dr. Y.K. Singh
Environmental Science Book By Dr. Y.K. Singh
AhmadKhan917612
 
Summary of the Climate and Energy Policy of Australia
Summary of the Climate and Energy Policy of AustraliaSummary of the Climate and Energy Policy of Australia
Summary of the Climate and Energy Policy of Australia
yasmindemoraes1
 
International+e-Commerce+Platform-www.cfye-commerce.shop
International+e-Commerce+Platform-www.cfye-commerce.shopInternational+e-Commerce+Platform-www.cfye-commerce.shop
International+e-Commerce+Platform-www.cfye-commerce.shop
laozhuseo02
 
AGRICULTURE Hydrophonic FERTILISER PPT.pptx
AGRICULTURE Hydrophonic FERTILISER PPT.pptxAGRICULTURE Hydrophonic FERTILISER PPT.pptx
AGRICULTURE Hydrophonic FERTILISER PPT.pptx
BanitaDsouza
 
Artificial Reefs by Kuddle Life Foundation - May 2024
Artificial Reefs by Kuddle Life Foundation - May 2024Artificial Reefs by Kuddle Life Foundation - May 2024
Artificial Reefs by Kuddle Life Foundation - May 2024
punit537210
 
Natural farming @ Dr. Siddhartha S. Jena.pptx
Natural farming @ Dr. Siddhartha S. Jena.pptxNatural farming @ Dr. Siddhartha S. Jena.pptx
Natural farming @ Dr. Siddhartha S. Jena.pptx
sidjena70
 
Bhopal Gas Leak Tragedy - A Night of death
Bhopal Gas Leak Tragedy - A Night of deathBhopal Gas Leak Tragedy - A Night of death
Bhopal Gas Leak Tragedy - A Night of death
upasana742003
 
Presentación Giulio Quaggiotto-Diálogo improbable .pptx.pdf
Presentación Giulio Quaggiotto-Diálogo improbable .pptx.pdfPresentación Giulio Quaggiotto-Diálogo improbable .pptx.pdf
Presentación Giulio Quaggiotto-Diálogo improbable .pptx.pdf
Innovation and Technology for Development Centre
 

Recently uploaded (20)

Characterization and the Kinetics of drying at the drying oven and with micro...
Characterization and the Kinetics of drying at the drying oven and with micro...Characterization and the Kinetics of drying at the drying oven and with micro...
Characterization and the Kinetics of drying at the drying oven and with micro...
 
Celebrating World-environment-day-2024.pdf
Celebrating  World-environment-day-2024.pdfCelebrating  World-environment-day-2024.pdf
Celebrating World-environment-day-2024.pdf
 
Daan Park Hydrangea flower season I like it
Daan Park Hydrangea flower season I like itDaan Park Hydrangea flower season I like it
Daan Park Hydrangea flower season I like it
 
IPCC Vice Chair Ladislaus Change Central Asia Climate Change Conference 27 Ma...
IPCC Vice Chair Ladislaus Change Central Asia Climate Change Conference 27 Ma...IPCC Vice Chair Ladislaus Change Central Asia Climate Change Conference 27 Ma...
IPCC Vice Chair Ladislaus Change Central Asia Climate Change Conference 27 Ma...
 
ppt on beauty of the nature by Palak.pptx
ppt on  beauty of the nature by Palak.pptxppt on  beauty of the nature by Palak.pptx
ppt on beauty of the nature by Palak.pptx
 
DRAFT NRW Recreation Strategy - People and Nature thriving together
DRAFT NRW Recreation Strategy - People and Nature thriving togetherDRAFT NRW Recreation Strategy - People and Nature thriving together
DRAFT NRW Recreation Strategy - People and Nature thriving together
 
growbilliontrees.com-Trees for Granddaughter (1).pdf
growbilliontrees.com-Trees for Granddaughter (1).pdfgrowbilliontrees.com-Trees for Granddaughter (1).pdf
growbilliontrees.com-Trees for Granddaughter (1).pdf
 
NRW Board Paper - DRAFT NRW Recreation Strategy
NRW Board Paper - DRAFT NRW Recreation StrategyNRW Board Paper - DRAFT NRW Recreation Strategy
NRW Board Paper - DRAFT NRW Recreation Strategy
 
Prevalence, biochemical and hematological study of diabetic patients
Prevalence, biochemical and hematological study of diabetic patientsPrevalence, biochemical and hematological study of diabetic patients
Prevalence, biochemical and hematological study of diabetic patients
 
Micro RNA genes and their likely influence in rice (Oryza sativa L.) dynamic ...
Micro RNA genes and their likely influence in rice (Oryza sativa L.) dynamic ...Micro RNA genes and their likely influence in rice (Oryza sativa L.) dynamic ...
Micro RNA genes and their likely influence in rice (Oryza sativa L.) dynamic ...
 
Willie Nelson Net Worth: A Journey Through Music, Movies, and Business Ventures
Willie Nelson Net Worth: A Journey Through Music, Movies, and Business VenturesWillie Nelson Net Worth: A Journey Through Music, Movies, and Business Ventures
Willie Nelson Net Worth: A Journey Through Music, Movies, and Business Ventures
 
UNDERSTANDING WHAT GREEN WASHING IS!.pdf
UNDERSTANDING WHAT GREEN WASHING IS!.pdfUNDERSTANDING WHAT GREEN WASHING IS!.pdf
UNDERSTANDING WHAT GREEN WASHING IS!.pdf
 
Environmental Science Book By Dr. Y.K. Singh
Environmental Science Book By Dr. Y.K. SinghEnvironmental Science Book By Dr. Y.K. Singh
Environmental Science Book By Dr. Y.K. Singh
 
Summary of the Climate and Energy Policy of Australia
Summary of the Climate and Energy Policy of AustraliaSummary of the Climate and Energy Policy of Australia
Summary of the Climate and Energy Policy of Australia
 
International+e-Commerce+Platform-www.cfye-commerce.shop
International+e-Commerce+Platform-www.cfye-commerce.shopInternational+e-Commerce+Platform-www.cfye-commerce.shop
International+e-Commerce+Platform-www.cfye-commerce.shop
 
AGRICULTURE Hydrophonic FERTILISER PPT.pptx
AGRICULTURE Hydrophonic FERTILISER PPT.pptxAGRICULTURE Hydrophonic FERTILISER PPT.pptx
AGRICULTURE Hydrophonic FERTILISER PPT.pptx
 
Artificial Reefs by Kuddle Life Foundation - May 2024
Artificial Reefs by Kuddle Life Foundation - May 2024Artificial Reefs by Kuddle Life Foundation - May 2024
Artificial Reefs by Kuddle Life Foundation - May 2024
 
Natural farming @ Dr. Siddhartha S. Jena.pptx
Natural farming @ Dr. Siddhartha S. Jena.pptxNatural farming @ Dr. Siddhartha S. Jena.pptx
Natural farming @ Dr. Siddhartha S. Jena.pptx
 
Bhopal Gas Leak Tragedy - A Night of death
Bhopal Gas Leak Tragedy - A Night of deathBhopal Gas Leak Tragedy - A Night of death
Bhopal Gas Leak Tragedy - A Night of death
 
Presentación Giulio Quaggiotto-Diálogo improbable .pptx.pdf
Presentación Giulio Quaggiotto-Diálogo improbable .pptx.pdfPresentación Giulio Quaggiotto-Diálogo improbable .pptx.pdf
Presentación Giulio Quaggiotto-Diálogo improbable .pptx.pdf
 

biodiversity indices

  • 2. INTRODUCTION:  The term biodiversity was first coined by the entomologist E.O. WILSON in 1986.  Biodiversity is the heritage of million years of evolution.  Diversity is a basic property of life.  The striking feature of earth is the existence of life and the striking feature of life is its diversity.
  • 3. What is biodiversity? In its simplest form, biological diversity is the variety of different types of organisms present and interacting in an ecosystem.
  • 4. BIODIVERSITY INDEX: Introduction: A diversity index is a mathematical measure of species diversity in a community. Diversity indices provide more information about community composition than simply species richness (i.e., the number of species present).
  • 5. How do we measure biodiversity? Use theoretical categories*  Alpha  Beta  Gamma
  • 6. Alpha diversity  Diversity within a particular sample. It refers to the average species diversity in habitat or specific area. It is a local measure.
  • 7. Beta Diversity It refers to the ratio between local or alpha diversity and regional diversity. → This is the diversity between two habitats or regions.
  • 8. Gamma Diversity It is a total diversity of landscape. It is combination of both alpha and beta diversity.  E.g. diversity of a forest landscape.
  • 9.
  • 10. TYPES OF BIODIVERSITY INDICES: 1. Species richness 2. Simpson's index 3. Shannon-Wiener index 4. Evenness
  • 11. 1. RICHNESS: It is the total number of species found in an environment or sample. This is quantitative description. Richness is a simple numerical count of the number of different types of organisms present. Species richness is a count of the number of species that are present. Taxonomic richness is a count of the number of different taxons present. One would presume that more species equals more diversity. However, comparing two areas of equal species richness may show that they are not equally diverse. For example, lets consider a list of tree species in two forest ecosystems:
  • 12. Community A Community B Water Oak Water Oak Post Oak Post Oak Blackjack Oak Hickory Live Oak Pine Bur Oak Cedar Elm Pin Oak Pecan Hickory Black Walnut Although each community has seven different species, in A all are within the same genus (and thus the same family, order, class, and division), whereas in B we have representatives of six genera, four families, two orders, two classes, and two divisions. Clearly B is more diverse.
  • 13. Richness tends to increase over area. In other words, a larger area will harbor more different species, probably because of a larger variety of microhabitats and resources. Additionally, sampling over a larger area increases the chance of finding rare species.
  • 14. 2.Simpson's Diversity Indices: Is the probability that two randomly selected individuals belong to two different species/categories. The term 'Simpson's Diversity Index' can actually refer to any one of 3 closely related indices. a) Simpson's Index (D): measures the probability that two individuals randomly selected from a sample will belong to the same species (or some category other than species). There are two versions of the formula for calculating D. Either is acceptable, but be consistent. D =(n / N)2 (or) n = the total number of organisms of a particular species N = the total number of organisms of all species The value of D ranges between 0 and 1.
  • 15. With this index, 0 represents infinite diversity and 1, no diversity. That is, the bigger the value of D, the lower the diversity. This is neither intuitive nor logical, so to get over this problem, D is often subtracted from 1 to give: b) Simpson's Index of Diversity (1-D): The value of this index also ranges between 0 and 1, but now, the greater the value, the greater the sample diversity. This makes more sense. In this case, the index represents the probability that two individuals randomly selected from a sample will belong to different species. Another way of overcoming the problem of the counter-intuitive nature of Simpson's Index is to take the reciprocal of the Index:
  • 16. a) Simpson's Reciprocal Index (1/D): The value of this index starts with 1 as the lowest possible figure. This figure would represent a community containing only one species. The higher the value, the greater the diversity. The maximum value is the number of species (or other category being used) in the sample. For example if there are five species in the sample, then the maximum value is 5.
  • 17.  The name 'Simpson's Diversity Index' is often very loosely applied and all three related indices described above (Simpson's Index, Simpson's Index of Diversity and Simpson's Reciprocal Index) have been quoted under this blanket term, depending on author. It is therefore important to ascertain which index has actually been used in any comparative studies of diversity. To calculate Simpson's Index for a particular area, the area must first be sampled. The number of individuals of each species present in the samples must be noted. For example, the diversity of the ground flora in a woodland, might be tested by sampling random quadrants. The number of plant species within each quadrat, as well as the number of individuals of each species is noted. There is no necessity to be able to identify all the species, provided they can be distinguished from each other.
  • 18. Simpson’s index scale: level of biodiversity 1 No diversity 0.9 Extremely low diversity 0.8 Very low biodiversity 0.7 Low biodiversity 0.6 Moderate low biodiversity 0.5 Moderate diversity 0.4 Moderate high diversity 0.3 High diversity 0.2 Very high diversity 0.1 Extremely high diversity 0 Infinite diversity
  • 19. 3. SHANNON INDEX: Methods: The Shannon diversity index (H) is another index that is commonly used to characterize species diversity in a community. Like Simpson's index, Shannon's index accounts for both abundance and evenness of the species present. The Shannon index has been a popular diversity index in the ecological literature, where it is also known as Shannon's diversity index, the Shannon-Wiener index, the Shannon entropy.
  • 20.  Shannon Wiener Index: s H’ = -∑pi logepi i=l H’ = Value of SW diversity index.  pi = Proportion of the ith species.  loge = Natural logarithm of pi.  s = Number of species in community. Typical values are generally between 1.5 and 3.5 in most ecological studies, and the index is rarely greater than 4. The Shannon index increases as both the richness and the evenness of the community increase.
  • 21. 4. EVENNESS: This is a qualitative measurement. is a measure of how similar the abundance of different species/categories are in a community. evenness is ranged from zero to one. When evenness close to zero, it indicates that most of the individuals belongs to one or a few species/categories . when the evenness is close to one, it indicates that each species/categories consists of the same number of individuals. Evenness is a measure of the relative abundance of the different species making up the richness of an area.
  • 22. NUMBER OF INDIVIDUALS Flower species SAMPLE -A SAMPLE-B Daisy 300 20 Dandelions 335 49 Buttercup 365 931 total 1000 1000 As species richness and evenness increase, so diversity increases. Simpson's Diversity Index is a measure of diversity which takes into accounts both richness and evenness.
  • 23. To give an example, we might have sampled two different fields for wildflowers. The sample from the first field consists of 300 daisies, 335 dandelions and 365 buttercups. The sample from the second field comprises 20 daisies, 49 dandelions and 931 buttercups (see the table below). Both samples have the same richness (3 species) and the same total number of individuals (1000). However, the first sample has more evenness than the second. This is because the total number of individuals in the sample is quite evenly distributed between the three species. In the second sample, most of the individuals are buttercups, with only a few daisies and dandelions present. Sample 2 is therefore considered to be less diverse than sample 1.
  • 24. Biodiversity indices uses:  A biodiversity index is a way of measuring biodiversity.  To restore and maintain the chemical , physical & biological integrity of the ecosystem.  Diversity indices provide important information about rarity and commonness species in a community.