Calculation of Species diversity and related indices
•Download as PPTX, PDF•
6 likes•6,400 views

A step by step method for calculation of species diversity, species richness, species evenness and similarity and dissimilarity indices

Recommended
More Related Content
What's hot
What's hot (20)
Viewers also liked
Viewers also liked (20)
Similar to Calculation of Species diversity and related indices
Similar to Calculation of Species diversity and related indices (16)
More from Manideep Raj
More from Manideep Raj (15)
Recently uploaded
Recently uploaded (20)
Calculation of Species diversity and related indices
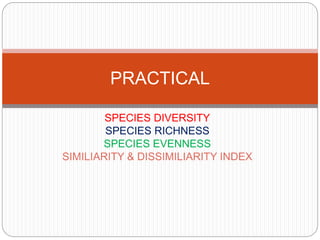
- 1. SPECIES DIVERSITY SPECIES RICHNESS SPECIES EVENNESS SIMILIARITY & DISSIMILIARITY INDEX PRACTICAL
- 2. Q. Calculate the species diversity, species richness and species evenness of the birds of the following two wetlands
- 3. SPECIES DIVERSITY Shanon Weiner Index or
- 16. Species Richness Where S = Number of species present in community N = Number of Individuals in community Species richness of Wetland 1 Species richness of Wetland 2
- 17. Species Evenness Where C = Species Evenness Ḧ = Shanon Weiner Index S = Number of species
- 18. SIMILARITY & DISSIMILARITY INDEX SIMILARITY INDEX Where S = Similarity Index C = Common species to both samples A = Number of species in sample A B = Number of species in sample B DISSIMILARITY INDEX Dissimilarity Index = 1 - S
- 19. SOLUTION We have found that Number of species in Habitat A = 5 Number of species in Habitat B = 6 Common species to A and B = 3
- 20. CALCULATION SIMILARITY INDEX DISSIMILARITY INDEX Dissimilarity Index = 1 - S = 1 – 0.545 = 0.455