Downloaded 466 times
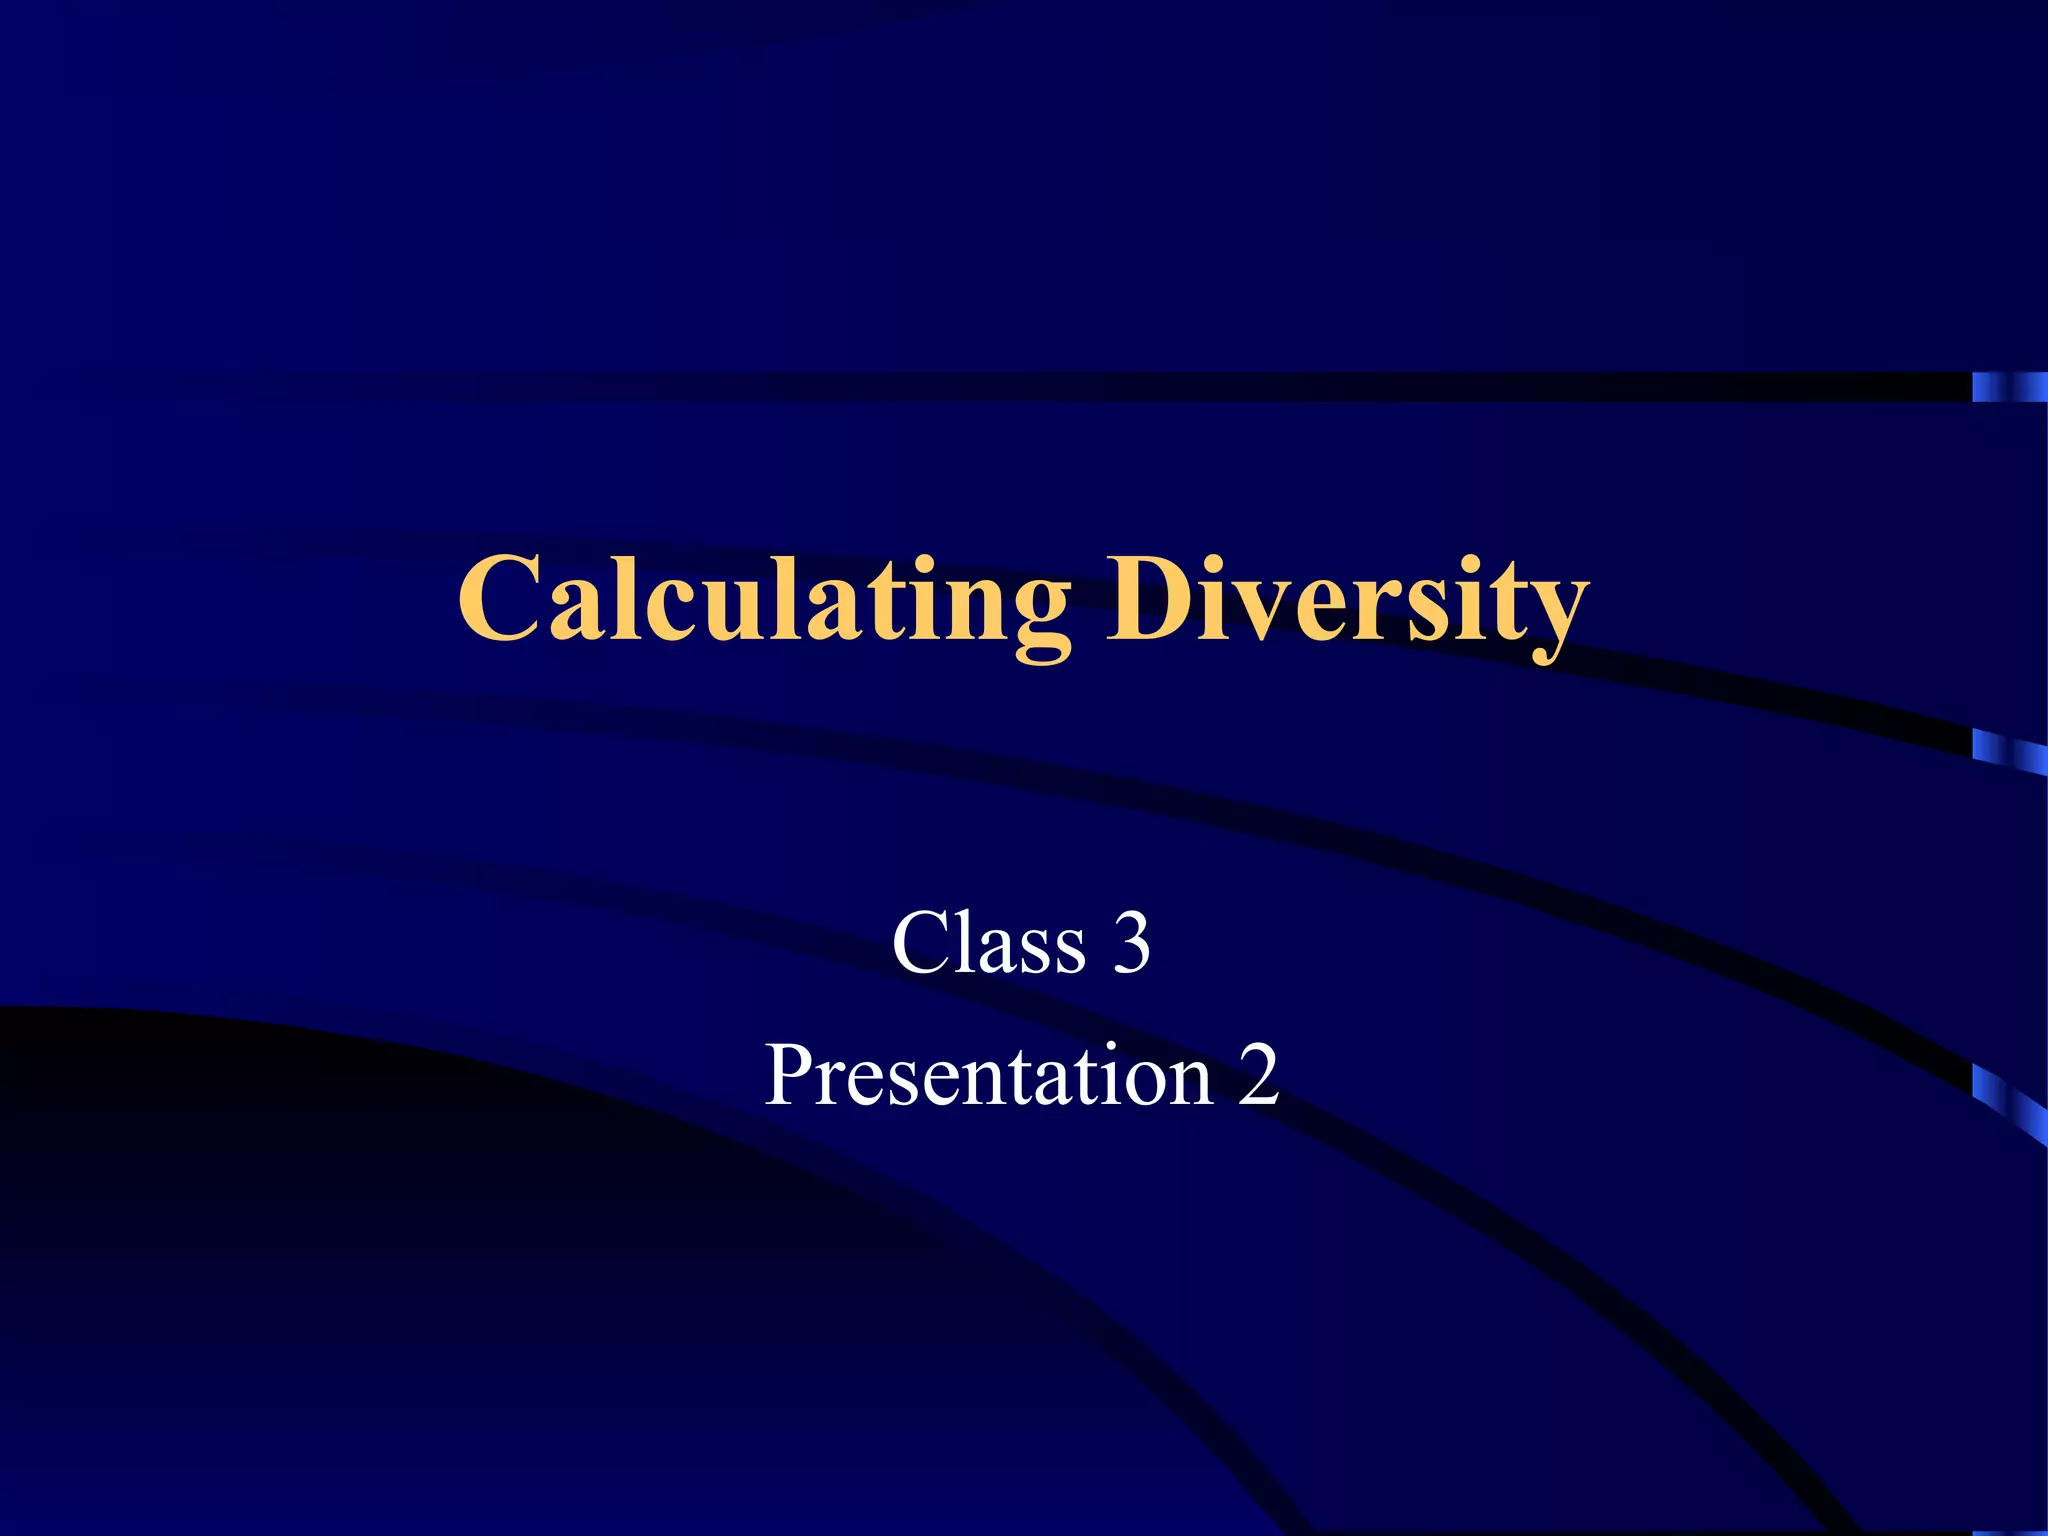

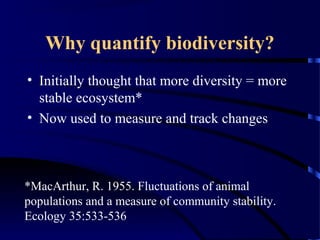
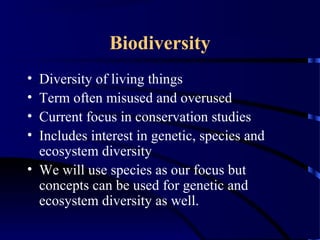
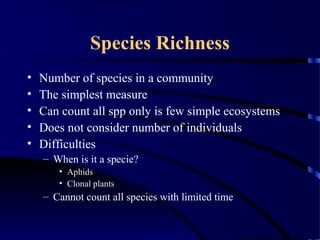
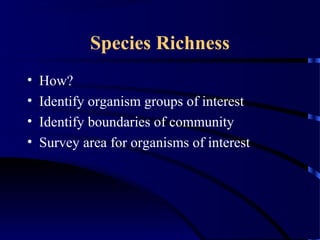
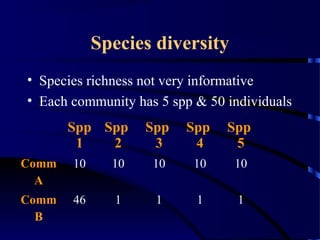
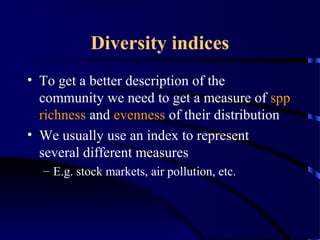
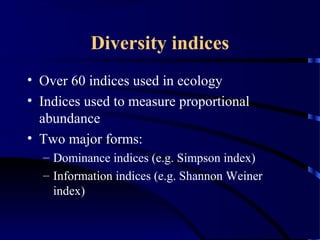
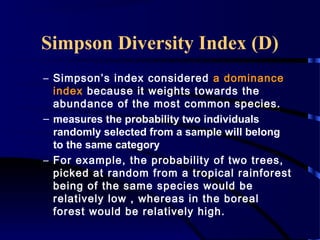
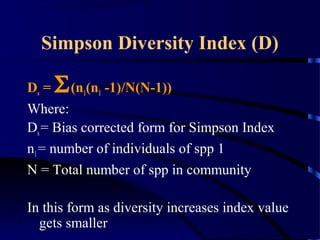
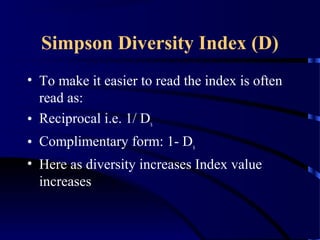
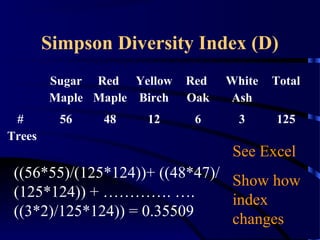
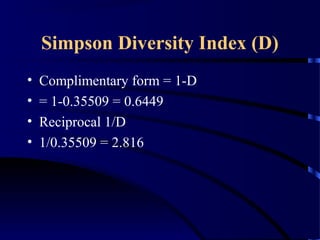
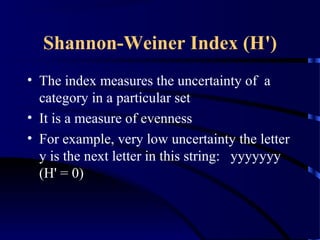


The document outlines a presentation on calculating biodiversity, including methods for measuring diversity indices such as Simpson's and Shannon-Weiner indices. It discusses the importance of biodiversity in ecosystems, different forms of diversity (alpha, beta, gamma), and challenges in assessing species richness. The presentation also emphasizes the role of indices in quantifying community composition and evenness to better understand ecological stability.


![Polymer [ बहुलक ] Chemistry Notes PDF - Irfanullah Mehar - JJ Sir Chemistry.pdf](https://cdn.slidesharecdn.com/ss_thumbnails/polymerchemistrynotespdf-irfanullahmehar-jjsirchemistry-260210172118-3f9b37f7-thumbnail.jpg?width=640&height=640&fit=bounds)


