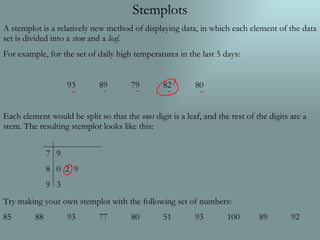
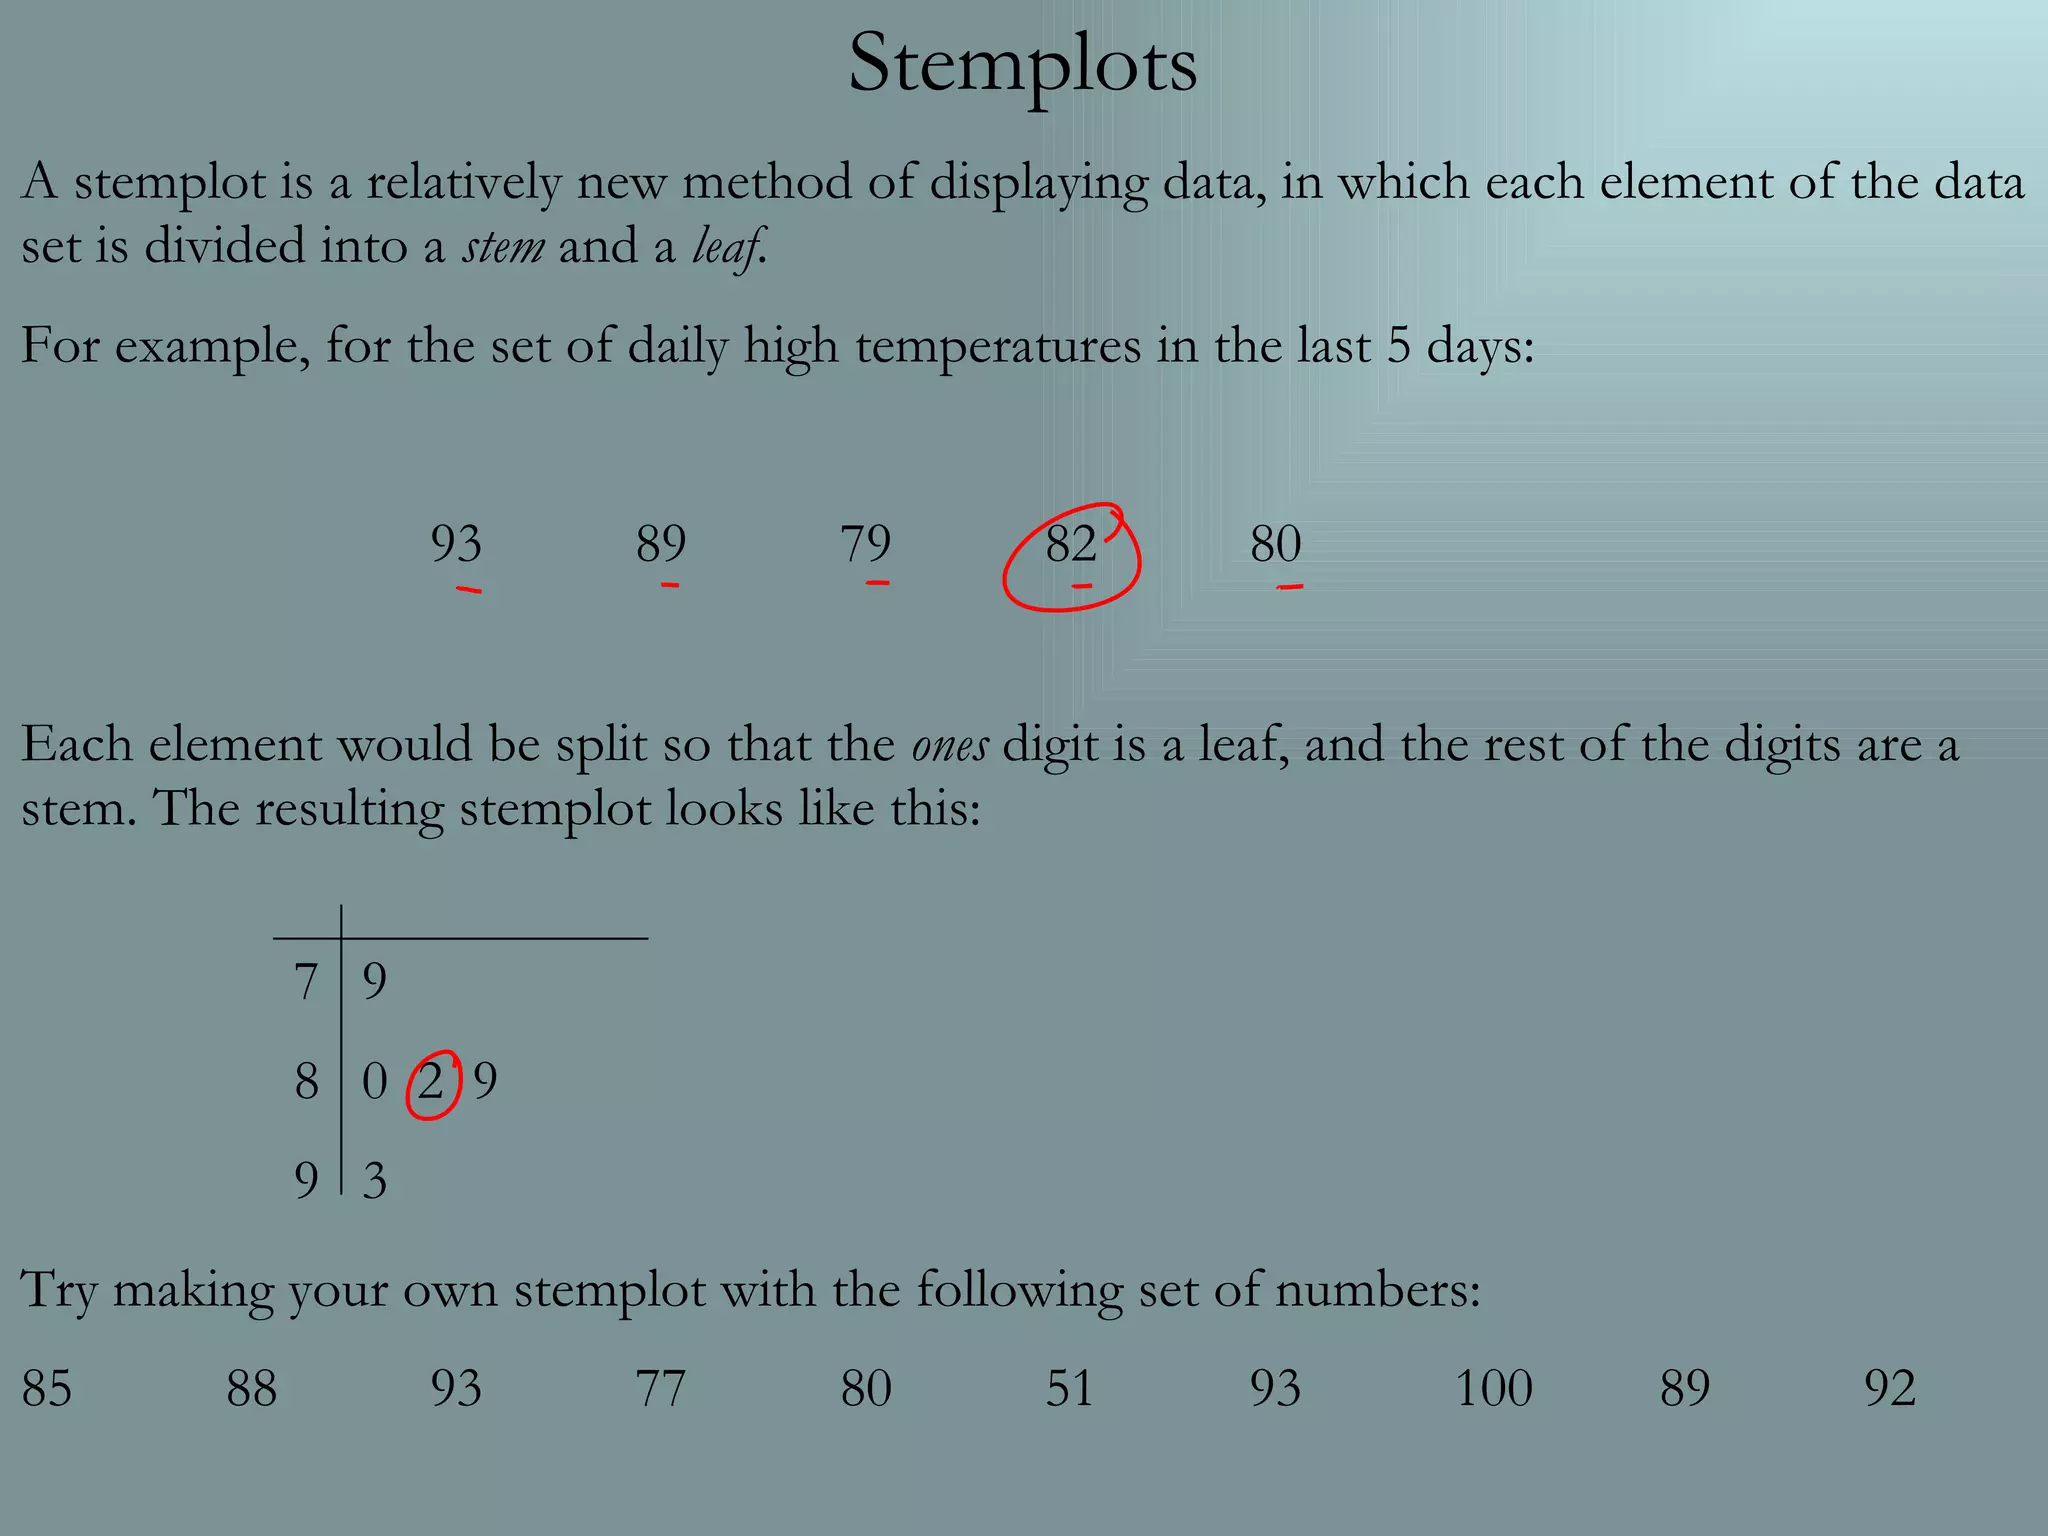
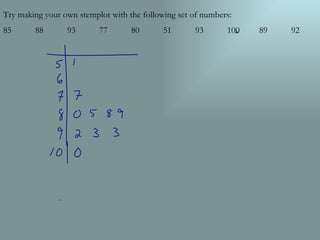
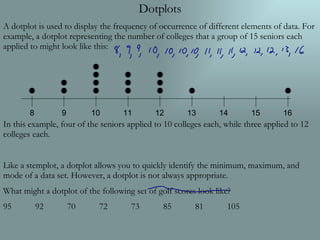
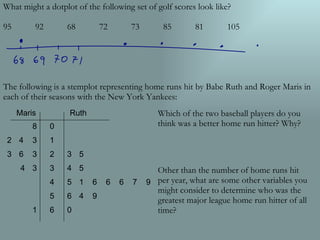
A stemplot is a method to display data by splitting each number into a stem and leaf, with the ones digit as the leaf and other digits as the stem. It allows comparison of two data sets side by side. A dotplot displays the frequency of data values and is useful when the data is categorical. It may not be suitable to display continuous numeric data like golf scores.