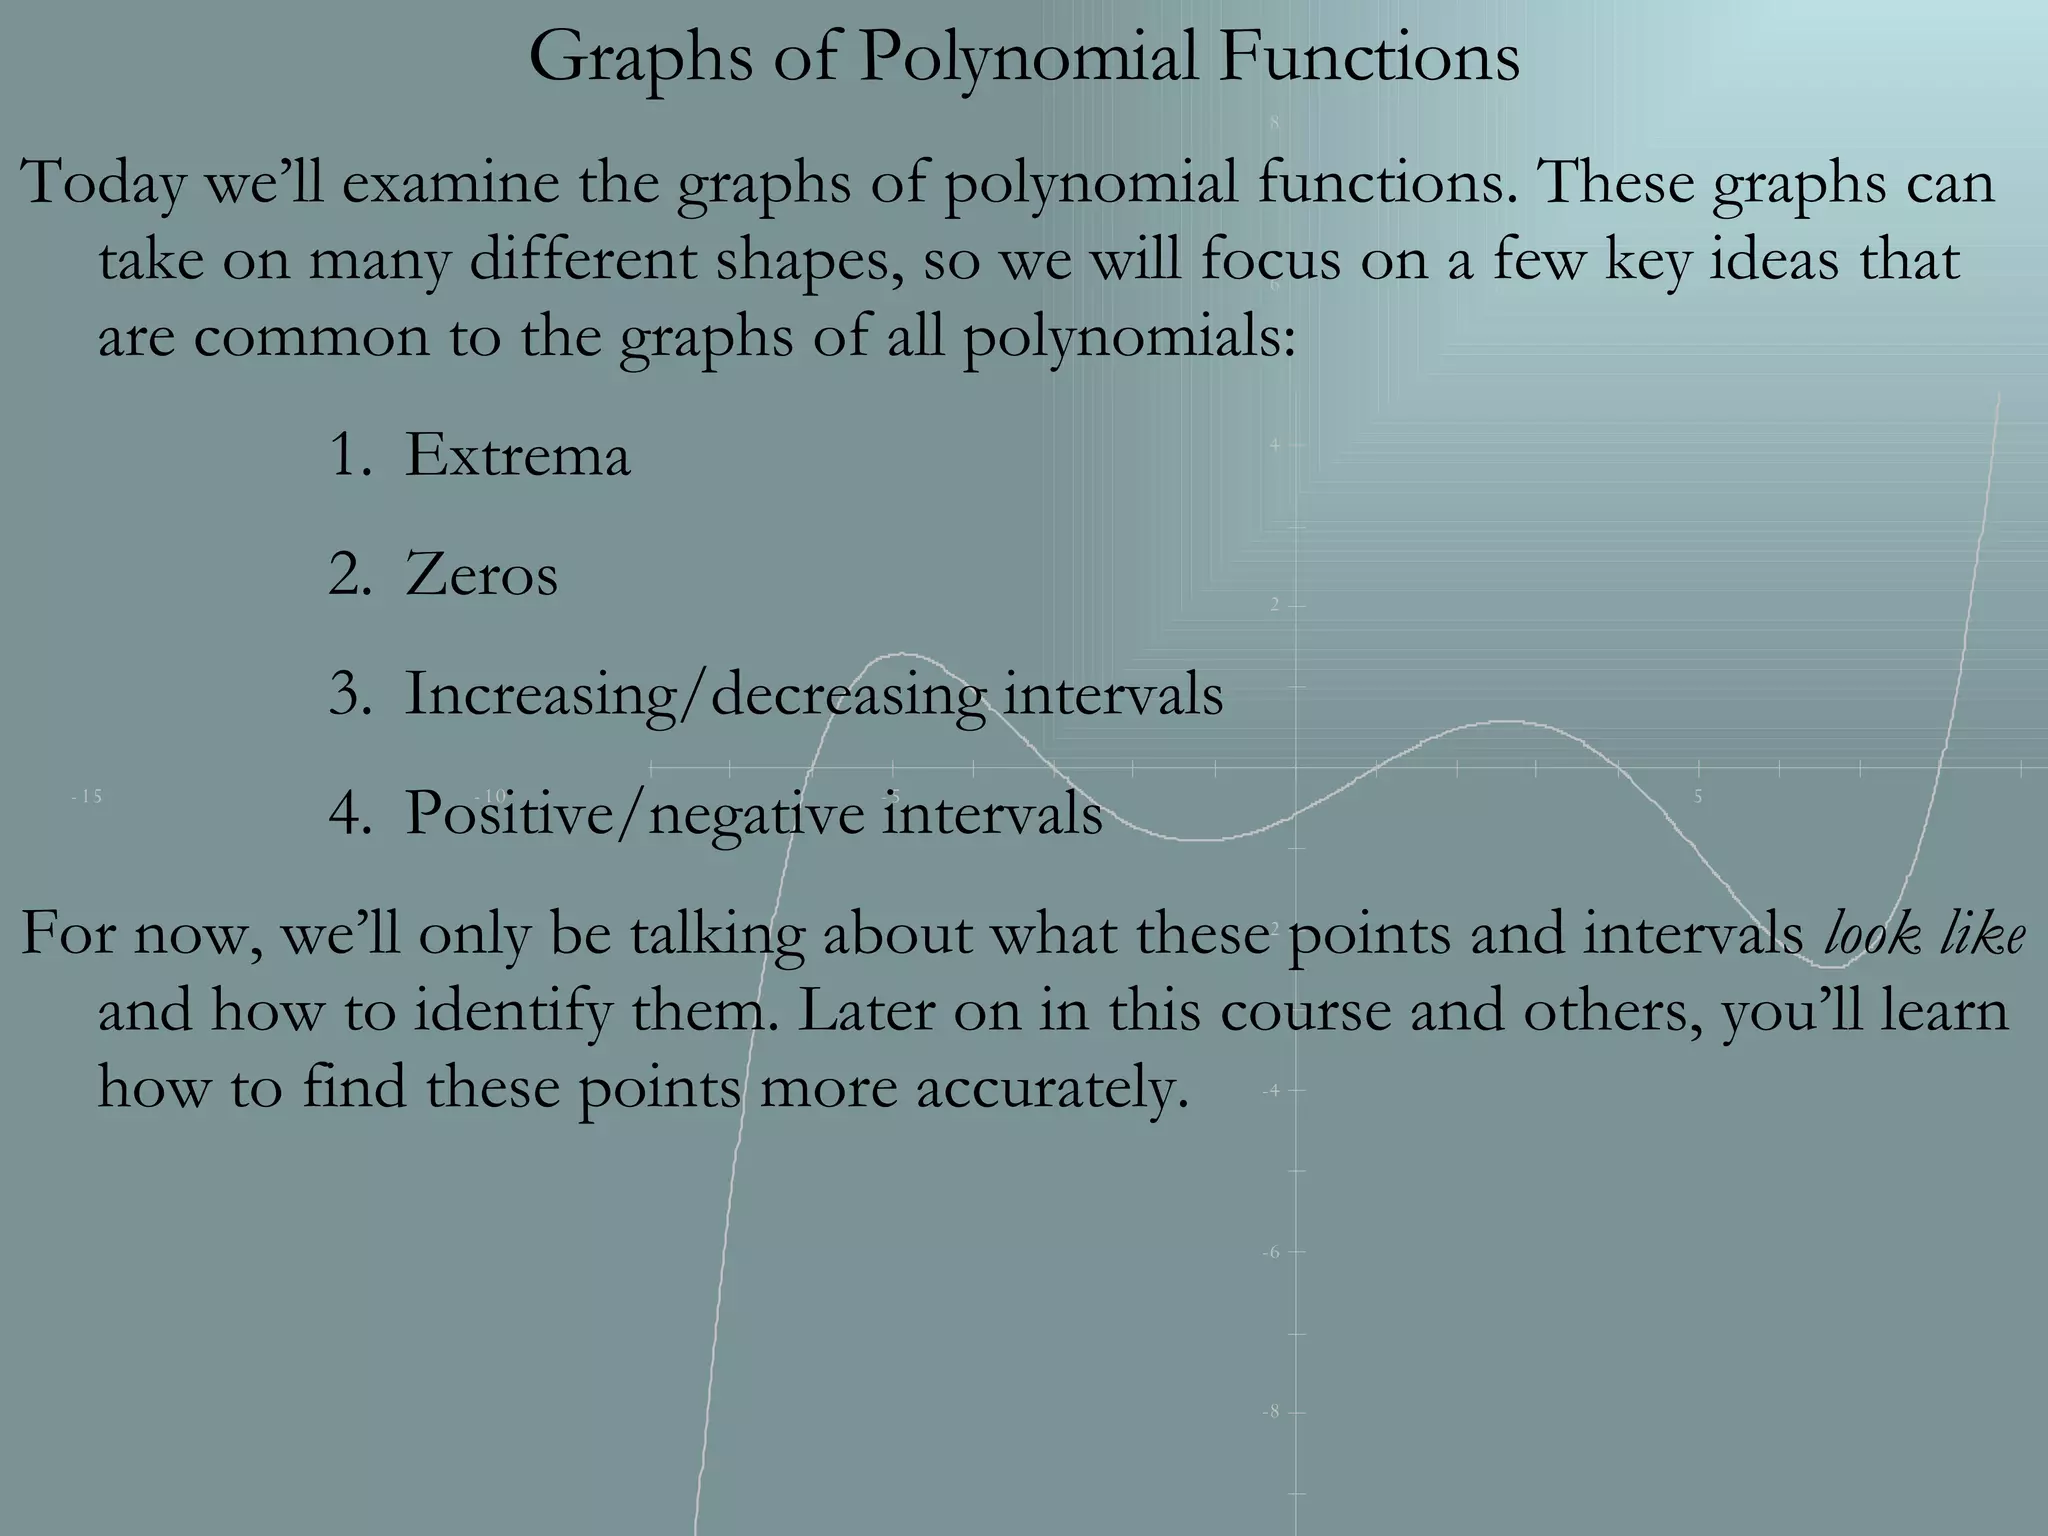
This document discusses key concepts related to graphs of polynomial functions, including:
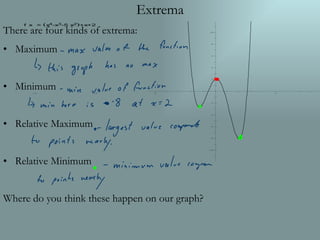
- Extrema (maximum, minimum, relative maximum, relative minimum points) and where they occur on the sample graph
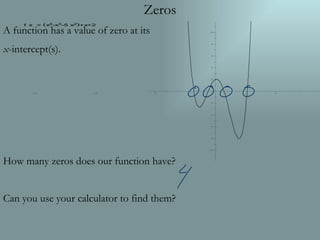
- Zeros (x-intercepts) and that the sample function has four zeros
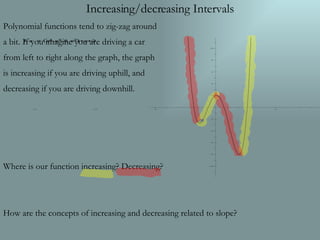
- Increasing and decreasing intervals based on the slope, with the function increasing where driving uphill and decreasing where driving downhill
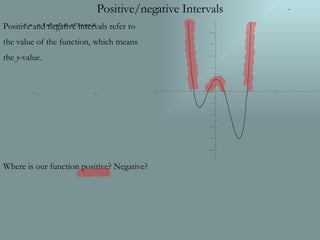
- Positive and negative intervals, referring to where the function is positive or negative based on the y-value.