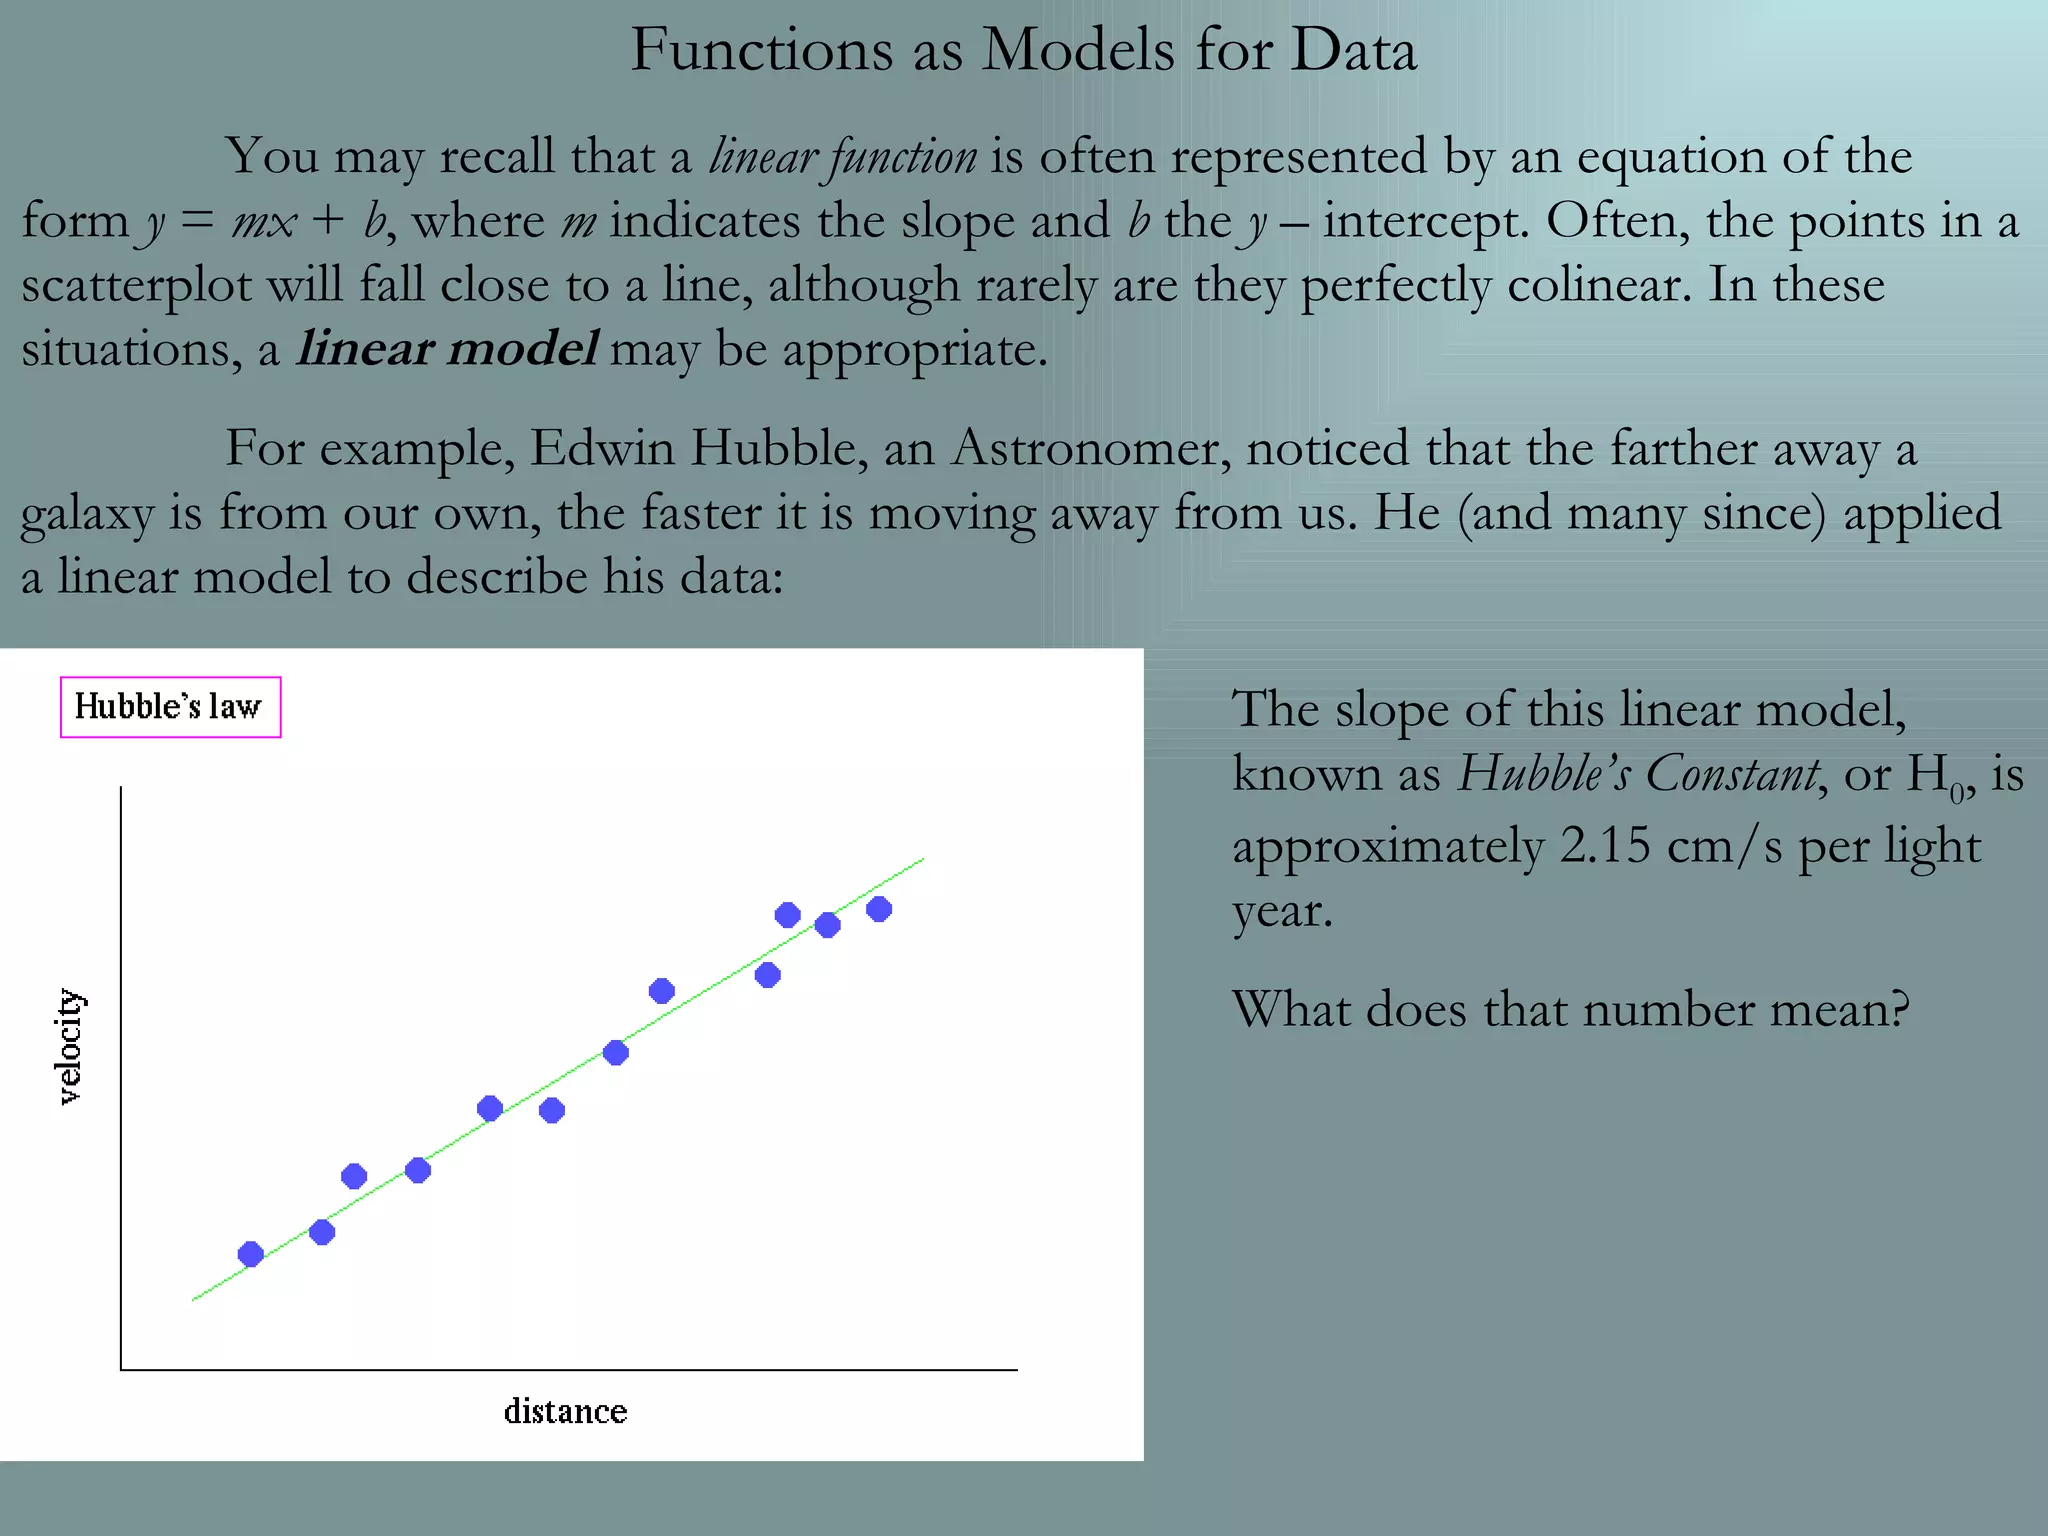
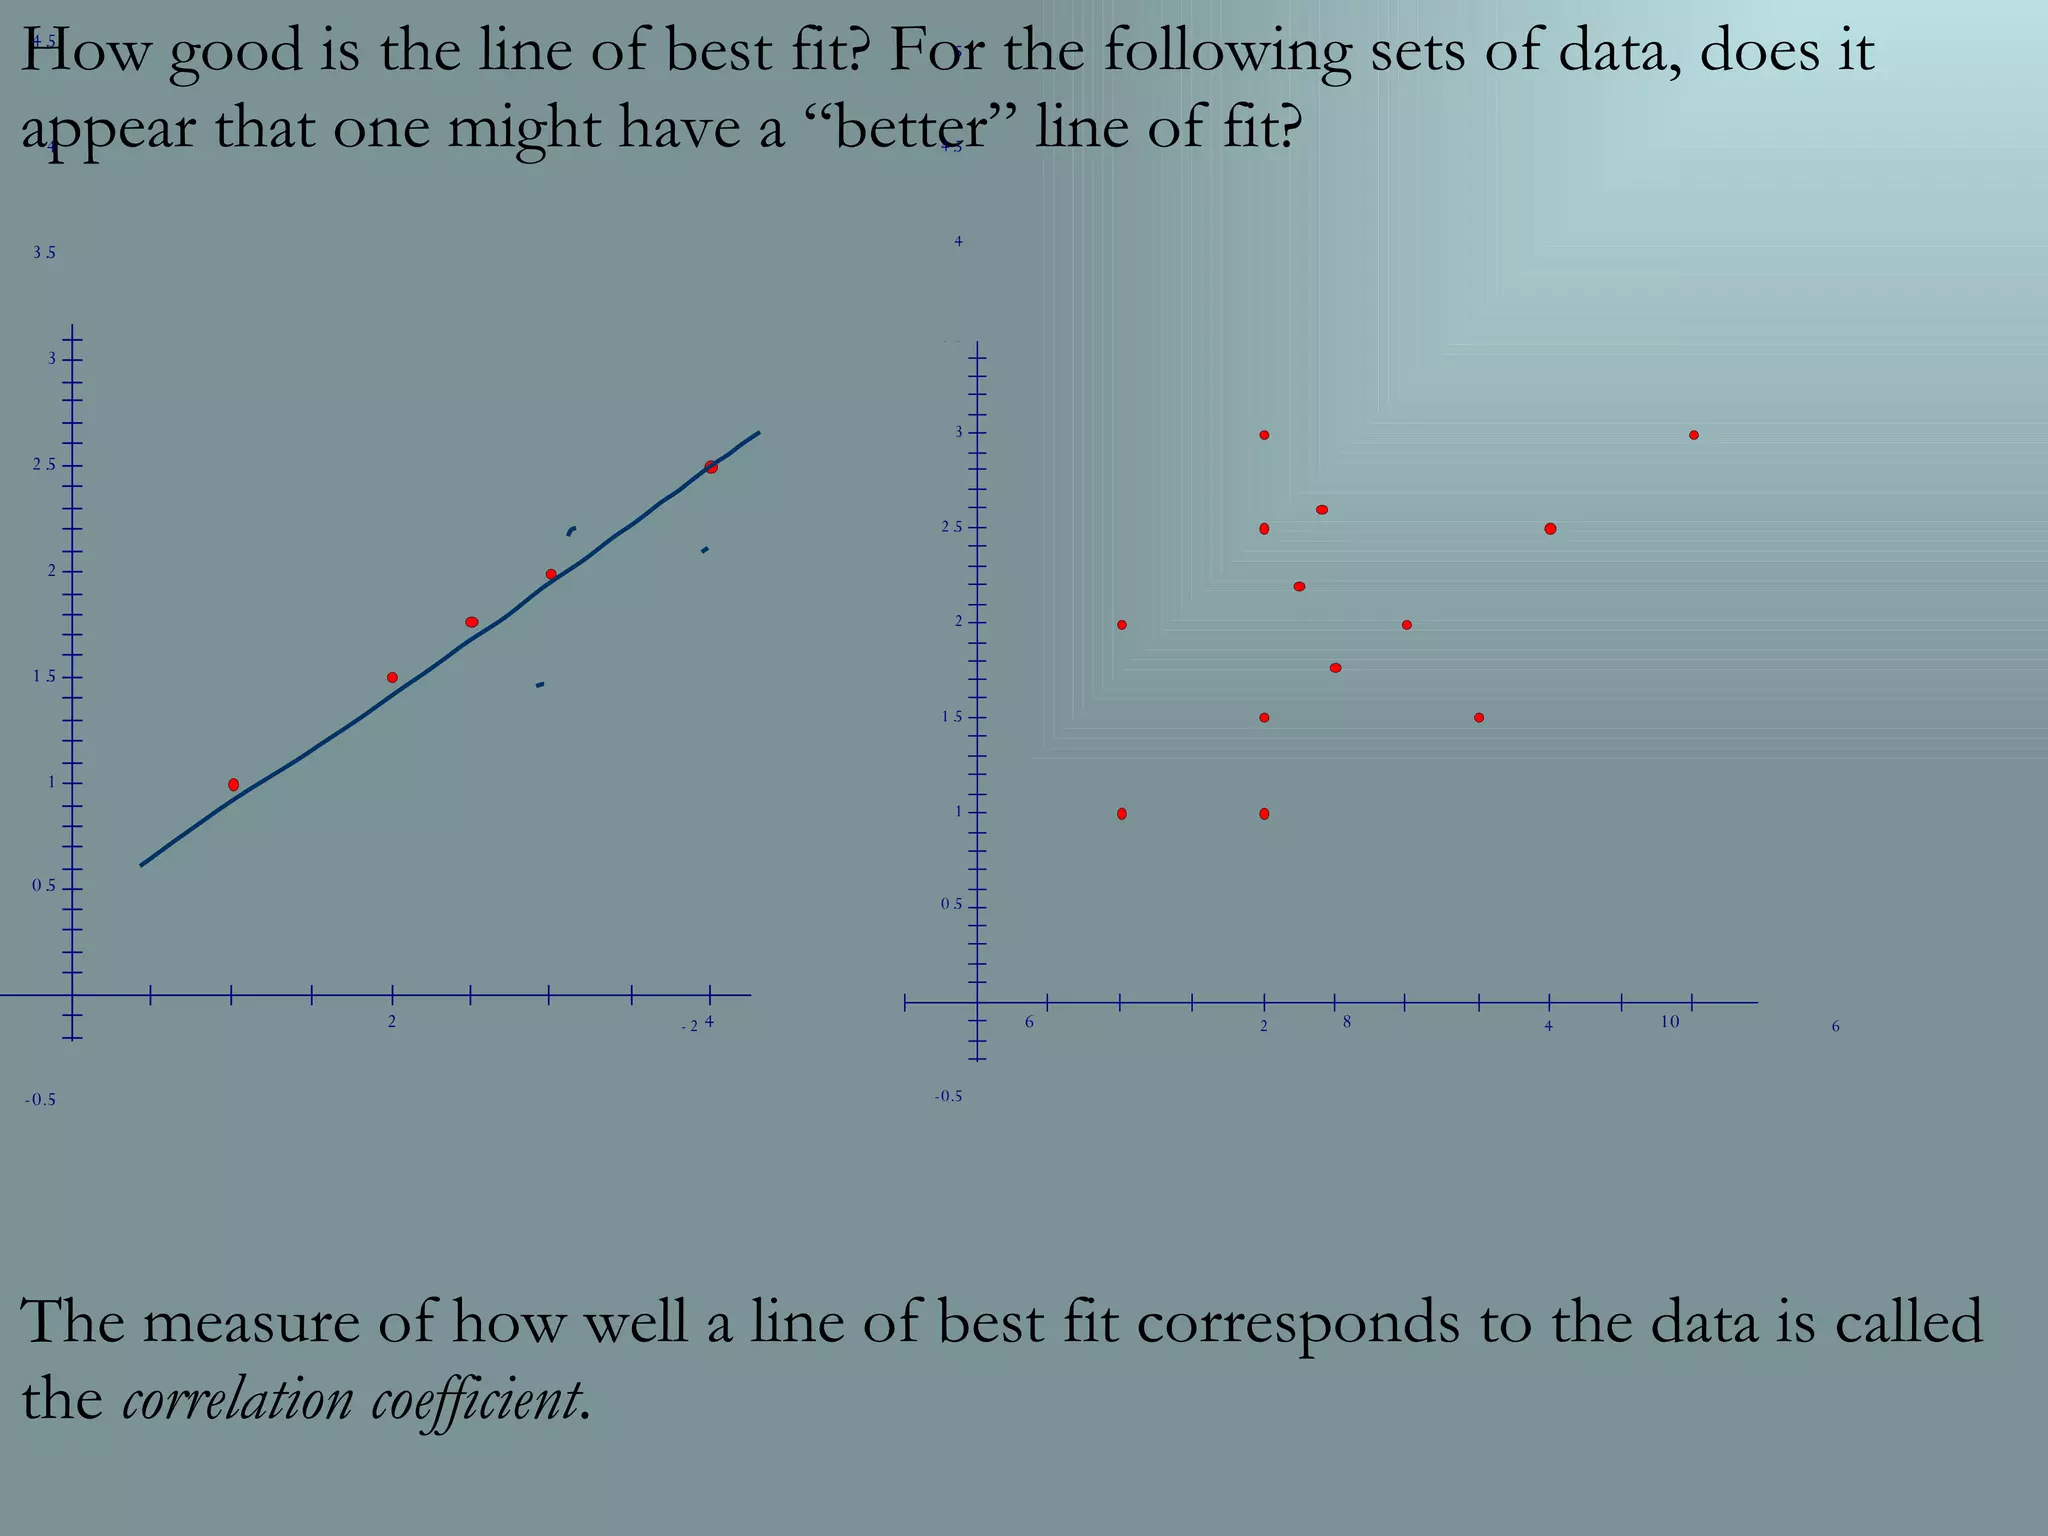
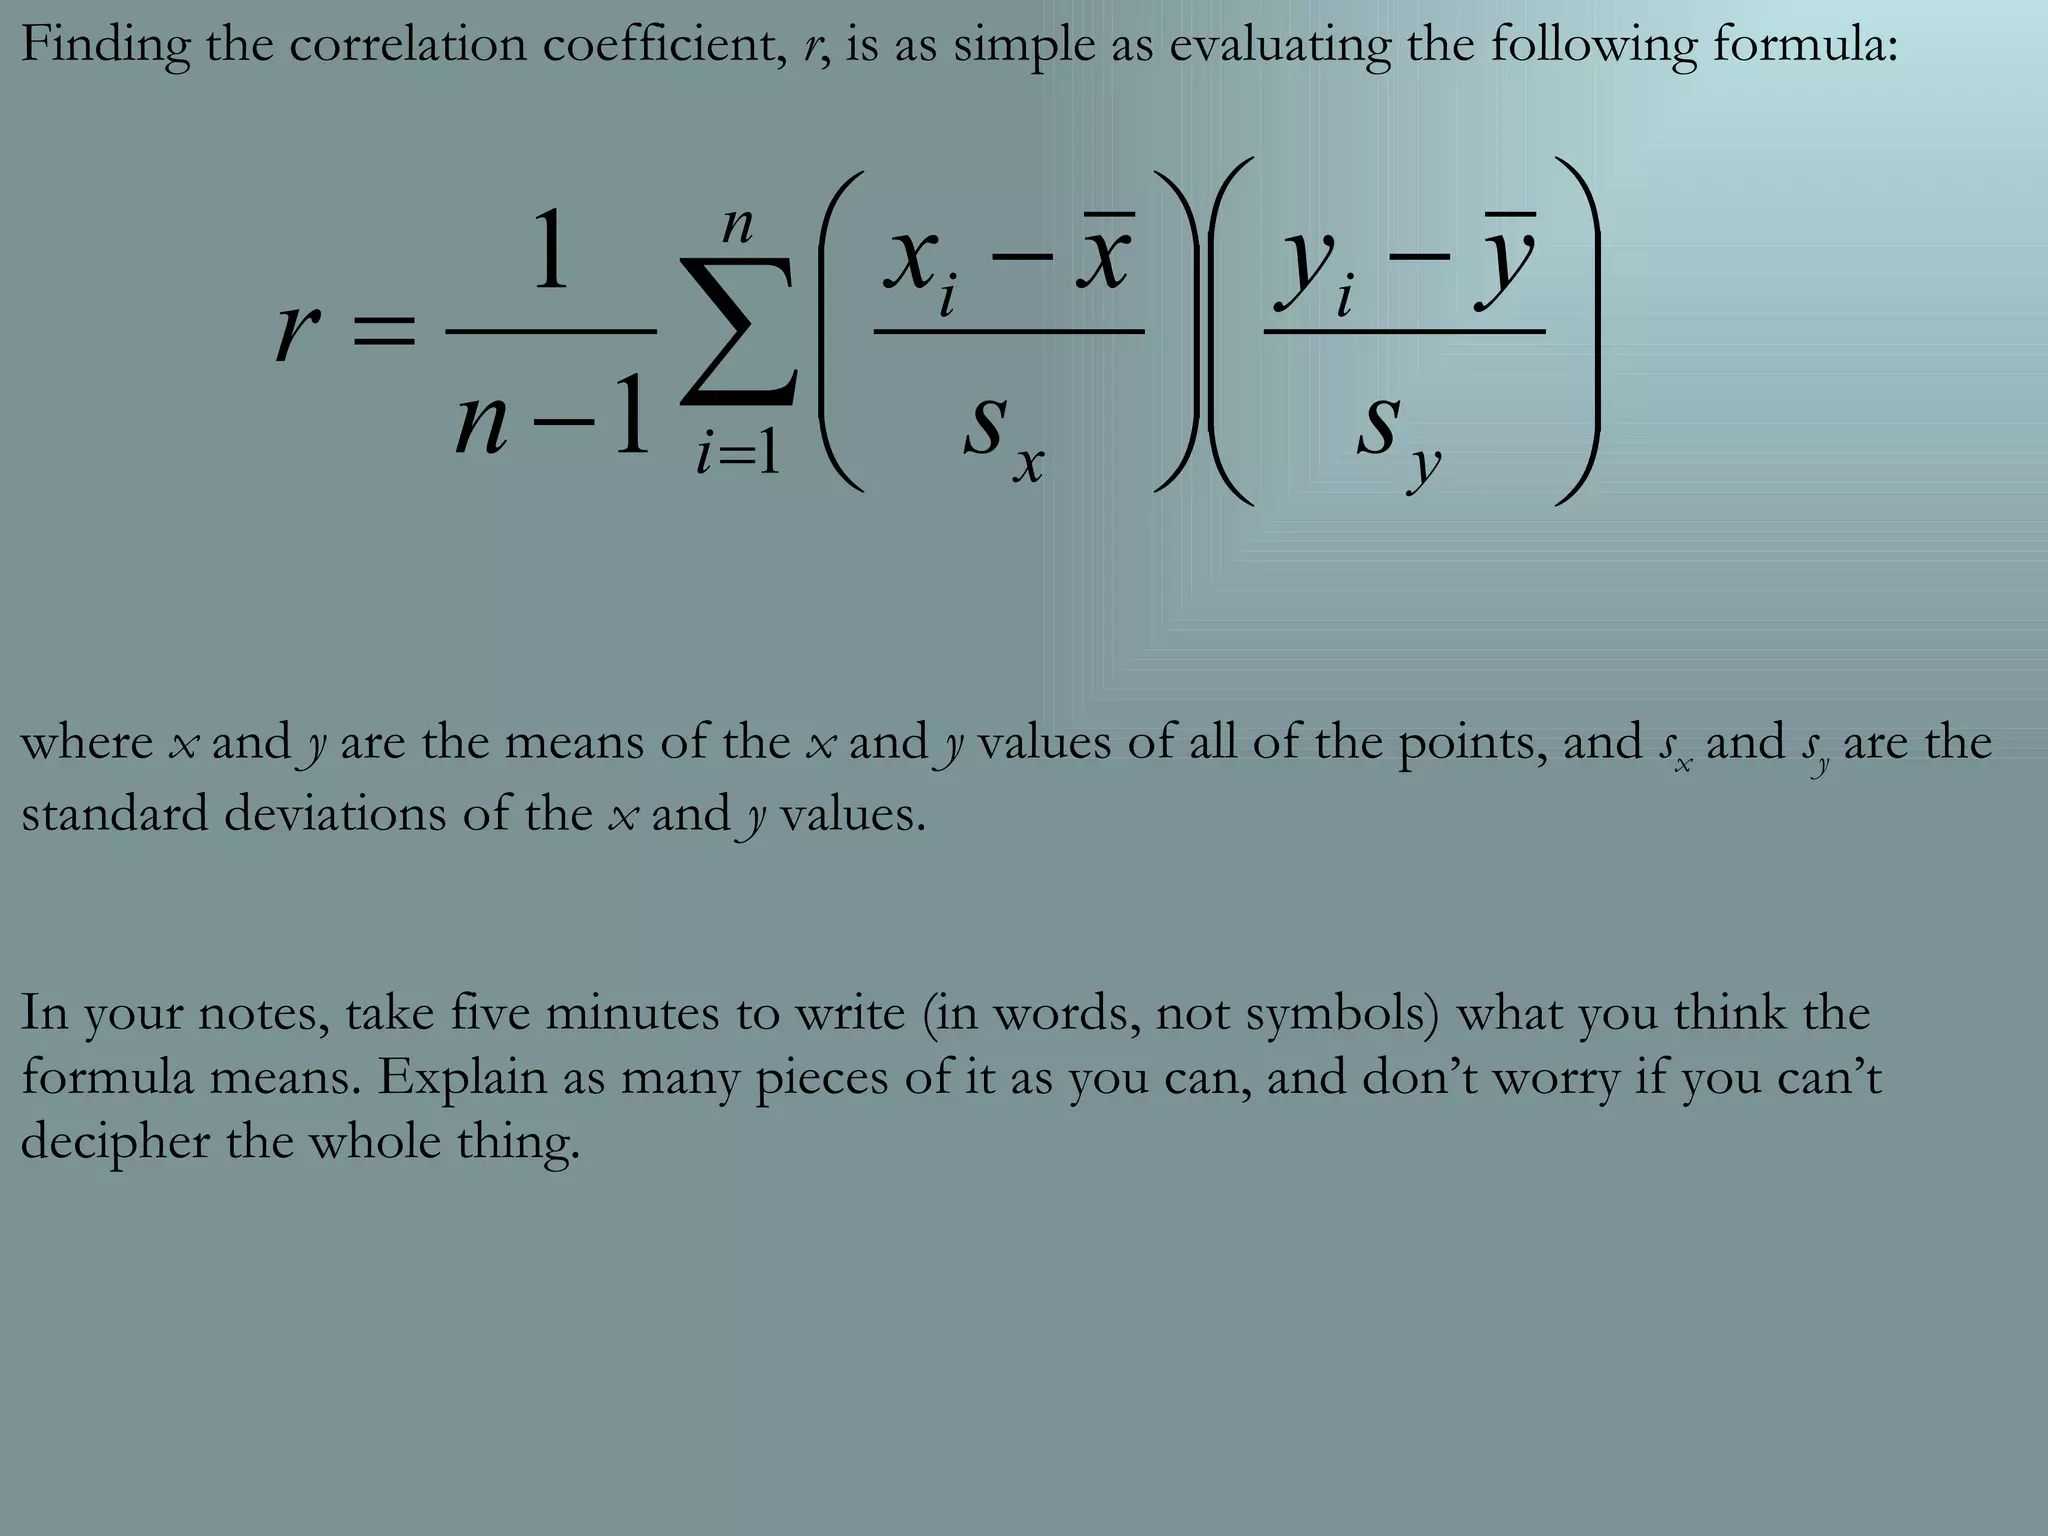
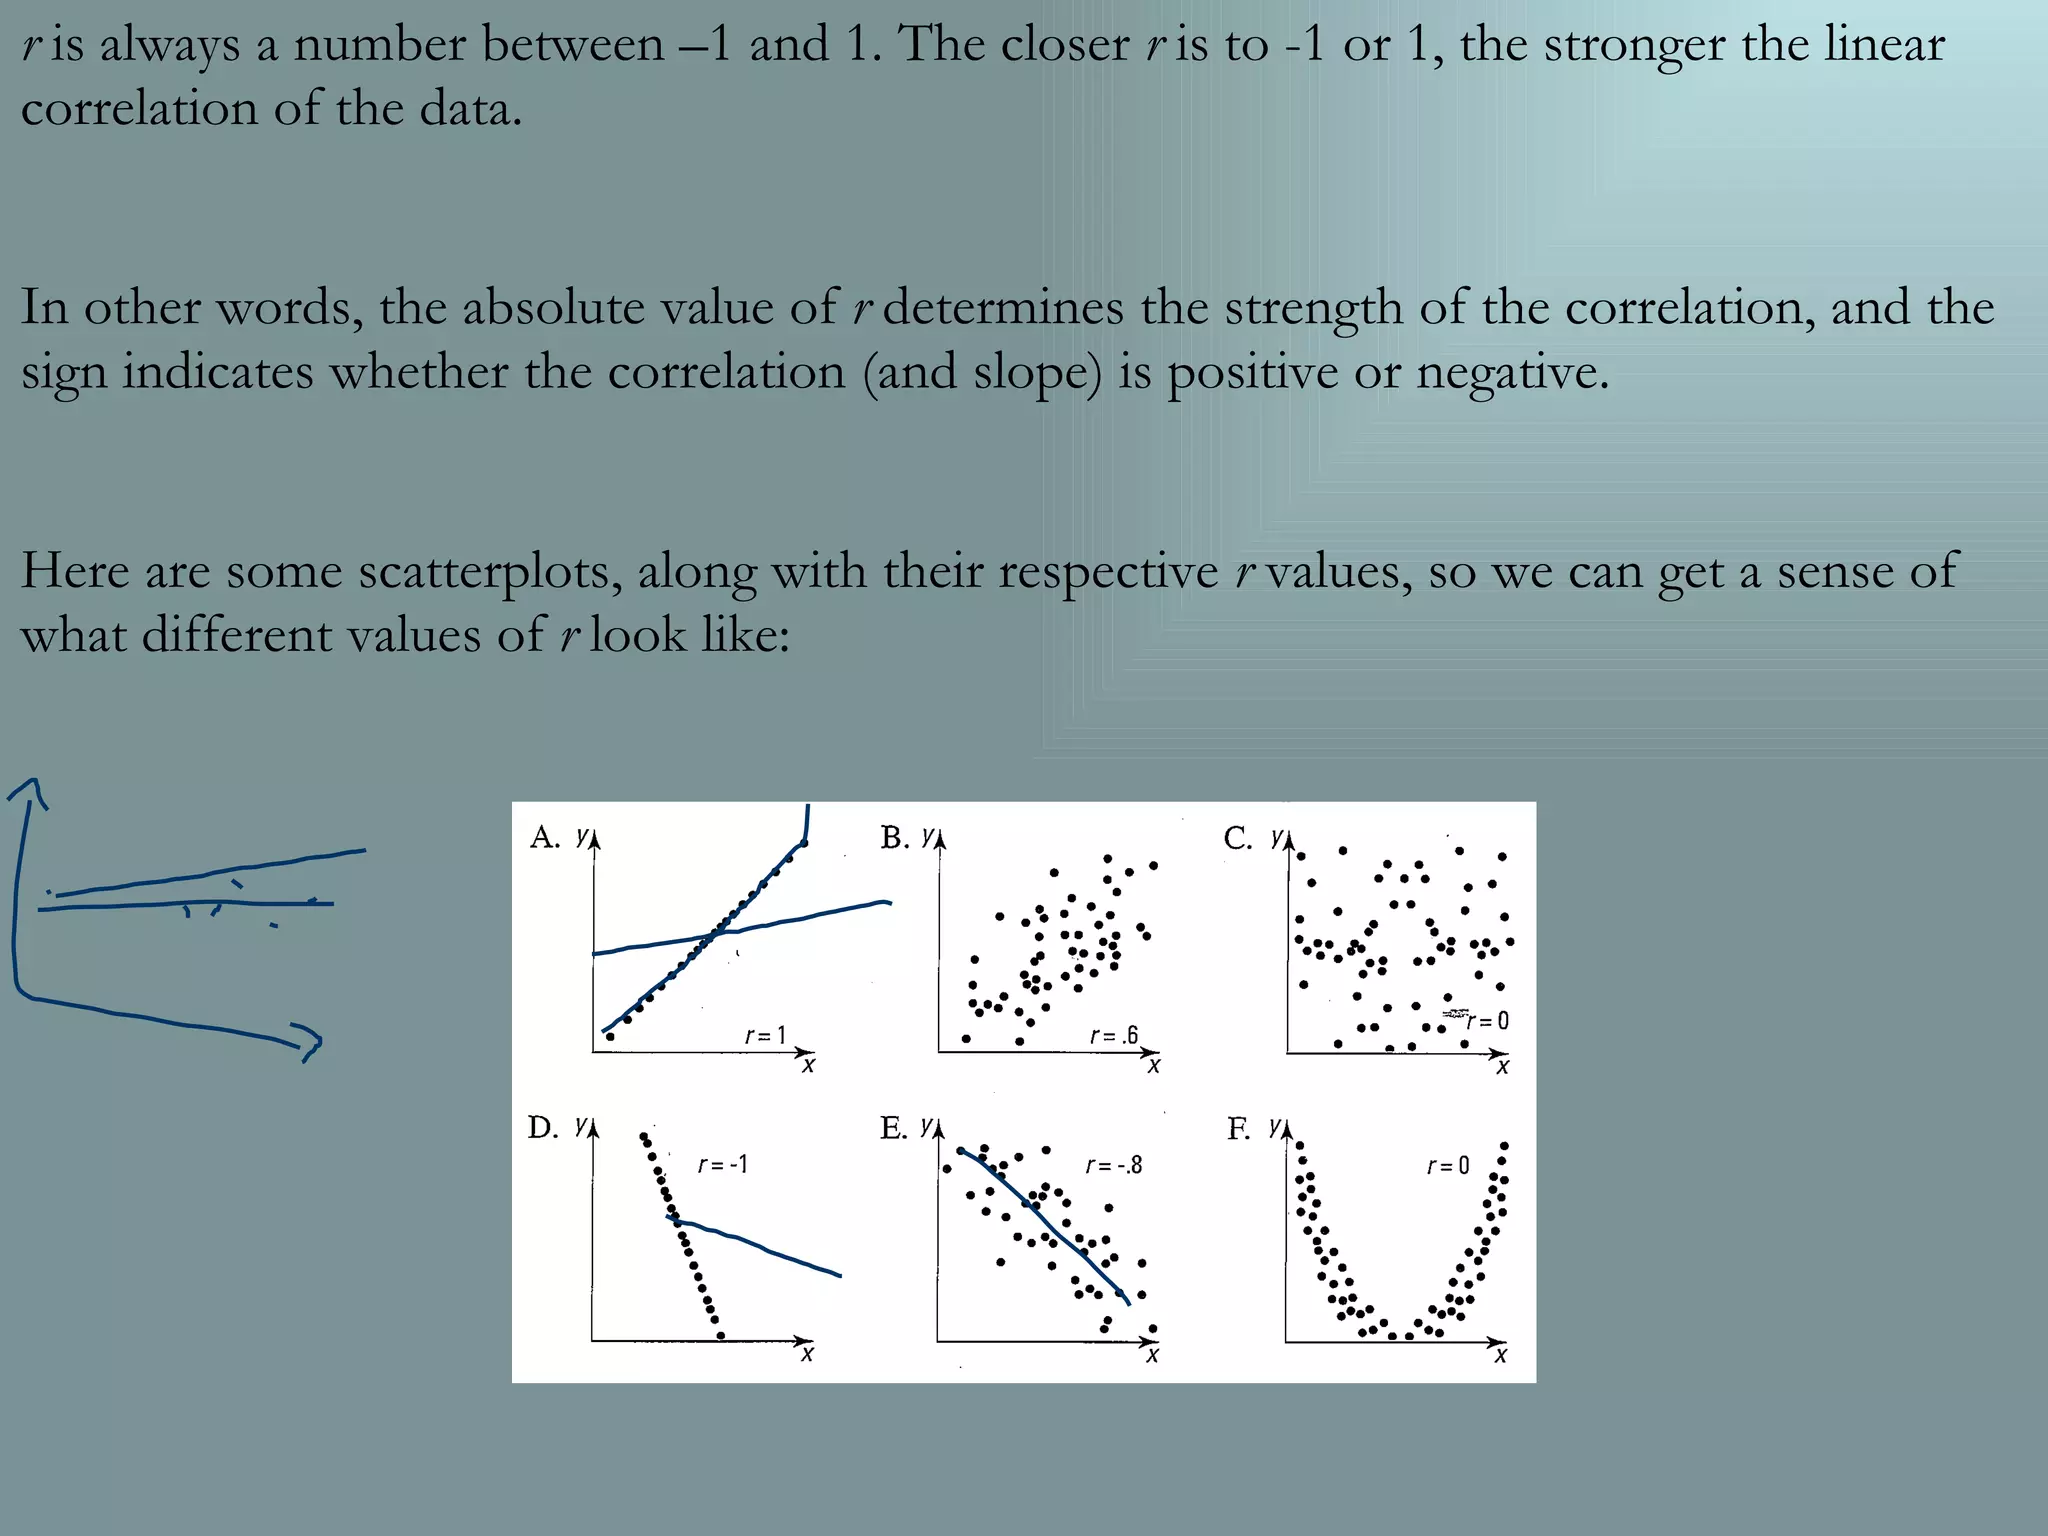
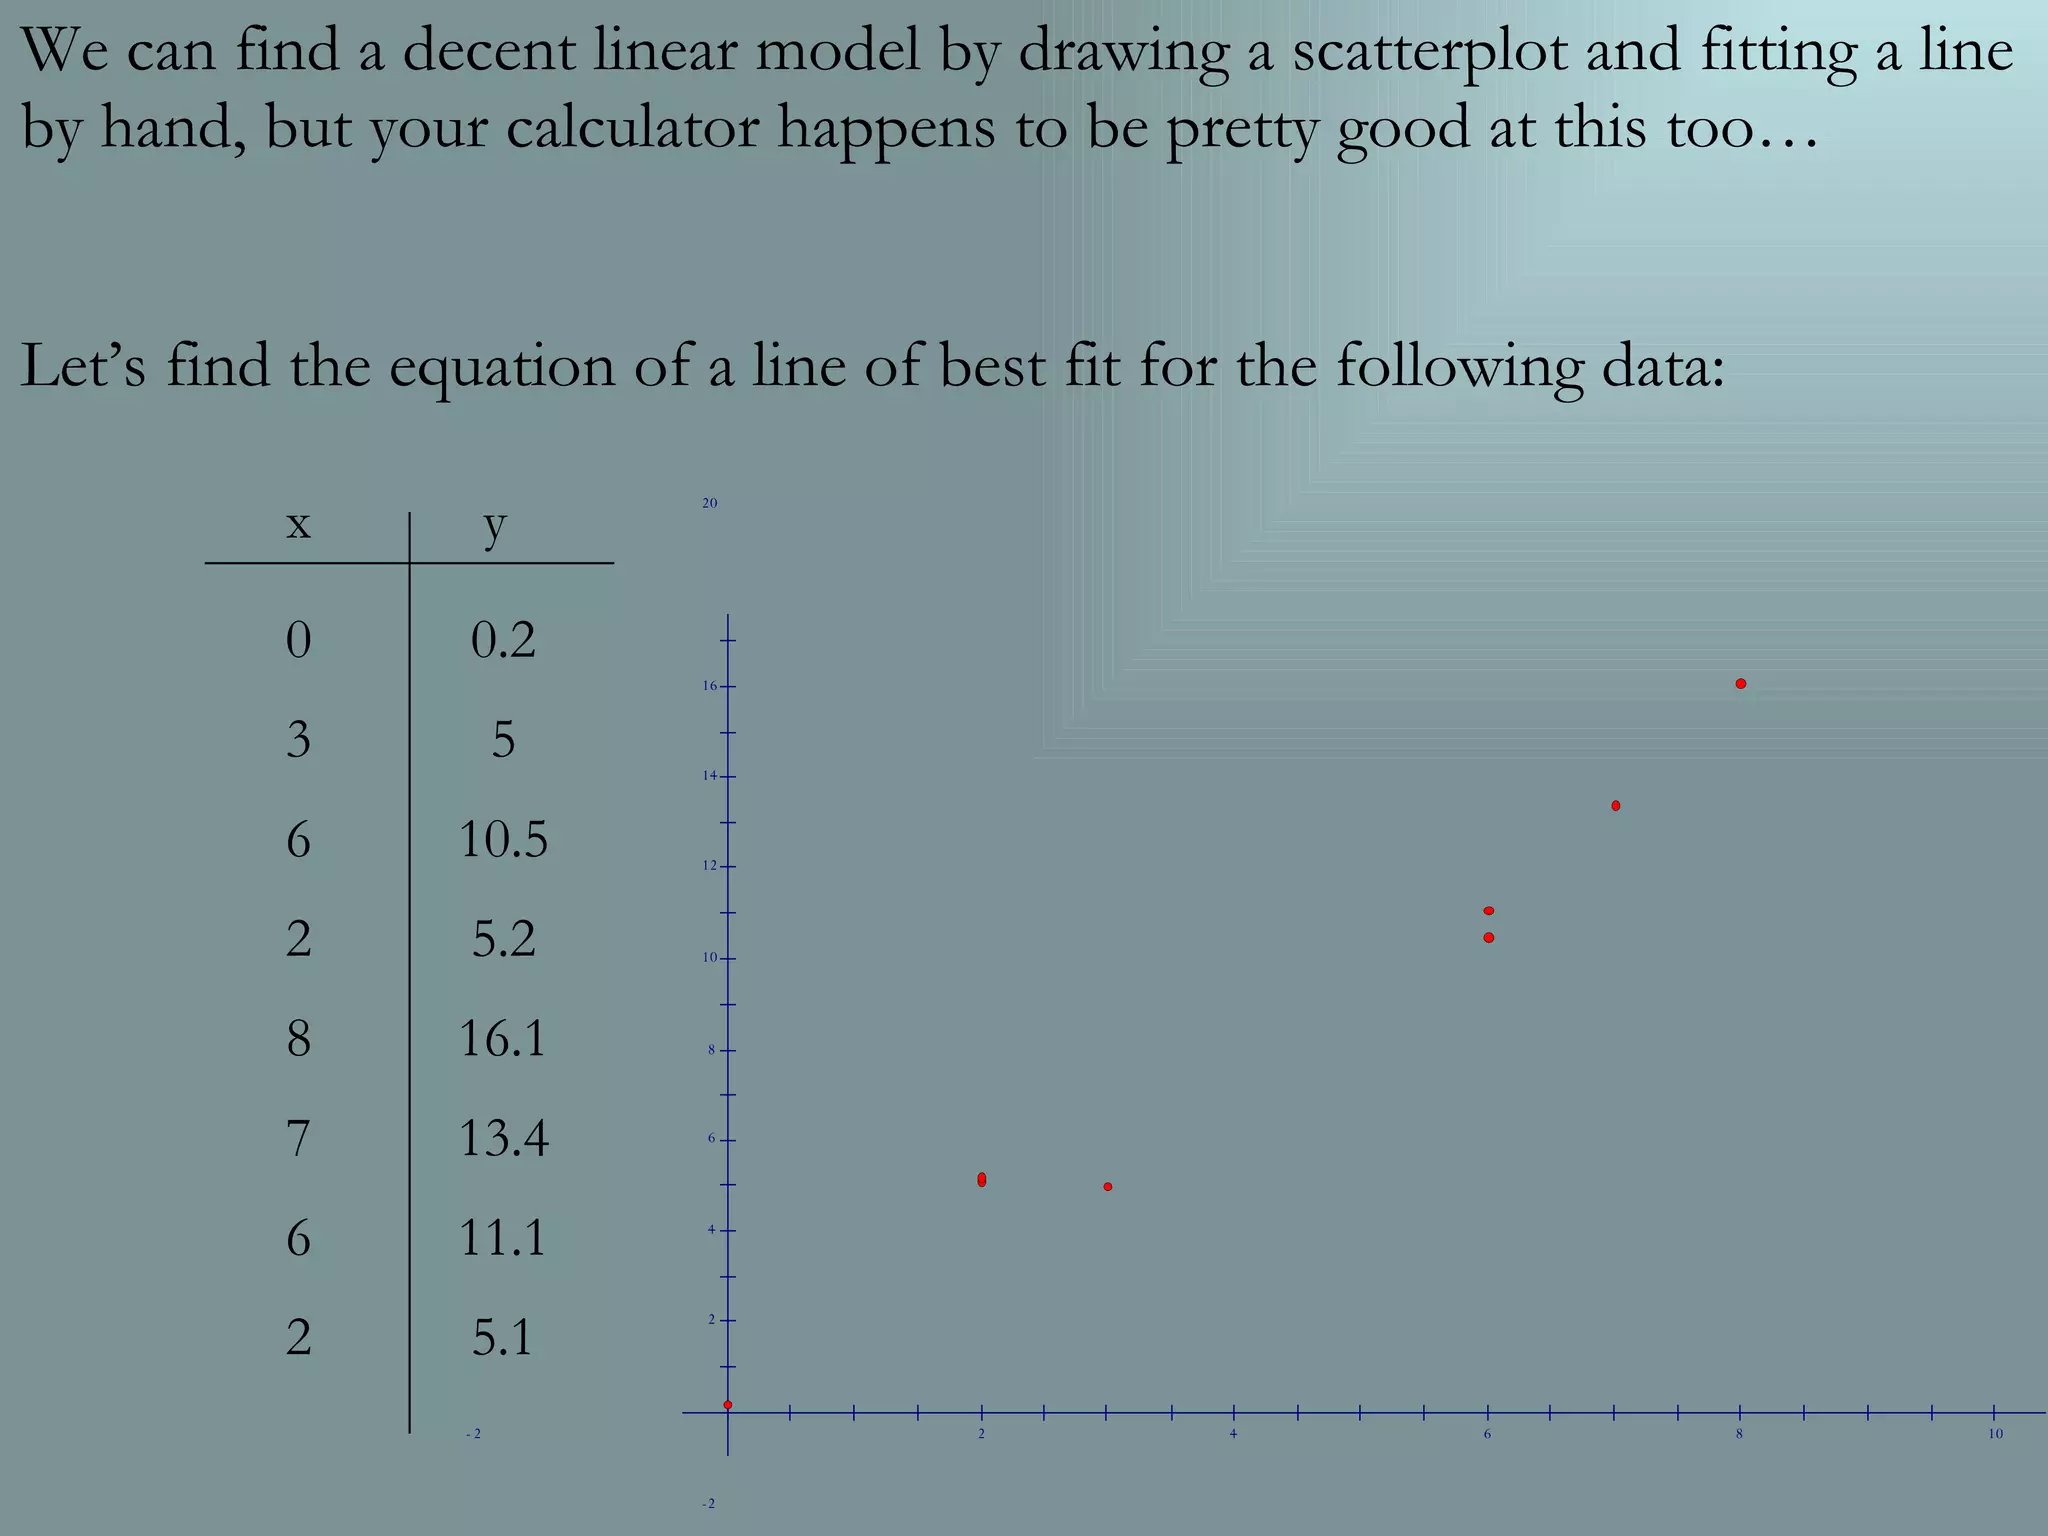
This document discusses using linear models to summarize relationships in data. It provides examples of how astronomers use a linear model called Hubble's Constant to describe the relationship between galaxies' distances and velocities. It introduces the correlation coefficient r as a measure of how closely data points fit a linear model or line of best fit, with r values closer to 1 or -1 indicating a stronger linear correlation. Some scatter plots with r values are shown to illustrate what different r values look like. The document explains the formula for calculating r and encourages interpreting what the various parts of the formula represent. It then poses fitting a line of best fit to a set of sample x and y data values as an example.


![Aids[2][1]](https://cdn.slidesharecdn.com/ss_thumbnails/aids21-1202499411496274-3-thumbnail.jpg?width=640&height=640&fit=bounds)