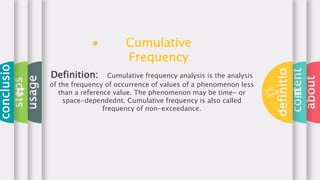
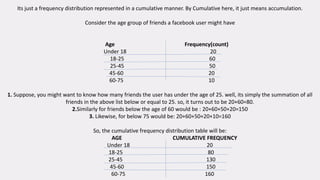
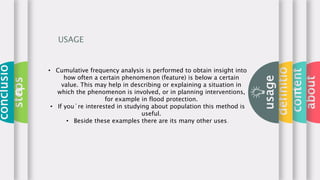
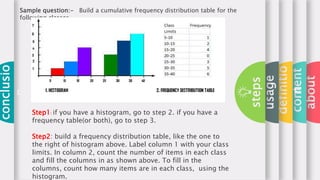
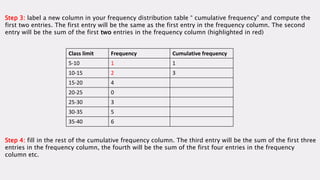
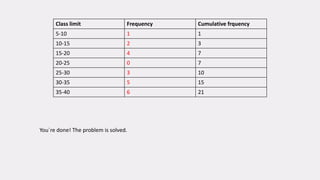
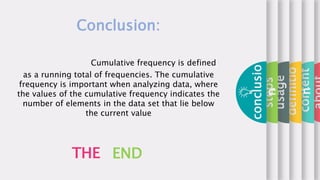
WELCOM
E
about
content
definitio
n
usage
steps
conclusi
on
about
content
definitio
n
usage
steps
conclusio
n
Faculty of Education University of Sindh
Elsa Qazi Campus
Name: Maie Jeewan (B.Ed 2.5 morning)
Roll # 30
Topic: Cumulative Frequency
Assigned by: Dr Amjad Ali Arain
about
content
definition
usage
steps
conclusio
n
CONTENT
1. What is cumulative frequency distribution?
2. What is it used for?
3. How to make a cumulative frequency in easy steps?
about
content
definitio
n
usage
steps
conclusio
n
Definition: Cumulative frequency analysis is the analysis
of the frequency of occurrence of values of a phenomenon less
than a reference value. The phenomenon may be time- or
space-dependednt. Cumulative frequency is also called
frequency of non-exceedance.
Cumulative
Frequency
Its just a frequency distribution represented in a cumulative manner. By Cumulative here, it just means accumulation.
Consider the age group of friends a facebook user might have
Age Frequency(count)
Under 18 20
18-25 60
25-45 50
45-60 20
60-75 10
1. Suppose, you might want to know how many friends the user has under the age of 25. well, its simply the summation of all
friends in the above list below or equal to 25. so, it turns out to be 20+60=80.
2.Similarly for friends below the age of 60 would be : 20+60+50+20=150
3. Likewise, for below 75 would be: 20+60+50+20+10=160
So, the cumulative frequency distribution table will be:
AGE CUMULATIVE FREQUENCY
Under 18 20
18-25 80
25-45 130
45-60 150
60-75 160
about
content
definitio
n
usage
steps
conclusio
n
USAGE
• Cumulative frequency analysis is performed to obtain insight into
how often a certain phenomenon (feature) is below a certain
value. This may help in describing or explaining a situation in
which the phenomenon is involved, or in planning interventions,
for example in flood protection.
• If you´re interested in studying about population this method is
useful.
• Beside these examples there are its many other uses.
about
content
definitio
n
usage
steps
conclusio
n
Sample question:- Build a cumulative frequency distribution table for the
following classes.
Step1: if you have a histogram, go to step 2. if you have a
frequency table(or both), go to step 3.
Step2: build a frequency distribution table, like the one to
the right of histogram above. Label column 1 with your class
limits. In column 2, count the number of items in each class
and fill the columns in as shown above. To fill in the
columns, count how many items are in each class, using the
histogram.
Step 3: label a new column in your frequency distribution table “ cumulative frequency” and compute the
first two entries. The first entry will be the same as the first entry in the frequency column. The second
entry will be the sum of the first two entries in the frequency column (highlighted in red)
Step 4: fill in the rest of the cumulative frequency column. The third entry will be the sum of the first three
entries in the frequency column, the fourth will be the sum of the first four entries in the frequency
column etc.
Class limit Frequency Cumulative frequency
5-10 1 1
10-15 2 3
15-20 4
20-25 0
25-30 3
30-35 5
35-40 6
Class limit Frequency Cumulative frquency
5-10 1 1
10-15 2 3
15-20 4 7
20-25 0 7
25-30 3 10
30-35 5 15
35-40 6 21
You´re done! The problem is solved.
content
definitio
n
usage
steps
conclusio
n
THE END
Conclusion:
Cumulative frequency is defined
as a running total of frequencies. The cumulative
frequency is important when analyzing data, where
the values of the cumulative frequency indicates the
number of elements in the data set that lie below
the current value

Cumulative Frequency

  • 1.
  • 2.
    about content definitio n usage steps conclusio n Faculty of EducationUniversity of Sindh Elsa Qazi Campus Name: Maie Jeewan (B.Ed 2.5 morning) Roll # 30 Topic: Cumulative Frequency Assigned by: Dr Amjad Ali Arain
  • 3.
    about content definition usage steps conclusio n CONTENT 1. What iscumulative frequency distribution? 2. What is it used for? 3. How to make a cumulative frequency in easy steps?
  • 4.
    about content definitio n usage steps conclusio n Definition: Cumulative frequencyanalysis is the analysis of the frequency of occurrence of values of a phenomenon less than a reference value. The phenomenon may be time- or space-dependednt. Cumulative frequency is also called frequency of non-exceedance. Cumulative Frequency
  • 5.
    Its just afrequency distribution represented in a cumulative manner. By Cumulative here, it just means accumulation. Consider the age group of friends a facebook user might have Age Frequency(count) Under 18 20 18-25 60 25-45 50 45-60 20 60-75 10 1. Suppose, you might want to know how many friends the user has under the age of 25. well, its simply the summation of all friends in the above list below or equal to 25. so, it turns out to be 20+60=80. 2.Similarly for friends below the age of 60 would be : 20+60+50+20=150 3. Likewise, for below 75 would be: 20+60+50+20+10=160 So, the cumulative frequency distribution table will be: AGE CUMULATIVE FREQUENCY Under 18 20 18-25 80 25-45 130 45-60 150 60-75 160
  • 6.
    about content definitio n usage steps conclusio n USAGE • Cumulative frequencyanalysis is performed to obtain insight into how often a certain phenomenon (feature) is below a certain value. This may help in describing or explaining a situation in which the phenomenon is involved, or in planning interventions, for example in flood protection. • If you´re interested in studying about population this method is useful. • Beside these examples there are its many other uses.
  • 7.
    about content definitio n usage steps conclusio n Sample question:- Builda cumulative frequency distribution table for the following classes. Step1: if you have a histogram, go to step 2. if you have a frequency table(or both), go to step 3. Step2: build a frequency distribution table, like the one to the right of histogram above. Label column 1 with your class limits. In column 2, count the number of items in each class and fill the columns in as shown above. To fill in the columns, count how many items are in each class, using the histogram.
  • 8.
    Step 3: labela new column in your frequency distribution table “ cumulative frequency” and compute the first two entries. The first entry will be the same as the first entry in the frequency column. The second entry will be the sum of the first two entries in the frequency column (highlighted in red) Step 4: fill in the rest of the cumulative frequency column. The third entry will be the sum of the first three entries in the frequency column, the fourth will be the sum of the first four entries in the frequency column etc. Class limit Frequency Cumulative frequency 5-10 1 1 10-15 2 3 15-20 4 20-25 0 25-30 3 30-35 5 35-40 6
  • 9.
    Class limit FrequencyCumulative frquency 5-10 1 1 10-15 2 3 15-20 4 7 20-25 0 7 25-30 3 10 30-35 5 15 35-40 6 21 You´re done! The problem is solved.
  • 10.
    content definitio n usage steps conclusio n THE END Conclusion: Cumulative frequencyis defined as a running total of frequencies. The cumulative frequency is important when analyzing data, where the values of the cumulative frequency indicates the number of elements in the data set that lie below the current value