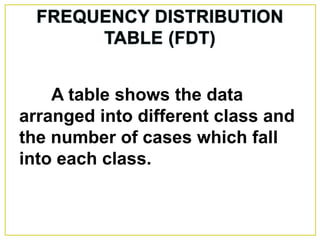
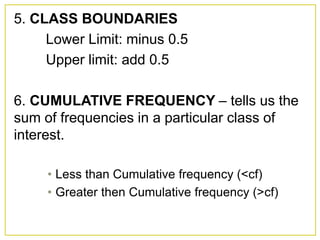
Tabular Presentation
Graphical Data
Numerical Techniques describing
Data
It is a table which sorts data
according to a certain pattern.
It involves separating a number
into two parts.
48 35 26 18 10
46 33 24 16
44 30 22 14
41 28 22 12
STEM LEAVES
4 8 6 4 1
3 5 3 0
2 8 6 4 2 2
1 8 6 4 2 0
A table shows the data
arranged into different class and
the number of cases which fall
into each class.
1. CLASSES/SCORES
2. CLASS INTERVAL
# Classes = 𝒏 + 𝟏
C =
𝒓𝒂𝒏𝒈𝒆
# 𝒐𝒇 𝑪𝒍𝒂𝒔𝒔𝒆𝒔
Range = Highest Score – Lowest Score
48 35 26 18 10
46 33 24 16
44 30 22 14
41 28 22 12
CLASSE
S
10-17
18-25
26-33
34-41
42-49
3. FREQUENCY – tells us the number of
observations in each class.
4. CLASS MARK/ CLASS MIDPOINT (cm)
cm =
𝒍𝒐𝒘𝒆𝒓 𝒍𝒊𝒎𝒊𝒕+𝒖𝒑𝒑𝒆𝒓 𝒍𝒊𝒎𝒊𝒕
𝟐
CLASSE
S
10-17
18-25
26-33
34-41
42-49
UPPERLIMIT
LOWERLIMIT
CLASSES TALLY f cm
10-17 llll 4 13.5
18-25 llll 4 21.5
26-33 llll 4 29.5
34-41 ll 2 37.5
42-49 lll 3 45.5
N = 17
5. CLASS BOUNDARIES
Lower Limit: minus 0.5
Upper limit: add 0.5
6. CUMULATIVE FREQUENCY – tells us the
sum of frequencies in a particular class of
interest.
• Less than Cumulative frequency (<cf)
• Greater then Cumulative frequency (>cf)
N = 17
CLASS
ES
f cm cb <cf >cf
10-17 4 13.5 9.5-17.5 4 17
18-25 4 21.5 17.5-25.5 8 13
26-33 4 29.5 25.5-33.5 12 9
34-41 2 37.5 33.5-41.5 14 5
42-49 3 45.5 41.5-49.5 17 3
7. RELATIVE FREQUENCY (rf) –
gives us the percentage of
observations in a particular class of
interest.
rf =
𝒇𝒓𝒆𝒒𝒖𝒆𝒏𝒄𝒚
𝒏𝒖𝒎𝒃𝒆𝒓 𝒐𝒇 𝒐𝒃𝒔𝒆𝒓𝒗𝒂𝒕𝒊𝒐𝒏
CLASSE
S f cm cb <cf >cf rf
10-17 4 13.5 9.5-17.5 4 17 23.5
18-25 4 21.5
17.5-
25.5
8 13 23.5
26-33 4 29.5
25.5-
33.5
12 9 23.5
34-41 2 37.5
33.5-
41.5
14 5 11.8
42-49 3 45.5
41.5-
49.5
17 3 17.7
N = 17 100%
A type of graph where the classes
are labeled along the horizontal line
while the class frequencies are
long the vertical line.
Similar to histogram. Only that is
instead of the height of rectangles
depicting the frequencies of the
classes, we will be using points or
coordinates, which is the intersection of
the frequency and class midpoint of a
class.
Presentation of data

Presentation of data

  • 1.
  • 3.
    It is atable which sorts data according to a certain pattern. It involves separating a number into two parts.
  • 4.
    48 35 2618 10 46 33 24 16 44 30 22 14 41 28 22 12
  • 5.
    STEM LEAVES 4 86 4 1 3 5 3 0 2 8 6 4 2 2 1 8 6 4 2 0
  • 6.
    A table showsthe data arranged into different class and the number of cases which fall into each class.
  • 7.
    1. CLASSES/SCORES 2. CLASSINTERVAL # Classes = 𝒏 + 𝟏 C = 𝒓𝒂𝒏𝒈𝒆 # 𝒐𝒇 𝑪𝒍𝒂𝒔𝒔𝒆𝒔 Range = Highest Score – Lowest Score
  • 8.
    48 35 2618 10 46 33 24 16 44 30 22 14 41 28 22 12
  • 9.
  • 10.
    3. FREQUENCY –tells us the number of observations in each class. 4. CLASS MARK/ CLASS MIDPOINT (cm) cm = 𝒍𝒐𝒘𝒆𝒓 𝒍𝒊𝒎𝒊𝒕+𝒖𝒑𝒑𝒆𝒓 𝒍𝒊𝒎𝒊𝒕 𝟐
  • 11.
  • 12.
    CLASSES TALLY fcm 10-17 llll 4 13.5 18-25 llll 4 21.5 26-33 llll 4 29.5 34-41 ll 2 37.5 42-49 lll 3 45.5 N = 17
  • 13.
    5. CLASS BOUNDARIES LowerLimit: minus 0.5 Upper limit: add 0.5 6. CUMULATIVE FREQUENCY – tells us the sum of frequencies in a particular class of interest. • Less than Cumulative frequency (<cf) • Greater then Cumulative frequency (>cf)
  • 14.
    N = 17 CLASS ES fcm cb <cf >cf 10-17 4 13.5 9.5-17.5 4 17 18-25 4 21.5 17.5-25.5 8 13 26-33 4 29.5 25.5-33.5 12 9 34-41 2 37.5 33.5-41.5 14 5 42-49 3 45.5 41.5-49.5 17 3
  • 15.
    7. RELATIVE FREQUENCY(rf) – gives us the percentage of observations in a particular class of interest. rf = 𝒇𝒓𝒆𝒒𝒖𝒆𝒏𝒄𝒚 𝒏𝒖𝒎𝒃𝒆𝒓 𝒐𝒇 𝒐𝒃𝒔𝒆𝒓𝒗𝒂𝒕𝒊𝒐𝒏
  • 16.
    CLASSE S f cmcb <cf >cf rf 10-17 4 13.5 9.5-17.5 4 17 23.5 18-25 4 21.5 17.5- 25.5 8 13 23.5 26-33 4 29.5 25.5- 33.5 12 9 23.5 34-41 2 37.5 33.5- 41.5 14 5 11.8 42-49 3 45.5 41.5- 49.5 17 3 17.7 N = 17 100%
  • 18.
    A type ofgraph where the classes are labeled along the horizontal line while the class frequencies are long the vertical line.
  • 19.
    Similar to histogram.Only that is instead of the height of rectangles depicting the frequencies of the classes, we will be using points or coordinates, which is the intersection of the frequency and class midpoint of a class.