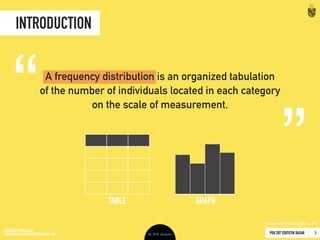
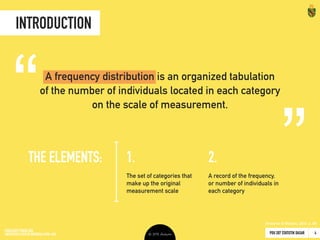
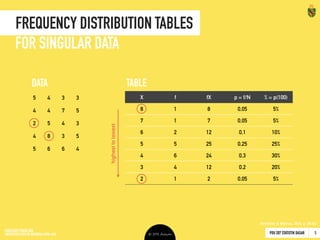
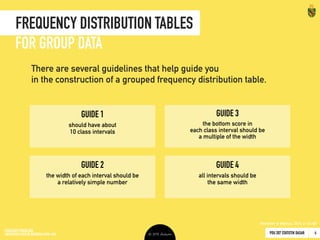
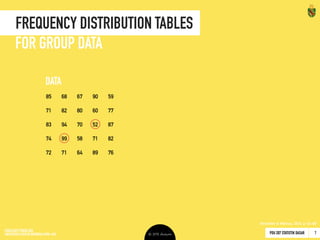
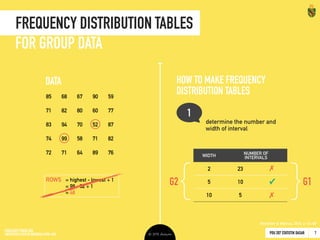
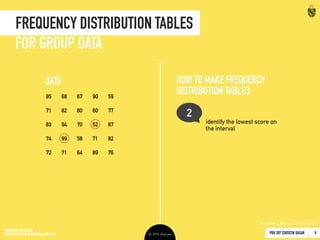
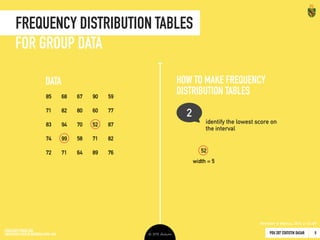
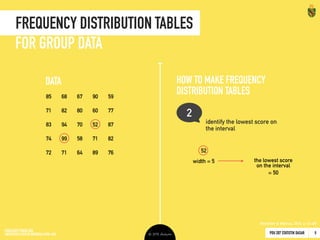
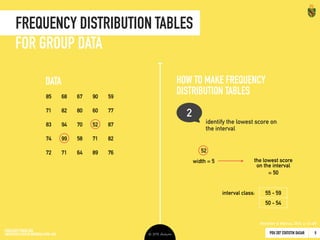
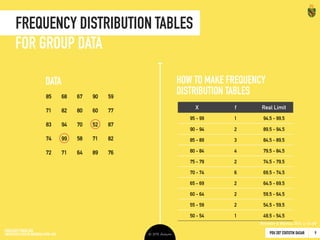
PDU 207 STATISTIK DASAR
SEKSI E
SEMESTER GASAL 2016/2017
FAKULTAS PSIKOLOGI / PROGRAM STUDI S1 PSIKOLOGI
Frequency
Distribution
KULIAH III – 22 AGUSTUS 2016
Menguasai teknik-teknik statistika deskriptif dan statistika inferensial,
secara khusus terkait dengan:
• Konsep distribusi frekuensi;
• Organisasi data ke dalam tabel dan grafik distribusi, serta data dalam tabel

dan grafik distribusi tersebut;
• Perhitungan persentil dan ranking (termasuk menggunakan interpolasi)

serta letak data pada suatu distribusi berdasarkan hasil perhitungan tersebut.
One-Day Objectives
Introduction to
Frequency Distribution
PDU 207 STATISTIK DASAR 2016 © Ardhiati
Introduction
4
A frequency distribution is an organized tabulation

of the number of individuals located in each category

on the scale of measurement.
TO FREQUENCY DISTRIBUTION
TABLE GRAPH
(Gravetter & Wallnau, 2012: 39)
PDU 207 STATISTIK DASAR 2016 © Ardhiati
Introduction
5
A frequency distribution is an organized tabulation

of the number of individuals located in each category

on the scale of measurement.
TO FREQUENCY DISTRIBUTION
The set of categories

that make up the original

measurement scale
A record of the frequency,

or number of individuals

in each category
1 2
(Gravetter & Wallnau, 2012: 39) ICON SOURCES: Link by Joris Hoogendoorn; from the Noun Project
Frequency Distribution
Tables & Graphs
PDU 207 STATISTIK DASAR 2016 © Ardhiati
Frequency Distribution
7
TABLES & GRAPHS
categorized by

the types of data
categorized by

the scale and type of data
I RON
Singular Data Group Data
ICON SOURCES: Group by christoph robausch;

from the Noun Project
Singular

Data
Group

Data
Nominal Ordinal Interval Ratio
PDU 207 STATISTIK DASAR 2016 © Ardhiati
Frequency Distribution
8
TABLES & GRAPHS
categorized by

the types of data
categorized by

the scale and type of data
I RON
Singular Data Group Data Singular

Data
Group

Data
Nominal Ordinal Interval Ratio
ICON SOURCES: Group by christoph robausch;

from the Noun Project
PDU 207 STATISTIK DASAR 2016 © Ardhiati
Frequency Distribution Tables
9
SINGULAR DATA
5 4 3 3
4 4 7 5
2 5 4 3
4 8 3 5
5 6 6 4
X f fX p = f/N % = p(100)
8 1 8 0,05 5%
7 1 7 0,05 5%
6 2 12 0,1 10%
5 5 25 0,25 25%
4 6 24 0,3 30%
3 4 12 0,2 20%
2 1 2 0,05 5%
highesttolowest
DATA TABLE
(Gravetter & Wallnau, 2012: 39-42)
PDU 207 STATISTIK DASAR 2016 © Ardhiati
Frequency Distribution Tables
10
There are several guidelines that help guide you

in the construction of a grouped frequency distribution table.
GROUP DATA
G1
G2
G3
G4
Should have about

10 class intervals
The width of each
interval should be

a relatively simple
number
The bottom score in

each class interval
should be a multiple

of the width
All intervals should be
the same width
(Gravetter & Wallnau, 2012: 42-45)
PDU 207 STATISTIK DASAR 2016 © Ardhiati
Frequency Distribution Tables
11
Steps of Creating

Frequency Distribution Tables
GROUP DATA
85 68 67 90 59
71 82 80 60 77
83 94 70 52 87
74 99 58 71 82
72 71 64 89 76
DATA
ROWS = highest - lowest + 1
= 99 - 52 + 1
= 48
Determine the number and
width of interval
1
WIDTH NUMBER OF INTERVALS
2 23
5 10
10 5
✓
✗
✗
{ G1G2
}
(Gravetter & Wallnau, 2012: 42-45)
PDU 207 STATISTIK DASAR 2016 © Ardhiati
Frequency Distribution Tables
12
Steps of Creating

Frequency Distribution Tables
GROUP DATA
85 68 67 90 59
71 82 80 60 77
83 94 70 52 87
74 99 58 71 82
72 71 64 89 76
DATA
Identify the lowest score

on the interval
2
width = 5
52
the lowest score

on the interval
= 50
G3
55 - 59
50 - 54
interval class:
G4}
(Gravetter & Wallnau, 2012: 42-45)
PDU 207 STATISTIK DASAR 2016 © Ardhiati
Frequency Distribution Tables
13
Steps of Creating

Frequency Distribution Tables
GROUP DATA
85 68 67 90 59
71 82 80 60 77
83 94 70 52 87
74 99 58 71 82
72 71 64 89 76
DATA
X f Real Limit
95 - 99 1 94,5 - 99,5
90 - 94 2 89,5 - 94,5
85 - 89 3 84,5 - 89,5
80 - 84 4 79,5 - 84,5
75 - 79 2 74,5 - 79,5
70 - 74 6 69,5 - 74,5
65 - 69 2 64,5 - 69,5
60 - 64 2 59,5 - 64,5
55 - 59 2 54,5 - 59,5
50 - 54 1 49,5 - 54,5
(Gravetter & Wallnau, 2012: 42-45)
PDU 207 STATISTIK DASAR 2016 © Ardhiati
Frequency Distribution Graphs
14
TYPES
I RON
Nominal Ordinal Interval Ratio
Singular

Data
Group

Data
ICON SOURCES: Group by christoph robausch;

from the Noun Project
Bar Chart Histogram Polygon
PDU 207 STATISTIK DASAR 2016 © Ardhiati
Frequency Distribution Graphs
15
TYPES
I RON
Nominal Ordinal Interval Ratio
Bar Chart Histogram Polygon
Singular

Data
Group

Data
ICON SOURCES: Group by christoph robausch;

from the Noun Project
PDU 207 STATISTIK DASAR 2016 © Ardhiati
Frequency Distribution Graphs
16
TYPES
I RON
Nominal Ordinal Interval Ratio
Bar Chart Histogram Polygon
Singular

Data
Group

Data
ICON SOURCES: Group by christoph robausch;

from the Noun Project
PDU 207 STATISTIK DASAR 2016 © Ardhiati
Frequency Distribution Graphs
17
TYPES
I RON
Nominal Ordinal Interval Ratio
Bar Chart Histogram Polygon
Singular

Data
Group

Data
ICON SOURCES: Group by christoph robausch;

from the Noun Project
PDU 207 STATISTIK DASAR 2016 © Ardhiati
Frequency Distribution Graphs
18
INTERVAL & RATIO × SINGULAR DATA
Tahun f
8 19
7 12
6 24
5 55
4 69
3 40
2 11
0
10
20
30
40
50
60
70
1 2 3 4 5 6 7 8
Tahun
Frekuensi
Durasi Mengikuti

Kursus Bahasa Jepang
real
limits
frequency
HISTOGRAM
PDU 207 STATISTIK DASAR 2016 © Ardhiati
Frequency Distribution Graphs
19
INTERVAL & RATIO × SINGULAR DATA
Tahun f
8 19
7 12
6 24
5 55
4 69
3 40
2 11
0
10
20
30
40
50
60
70
1 2 3 4 5 6 7 8 9
Tahun
Frekuensi
Durasi Mengikuti

Kursus Bahasa Jepang
POLYGON
PDU 207 STATISTIK DASAR 2016 © Ardhiati
Frequency Distribution Graphs
20
INTERVAL & RATIO × GROUP DATA
Nilai f
95 - 99 11
90 - 94 24
85 - 89 38
80 - 84 40
75 - 79 25
70 - 74 68
65 - 69 20
60 - 64 23
55 - 59 28
50 - 54 10
Nilai
Frekuensi
Nilai Kuis I

Statistik Dasar
HISTOGRAM
0
10
20
30
40
50
60
70
50-54 55-59 60-64 65-69 70-74 75-79 80-84 85-89 90-94 95-99
PDU 207 STATISTIK DASAR 2016 © Ardhiati
Frequency Distribution Graphs
21
INTERVAL & RATIO × GROUP DATA
Nilai f
95 - 99 11
90 - 94 24
85 - 89 38
80 - 84 40
75 - 79 25
70 - 74 68
65 - 69 20
60 - 64 23
55 - 59 28
50 - 54 10
Nilai
Frekuensi
Nilai Kuis I

Statistik Dasar
POLYGON
0
10
20
30
40
50
60
70
50 55 60 65 70 75 80 85 90 95 100
PDU 207 STATISTIK DASAR 2016 © Ardhiati
Frequency Distribution Graphs
22
ORDINAL & NOMINAL × SINGULAR DATA
Angkatan f
2016 278
2015 264
2014 255
2013 213
2012 199
2011 42
2010 4
0
50
100
150
200
250
300
2016 2015 2014 2013 2012 2011 2010
Angkatan
Frekuensi
Mahasiswa Aktif

FP Universitas Anu
BAR CHART
PDU 207 STATISTIK DASAR 2016 © Ardhiati
Frequency Distribution
23
THE SHAPE
Unimodal
Bimodal
Positive

Skew
Negative

Skew
(Gravetter & Wallnau, 2012: 50-52)
Percentiles,

Percentile Ranks, &
Interpolation
PDU 207 STATISTIK DASAR 2016 © Ardhiati
Percentiles & Percentile Ranks
25
Although the primary purpose of a frequency distribution

is to provide a description of an entire set of scores,

it also can be used to describe the position

of an individual within the set.
THE DEFINITION
The rank or percentile rank of a particular score

is defined as the percentage of individuals

in the distribution with scores equal to

or less than the particular value.
When a score is identified by its percentile rank,

the score is called a percentile.
PR P
(Gravetter & Wallnau, 2012: 53)
PDU 207 STATISTIK DASAR 2016 © Ardhiati
Percentiles & Percentile Ranks
26
• Berapa persen individu yang telah
mengikuti kursus Bahasa Jepang
selama 5 tahun atau kurang?
PR5 = 76%
• Dibandingkan dengan teman-teman
yang sama-sama mengikuti kursus
Bahasa Jepang, durasi Tika mengikuti
kursus tersebut berada pada
persentil ke-22.
Berapa lama Tika sudah mengikuti
kursus Bahasa Jepang?
P22 = 3,5 tahun
THE DEFINITION
Tahun f cf c%
8 19
7 12
6 24
5 55
4 69
3 40
2 11
Durasi Mengikuti

Kursus Bahasa Jepang
230
211
199
175
120
51
11
100%
92%
87%
76%
52%
22%
5%
PERCENTILE RANK
PERCENTILE
PDU 207 STATISTIK DASAR 2016 © Ardhiati
Percentiles & Percentile Ranks
27
• Christin sudah mengikuti kursus
Bahasa Jepang selama tepat 4 tahun.
Dibandingkan dengan teman-teman
yang sama-sama mengikuti kursus
Bahasa Jelang, Christin berapa pada
persentil rank berapa?
Each cumulative percentage
in the table is associated
with the upper real limit of
its score interval.
WITH INTERPOLATION FOR SINGULAR DATA
Tahun f cf c%
8 19
7 12
6 24
5 55
4 69
3 40
2 11
Durasi Mengikuti

Kursus Bahasa Jepang
230
211
199
175
120
51
11
100%
92%
87%
76%
52%
22%
5%
PERCENTILE RANK
PR4 = ?% 37%
4,5
3,5
52%
22%
PDU 207 STATISTIK DASAR 2016 © Ardhiati
Percentiles & Percentile Ranks
28
• Tika mendapat nilai 71 pada kuis I
Statistik Dasar. Nilai tersebut berada
pada persentil rank ke-berapa?
PR71 = 37,6%
• Dibandingkan dengan teman-teman
peserta kuliah Statistik Dasar, nilai
kuis I Christin berada pada persentil
ke-90.
Berapa nilai Christin untuk kuis I
Statistik Dasar?
P90 = 91,25
WITH INTERPOLATION FOR GROUP DATA
Tahun f cf c%
95 - 99 11 287 100%
90 - 94 24 276 96%
85 - 89 38 252 88%
80 - 84 40 214 75%
75 - 79 25 174 61%
70 - 74 68 149 52%
65 - 69 20 81 28%
60 - 64 23 61 21%
55 - 59 28 38 13%
50 - 54 10 10 3%
Nilai Kuis I

Statistik Dasar
PERCENTILE RANK
PERCENTILE
74,5
69,5
52%
28%
94,5
89,5
96%
88%
PDU 207 STATISTIK DASAR 2016 © Ardhiati 29
WANT TO KNOW MORE?
Gravetter, F.J. & Wallnau, L.B. (2012).

Statistics for the behavioral sciences (9th ed.).

Australia: WADSWORTH CENGAGE Learning.

PDU 207 Basic Statistics: Frequency Distribution

  • 1.
    PDU 207 STATISTIKDASAR SEKSI E SEMESTER GASAL 2016/2017 FAKULTAS PSIKOLOGI / PROGRAM STUDI S1 PSIKOLOGI Frequency Distribution KULIAH III – 22 AGUSTUS 2016
  • 2.
    Menguasai teknik-teknik statistikadeskriptif dan statistika inferensial, secara khusus terkait dengan: • Konsep distribusi frekuensi; • Organisasi data ke dalam tabel dan grafik distribusi, serta data dalam tabel
 dan grafik distribusi tersebut; • Perhitungan persentil dan ranking (termasuk menggunakan interpolasi)
 serta letak data pada suatu distribusi berdasarkan hasil perhitungan tersebut. One-Day Objectives
  • 3.
  • 4.
    PDU 207 STATISTIKDASAR 2016 © Ardhiati Introduction 4 A frequency distribution is an organized tabulation
 of the number of individuals located in each category
 on the scale of measurement. TO FREQUENCY DISTRIBUTION TABLE GRAPH (Gravetter & Wallnau, 2012: 39)
  • 5.
    PDU 207 STATISTIKDASAR 2016 © Ardhiati Introduction 5 A frequency distribution is an organized tabulation
 of the number of individuals located in each category
 on the scale of measurement. TO FREQUENCY DISTRIBUTION The set of categories
 that make up the original
 measurement scale A record of the frequency,
 or number of individuals
 in each category 1 2 (Gravetter & Wallnau, 2012: 39) ICON SOURCES: Link by Joris Hoogendoorn; from the Noun Project
  • 6.
  • 7.
    PDU 207 STATISTIKDASAR 2016 © Ardhiati Frequency Distribution 7 TABLES & GRAPHS categorized by
 the types of data categorized by
 the scale and type of data I RON Singular Data Group Data ICON SOURCES: Group by christoph robausch;
 from the Noun Project Singular
 Data Group
 Data Nominal Ordinal Interval Ratio
  • 8.
    PDU 207 STATISTIKDASAR 2016 © Ardhiati Frequency Distribution 8 TABLES & GRAPHS categorized by
 the types of data categorized by
 the scale and type of data I RON Singular Data Group Data Singular
 Data Group
 Data Nominal Ordinal Interval Ratio ICON SOURCES: Group by christoph robausch;
 from the Noun Project
  • 9.
    PDU 207 STATISTIKDASAR 2016 © Ardhiati Frequency Distribution Tables 9 SINGULAR DATA 5 4 3 3 4 4 7 5 2 5 4 3 4 8 3 5 5 6 6 4 X f fX p = f/N % = p(100) 8 1 8 0,05 5% 7 1 7 0,05 5% 6 2 12 0,1 10% 5 5 25 0,25 25% 4 6 24 0,3 30% 3 4 12 0,2 20% 2 1 2 0,05 5% highesttolowest DATA TABLE (Gravetter & Wallnau, 2012: 39-42)
  • 10.
    PDU 207 STATISTIKDASAR 2016 © Ardhiati Frequency Distribution Tables 10 There are several guidelines that help guide you
 in the construction of a grouped frequency distribution table. GROUP DATA G1 G2 G3 G4 Should have about
 10 class intervals The width of each interval should be
 a relatively simple number The bottom score in
 each class interval should be a multiple
 of the width All intervals should be the same width (Gravetter & Wallnau, 2012: 42-45)
  • 11.
    PDU 207 STATISTIKDASAR 2016 © Ardhiati Frequency Distribution Tables 11 Steps of Creating
 Frequency Distribution Tables GROUP DATA 85 68 67 90 59 71 82 80 60 77 83 94 70 52 87 74 99 58 71 82 72 71 64 89 76 DATA ROWS = highest - lowest + 1 = 99 - 52 + 1 = 48 Determine the number and width of interval 1 WIDTH NUMBER OF INTERVALS 2 23 5 10 10 5 ✓ ✗ ✗ { G1G2 } (Gravetter & Wallnau, 2012: 42-45)
  • 12.
    PDU 207 STATISTIKDASAR 2016 © Ardhiati Frequency Distribution Tables 12 Steps of Creating
 Frequency Distribution Tables GROUP DATA 85 68 67 90 59 71 82 80 60 77 83 94 70 52 87 74 99 58 71 82 72 71 64 89 76 DATA Identify the lowest score
 on the interval 2 width = 5 52 the lowest score
 on the interval = 50 G3 55 - 59 50 - 54 interval class: G4} (Gravetter & Wallnau, 2012: 42-45)
  • 13.
    PDU 207 STATISTIKDASAR 2016 © Ardhiati Frequency Distribution Tables 13 Steps of Creating
 Frequency Distribution Tables GROUP DATA 85 68 67 90 59 71 82 80 60 77 83 94 70 52 87 74 99 58 71 82 72 71 64 89 76 DATA X f Real Limit 95 - 99 1 94,5 - 99,5 90 - 94 2 89,5 - 94,5 85 - 89 3 84,5 - 89,5 80 - 84 4 79,5 - 84,5 75 - 79 2 74,5 - 79,5 70 - 74 6 69,5 - 74,5 65 - 69 2 64,5 - 69,5 60 - 64 2 59,5 - 64,5 55 - 59 2 54,5 - 59,5 50 - 54 1 49,5 - 54,5 (Gravetter & Wallnau, 2012: 42-45)
  • 14.
    PDU 207 STATISTIKDASAR 2016 © Ardhiati Frequency Distribution Graphs 14 TYPES I RON Nominal Ordinal Interval Ratio Singular
 Data Group
 Data ICON SOURCES: Group by christoph robausch;
 from the Noun Project Bar Chart Histogram Polygon
  • 15.
    PDU 207 STATISTIKDASAR 2016 © Ardhiati Frequency Distribution Graphs 15 TYPES I RON Nominal Ordinal Interval Ratio Bar Chart Histogram Polygon Singular
 Data Group
 Data ICON SOURCES: Group by christoph robausch;
 from the Noun Project
  • 16.
    PDU 207 STATISTIKDASAR 2016 © Ardhiati Frequency Distribution Graphs 16 TYPES I RON Nominal Ordinal Interval Ratio Bar Chart Histogram Polygon Singular
 Data Group
 Data ICON SOURCES: Group by christoph robausch;
 from the Noun Project
  • 17.
    PDU 207 STATISTIKDASAR 2016 © Ardhiati Frequency Distribution Graphs 17 TYPES I RON Nominal Ordinal Interval Ratio Bar Chart Histogram Polygon Singular
 Data Group
 Data ICON SOURCES: Group by christoph robausch;
 from the Noun Project
  • 18.
    PDU 207 STATISTIKDASAR 2016 © Ardhiati Frequency Distribution Graphs 18 INTERVAL & RATIO × SINGULAR DATA Tahun f 8 19 7 12 6 24 5 55 4 69 3 40 2 11 0 10 20 30 40 50 60 70 1 2 3 4 5 6 7 8 Tahun Frekuensi Durasi Mengikuti
 Kursus Bahasa Jepang real limits frequency HISTOGRAM
  • 19.
    PDU 207 STATISTIKDASAR 2016 © Ardhiati Frequency Distribution Graphs 19 INTERVAL & RATIO × SINGULAR DATA Tahun f 8 19 7 12 6 24 5 55 4 69 3 40 2 11 0 10 20 30 40 50 60 70 1 2 3 4 5 6 7 8 9 Tahun Frekuensi Durasi Mengikuti
 Kursus Bahasa Jepang POLYGON
  • 20.
    PDU 207 STATISTIKDASAR 2016 © Ardhiati Frequency Distribution Graphs 20 INTERVAL & RATIO × GROUP DATA Nilai f 95 - 99 11 90 - 94 24 85 - 89 38 80 - 84 40 75 - 79 25 70 - 74 68 65 - 69 20 60 - 64 23 55 - 59 28 50 - 54 10 Nilai Frekuensi Nilai Kuis I
 Statistik Dasar HISTOGRAM 0 10 20 30 40 50 60 70 50-54 55-59 60-64 65-69 70-74 75-79 80-84 85-89 90-94 95-99
  • 21.
    PDU 207 STATISTIKDASAR 2016 © Ardhiati Frequency Distribution Graphs 21 INTERVAL & RATIO × GROUP DATA Nilai f 95 - 99 11 90 - 94 24 85 - 89 38 80 - 84 40 75 - 79 25 70 - 74 68 65 - 69 20 60 - 64 23 55 - 59 28 50 - 54 10 Nilai Frekuensi Nilai Kuis I
 Statistik Dasar POLYGON 0 10 20 30 40 50 60 70 50 55 60 65 70 75 80 85 90 95 100
  • 22.
    PDU 207 STATISTIKDASAR 2016 © Ardhiati Frequency Distribution Graphs 22 ORDINAL & NOMINAL × SINGULAR DATA Angkatan f 2016 278 2015 264 2014 255 2013 213 2012 199 2011 42 2010 4 0 50 100 150 200 250 300 2016 2015 2014 2013 2012 2011 2010 Angkatan Frekuensi Mahasiswa Aktif
 FP Universitas Anu BAR CHART
  • 23.
    PDU 207 STATISTIKDASAR 2016 © Ardhiati Frequency Distribution 23 THE SHAPE Unimodal Bimodal Positive
 Skew Negative
 Skew (Gravetter & Wallnau, 2012: 50-52)
  • 24.
  • 25.
    PDU 207 STATISTIKDASAR 2016 © Ardhiati Percentiles & Percentile Ranks 25 Although the primary purpose of a frequency distribution
 is to provide a description of an entire set of scores,
 it also can be used to describe the position
 of an individual within the set. THE DEFINITION The rank or percentile rank of a particular score
 is defined as the percentage of individuals
 in the distribution with scores equal to
 or less than the particular value. When a score is identified by its percentile rank,
 the score is called a percentile. PR P (Gravetter & Wallnau, 2012: 53)
  • 26.
    PDU 207 STATISTIKDASAR 2016 © Ardhiati Percentiles & Percentile Ranks 26 • Berapa persen individu yang telah mengikuti kursus Bahasa Jepang selama 5 tahun atau kurang? PR5 = 76% • Dibandingkan dengan teman-teman yang sama-sama mengikuti kursus Bahasa Jepang, durasi Tika mengikuti kursus tersebut berada pada persentil ke-22. Berapa lama Tika sudah mengikuti kursus Bahasa Jepang? P22 = 3,5 tahun THE DEFINITION Tahun f cf c% 8 19 7 12 6 24 5 55 4 69 3 40 2 11 Durasi Mengikuti
 Kursus Bahasa Jepang 230 211 199 175 120 51 11 100% 92% 87% 76% 52% 22% 5% PERCENTILE RANK PERCENTILE
  • 27.
    PDU 207 STATISTIKDASAR 2016 © Ardhiati Percentiles & Percentile Ranks 27 • Christin sudah mengikuti kursus Bahasa Jepang selama tepat 4 tahun. Dibandingkan dengan teman-teman yang sama-sama mengikuti kursus Bahasa Jelang, Christin berapa pada persentil rank berapa? Each cumulative percentage in the table is associated with the upper real limit of its score interval. WITH INTERPOLATION FOR SINGULAR DATA Tahun f cf c% 8 19 7 12 6 24 5 55 4 69 3 40 2 11 Durasi Mengikuti
 Kursus Bahasa Jepang 230 211 199 175 120 51 11 100% 92% 87% 76% 52% 22% 5% PERCENTILE RANK PR4 = ?% 37% 4,5 3,5 52% 22%
  • 28.
    PDU 207 STATISTIKDASAR 2016 © Ardhiati Percentiles & Percentile Ranks 28 • Tika mendapat nilai 71 pada kuis I Statistik Dasar. Nilai tersebut berada pada persentil rank ke-berapa? PR71 = 37,6% • Dibandingkan dengan teman-teman peserta kuliah Statistik Dasar, nilai kuis I Christin berada pada persentil ke-90. Berapa nilai Christin untuk kuis I Statistik Dasar? P90 = 91,25 WITH INTERPOLATION FOR GROUP DATA Tahun f cf c% 95 - 99 11 287 100% 90 - 94 24 276 96% 85 - 89 38 252 88% 80 - 84 40 214 75% 75 - 79 25 174 61% 70 - 74 68 149 52% 65 - 69 20 81 28% 60 - 64 23 61 21% 55 - 59 28 38 13% 50 - 54 10 10 3% Nilai Kuis I
 Statistik Dasar PERCENTILE RANK PERCENTILE 74,5 69,5 52% 28% 94,5 89,5 96% 88%
  • 29.
    PDU 207 STATISTIKDASAR 2016 © Ardhiati 29 WANT TO KNOW MORE? Gravetter, F.J. & Wallnau, L.B. (2012).
 Statistics for the behavioral sciences (9th ed.).
 Australia: WADSWORTH CENGAGE Learning.