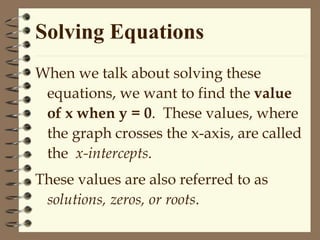
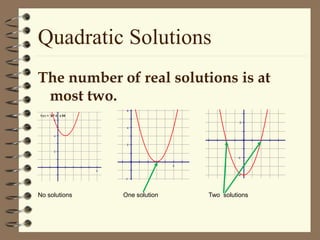
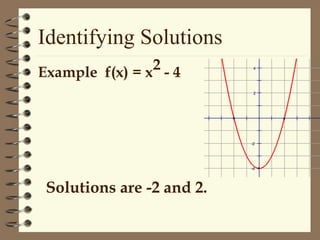
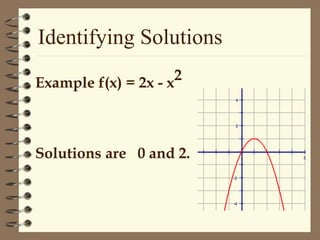
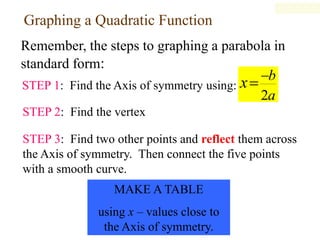
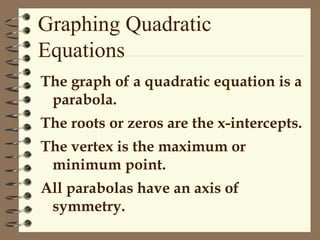
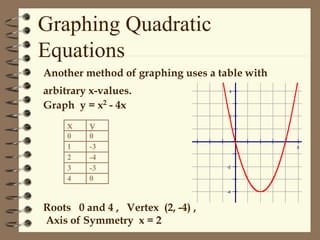
This document discusses solving quadratic equations by graphing. It defines the terms of a quadratic equation and explains that the solutions are the x-intercepts where the graph crosses the x-axis. A quadratic equation will have 0, 1, or 2 real solutions. The graph of a quadratic equation is a parabola with an axis of symmetry. The vertex is the maximum or minimum point, and it can be found using the formula. Graphing involves finding the axis of symmetry, vertex, and using a table to plot additional points to draw the smooth curve.