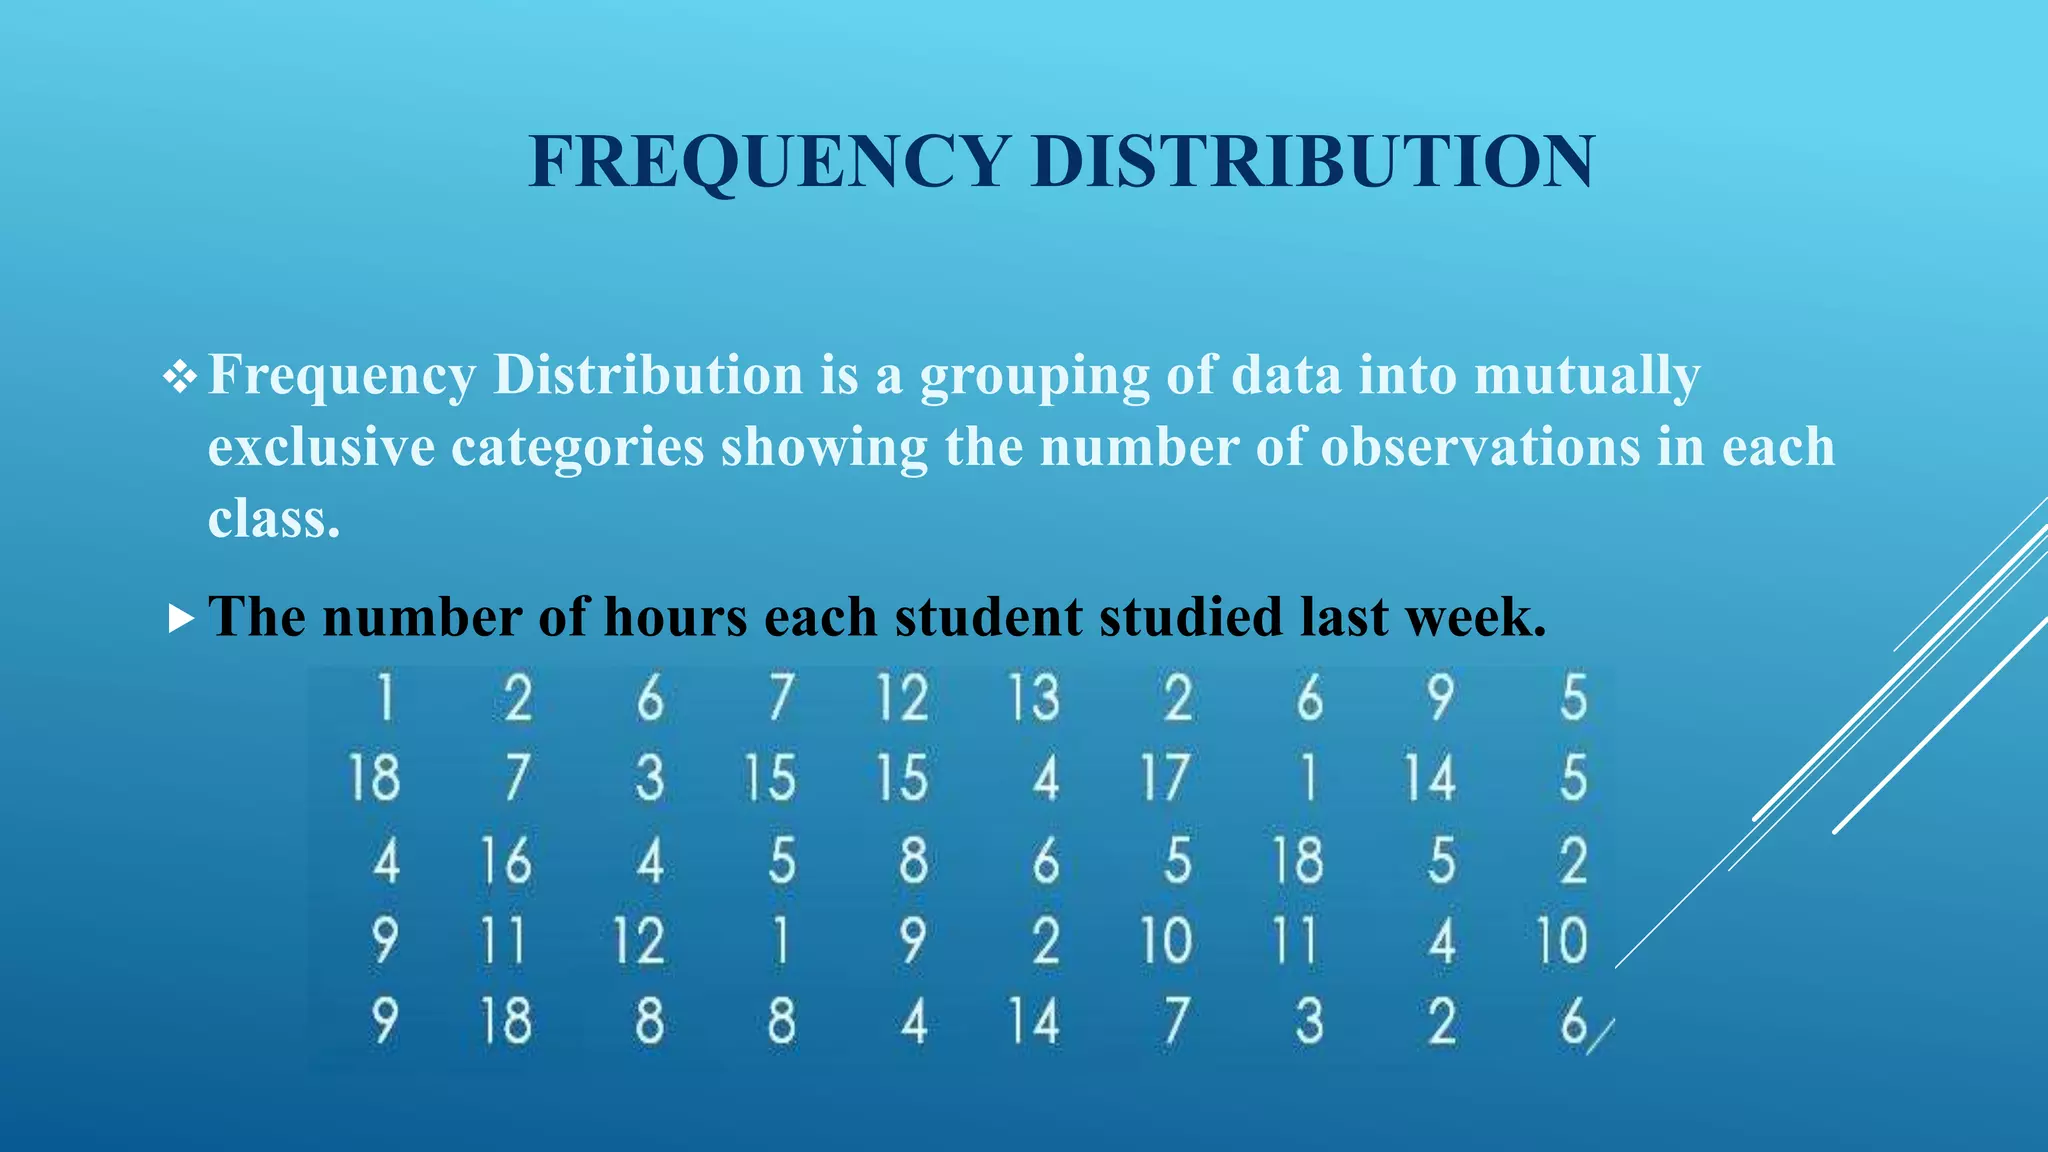
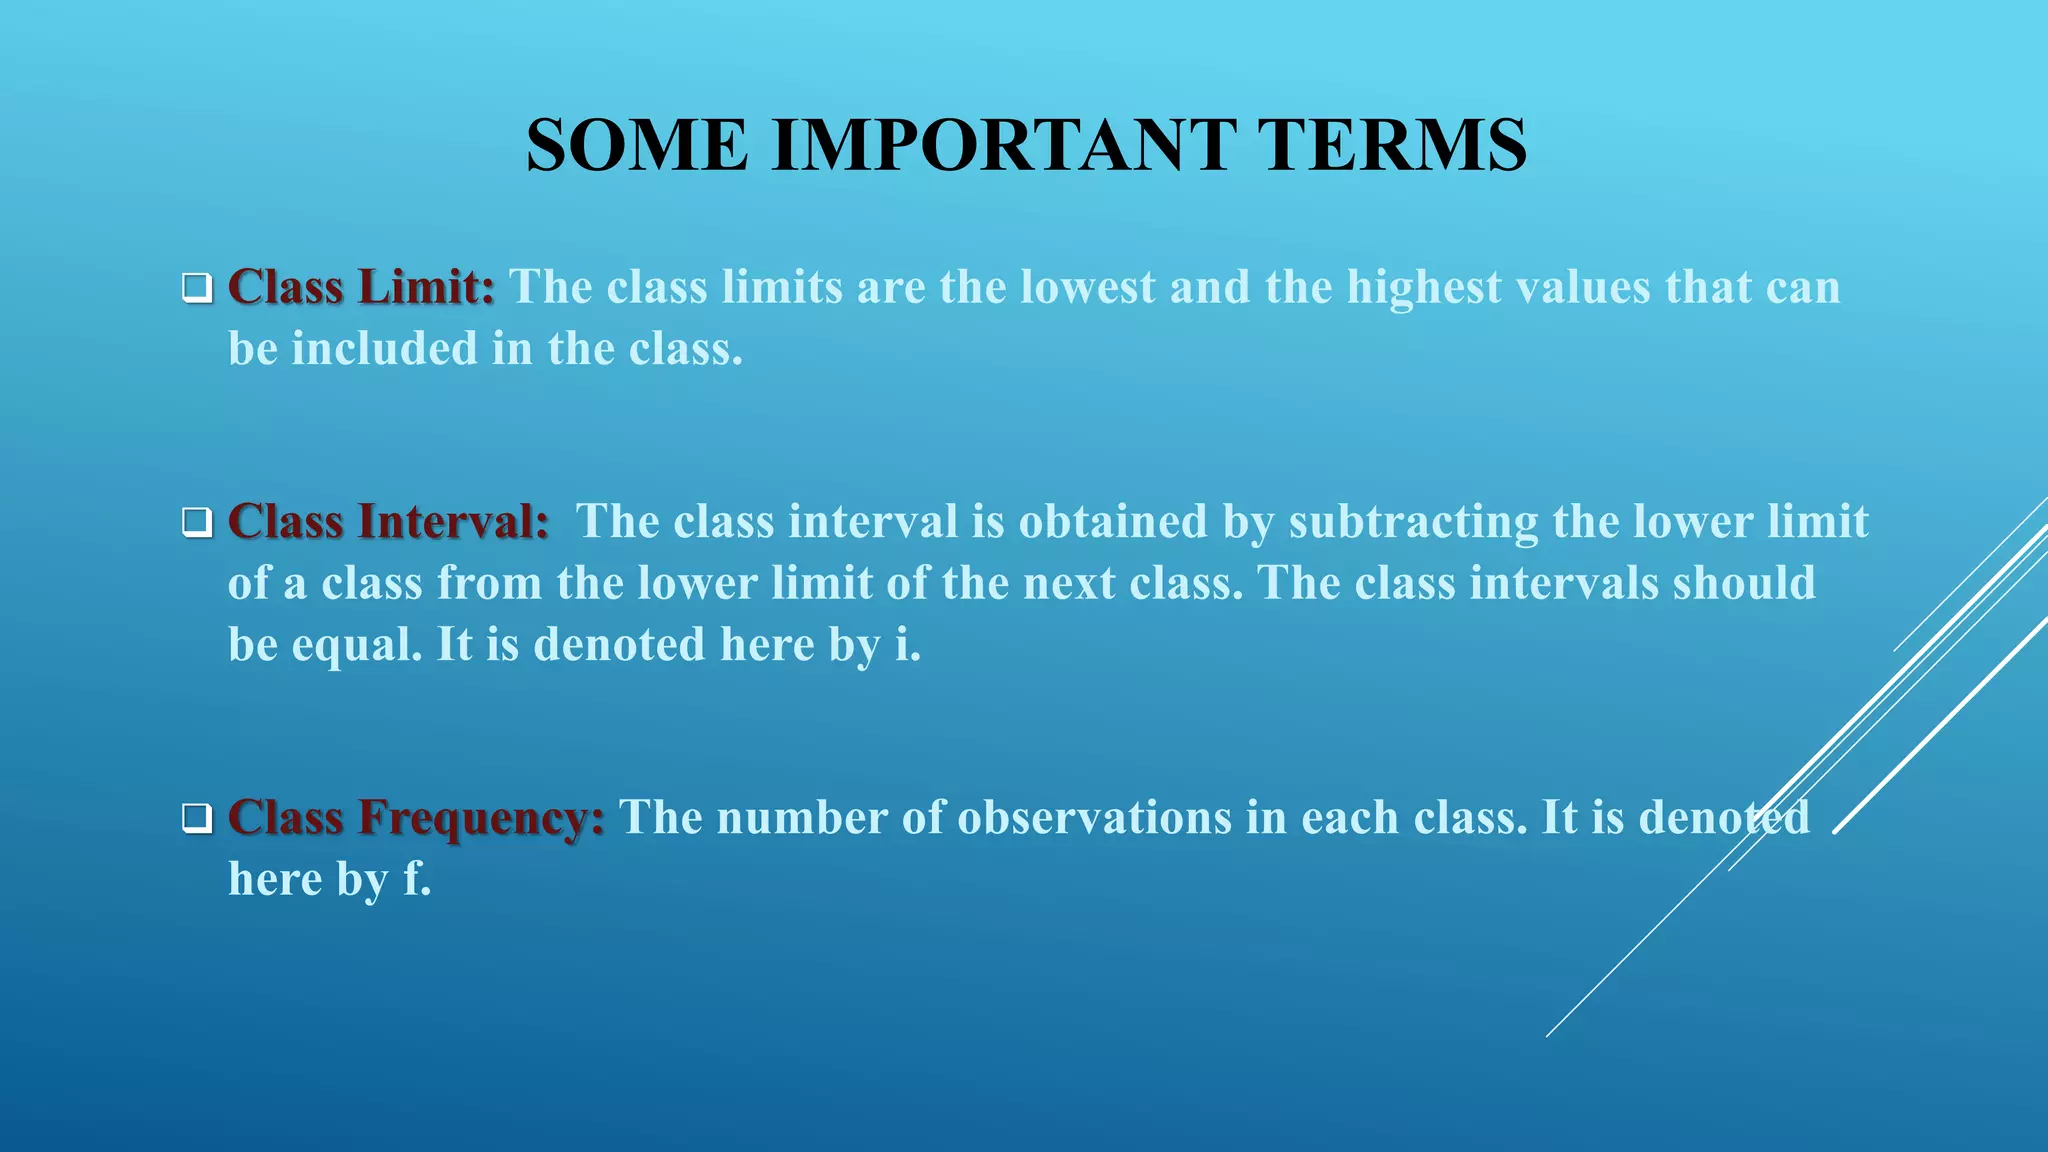
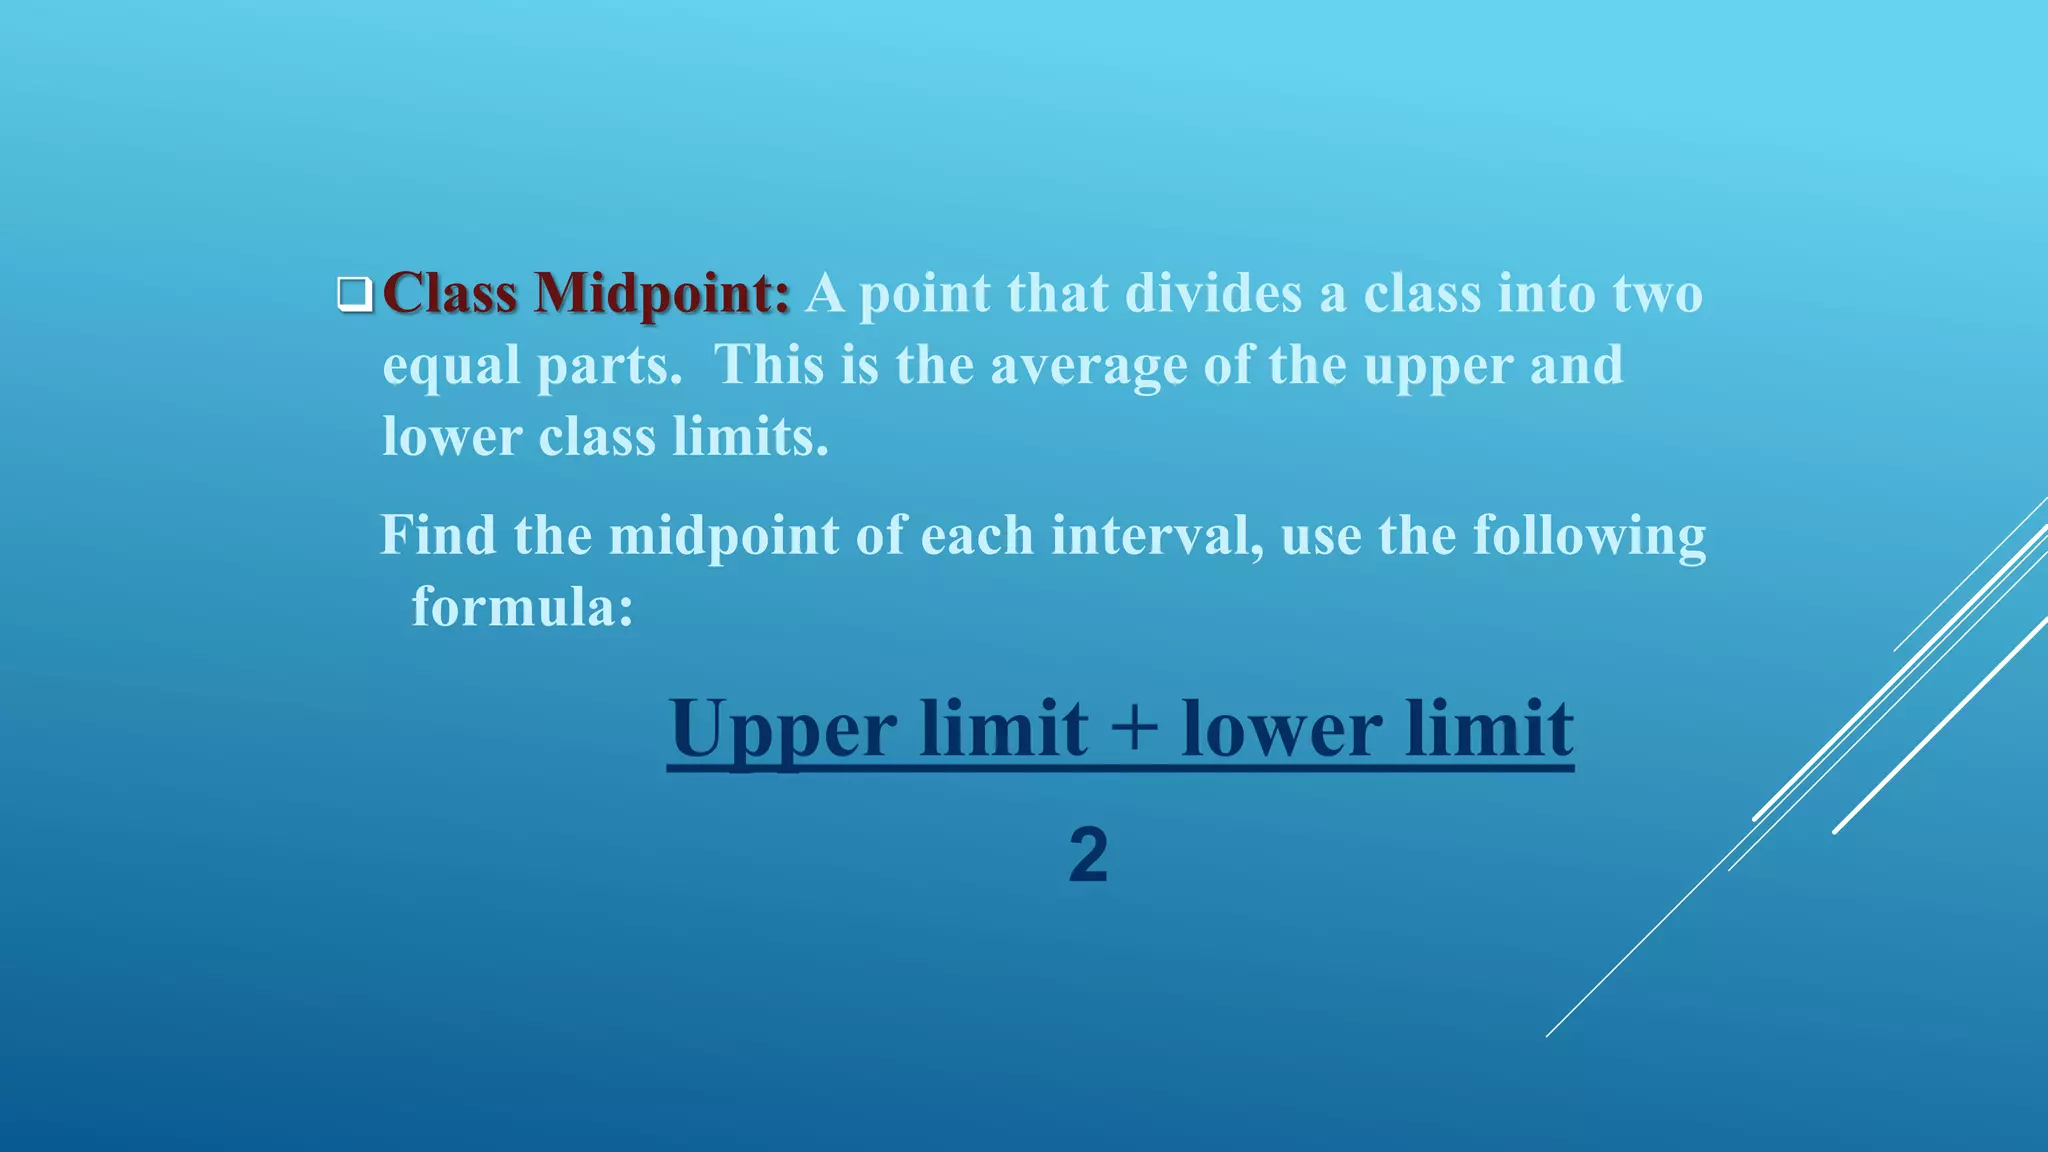
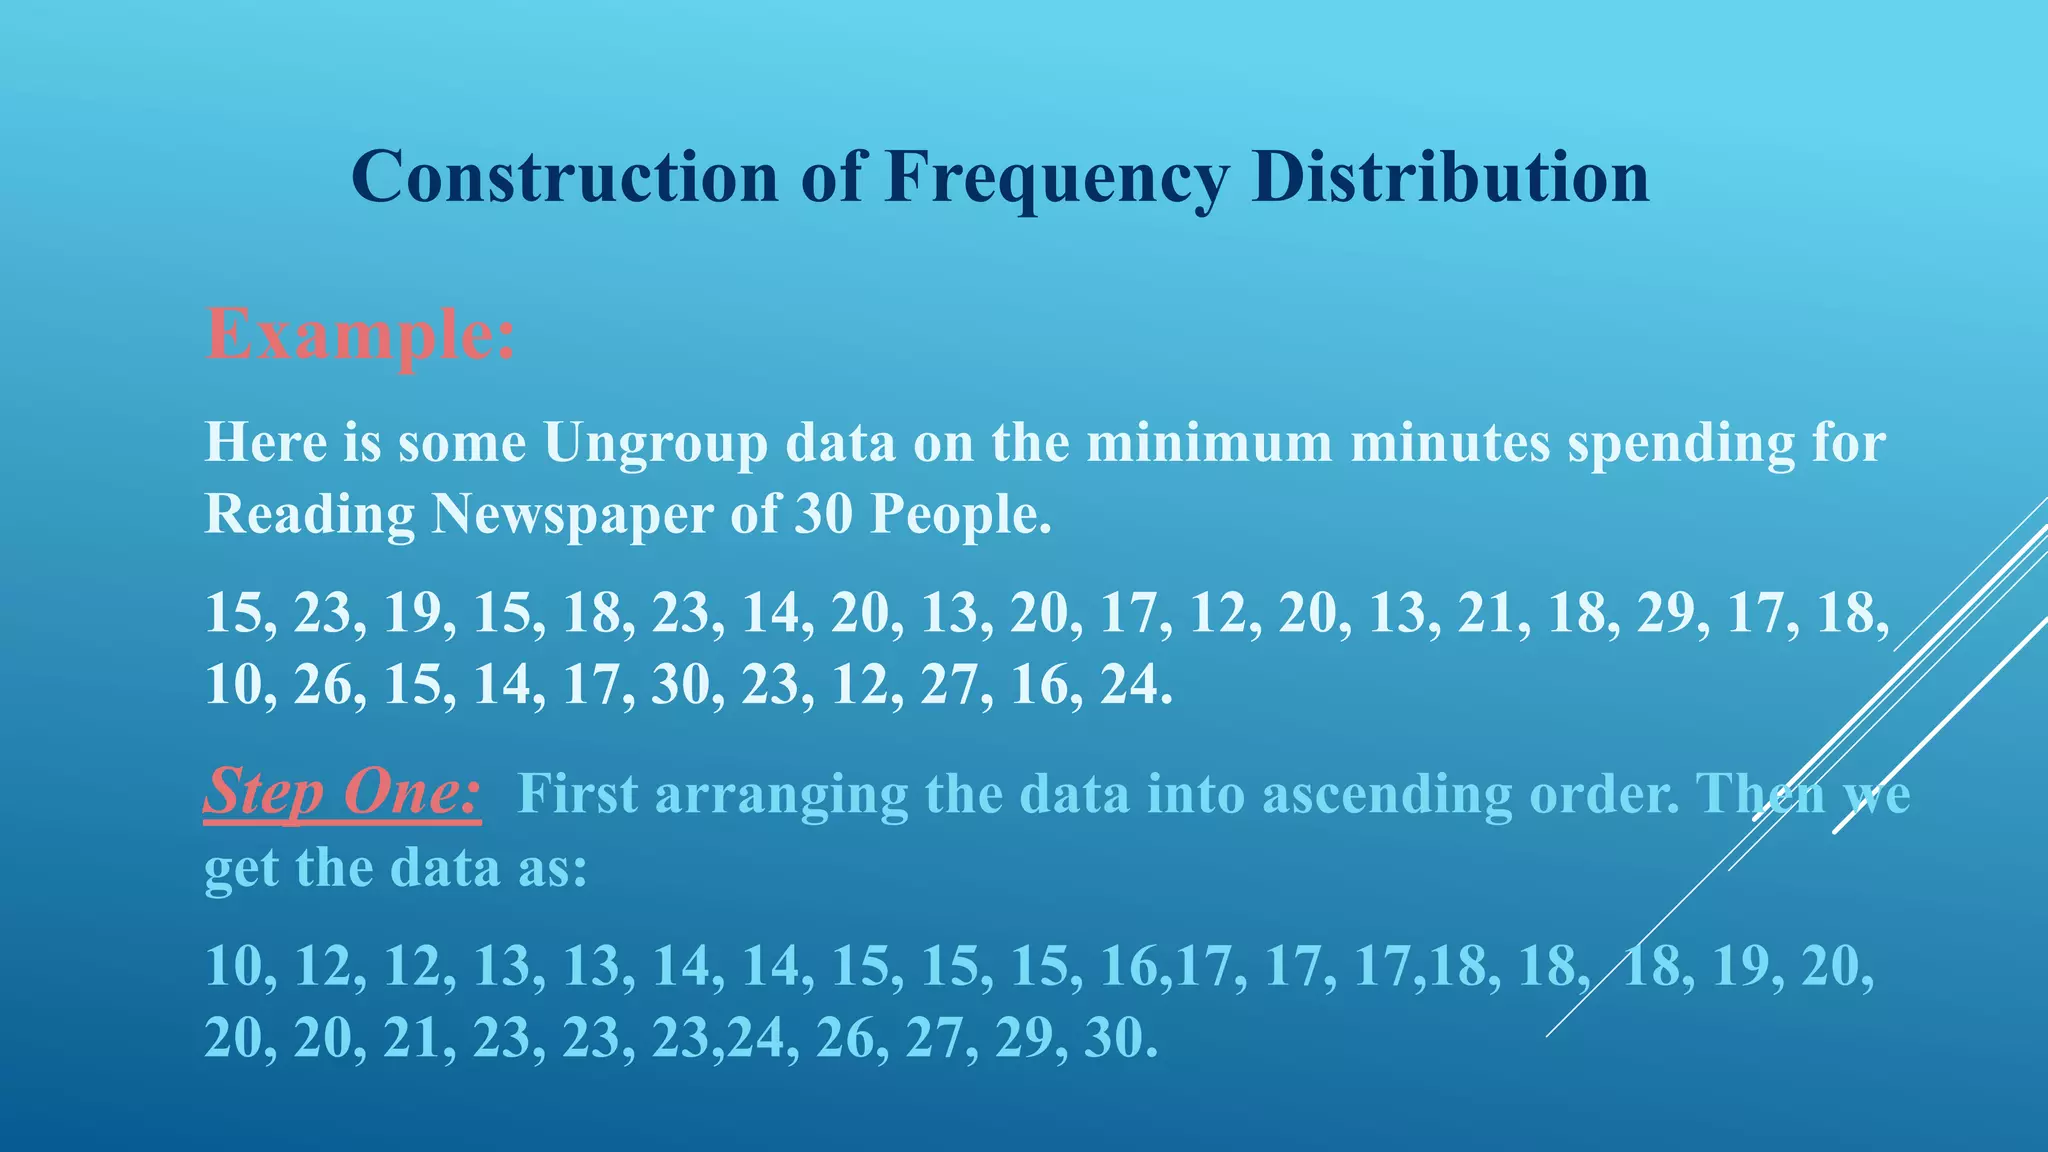
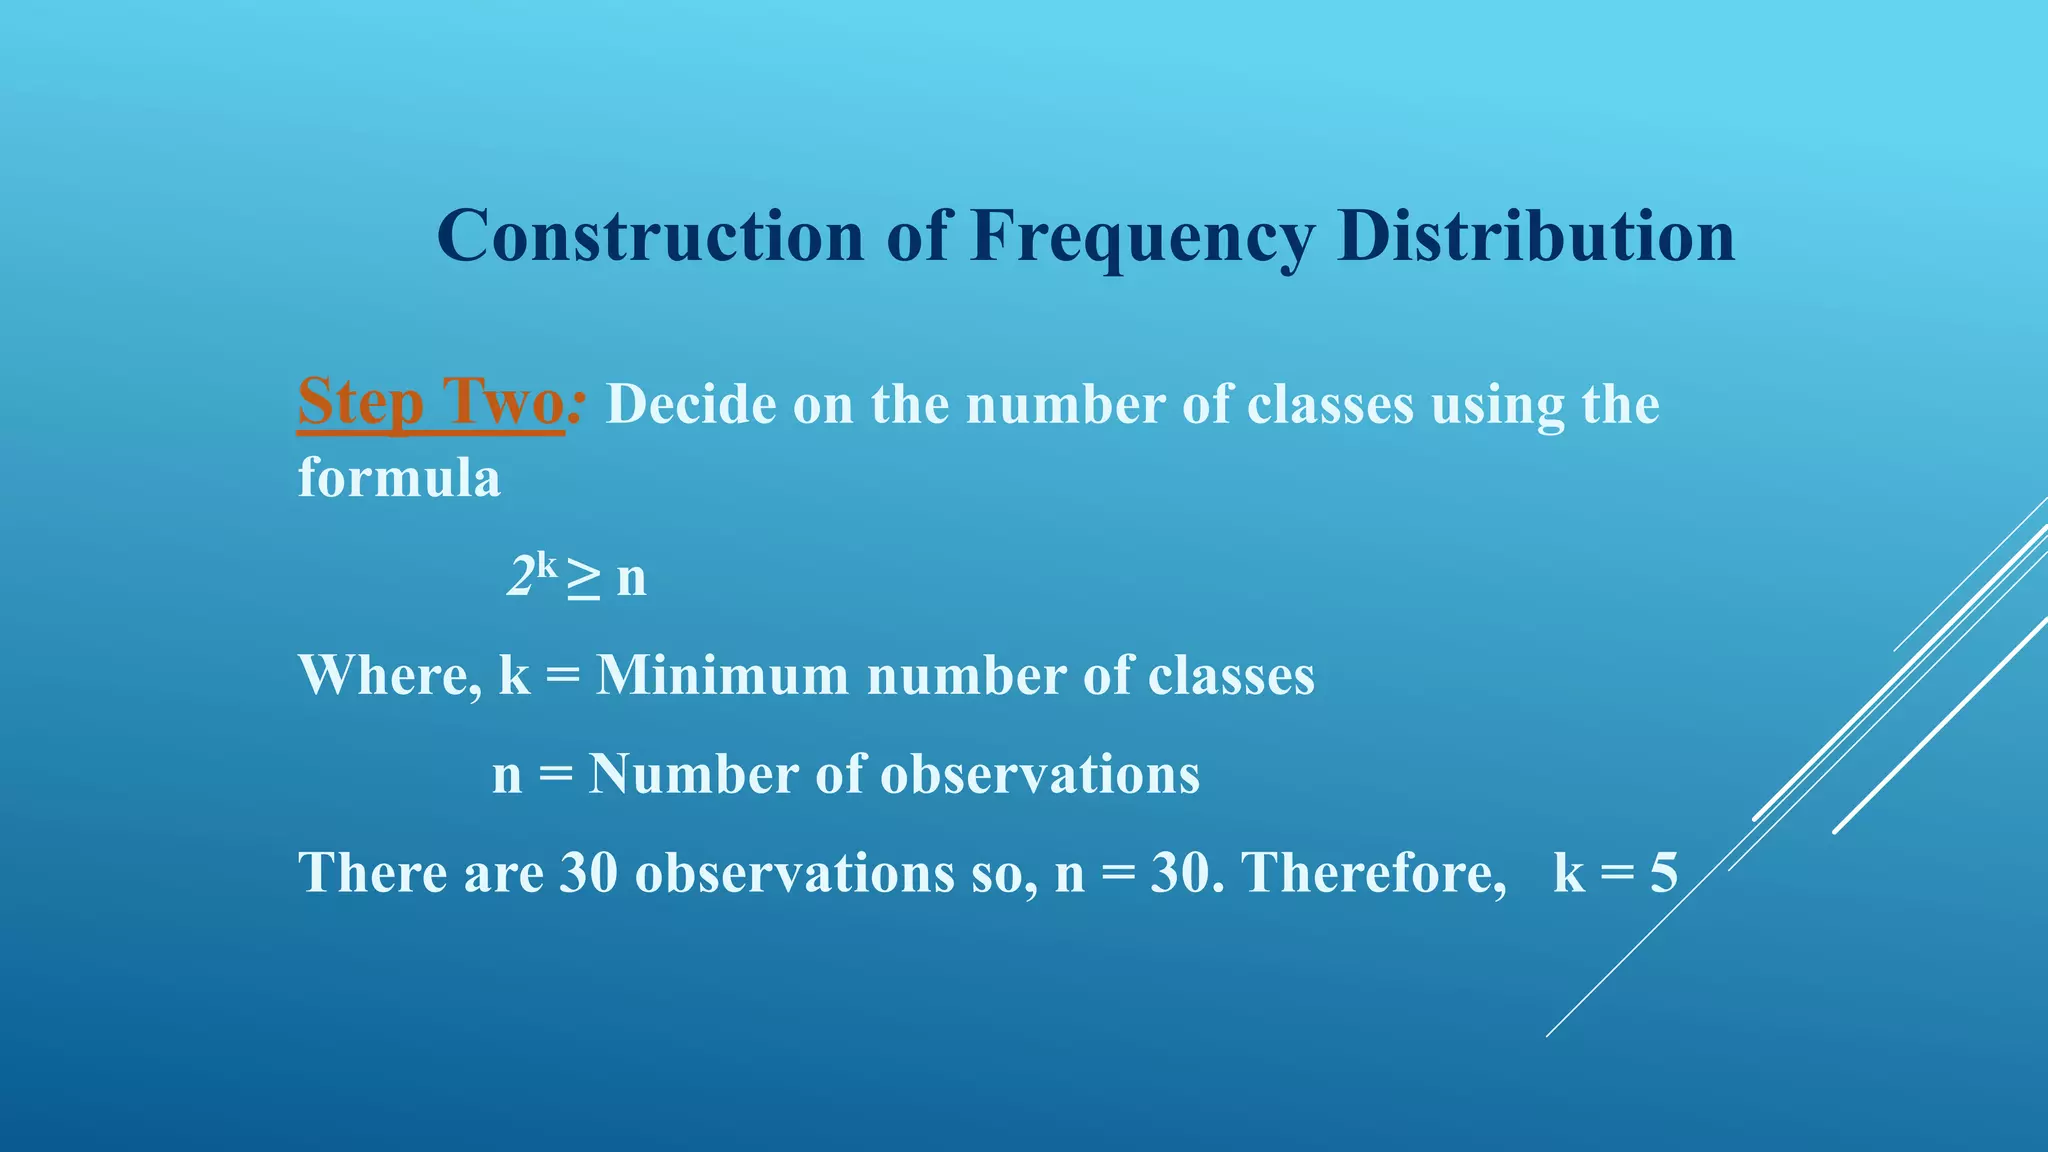
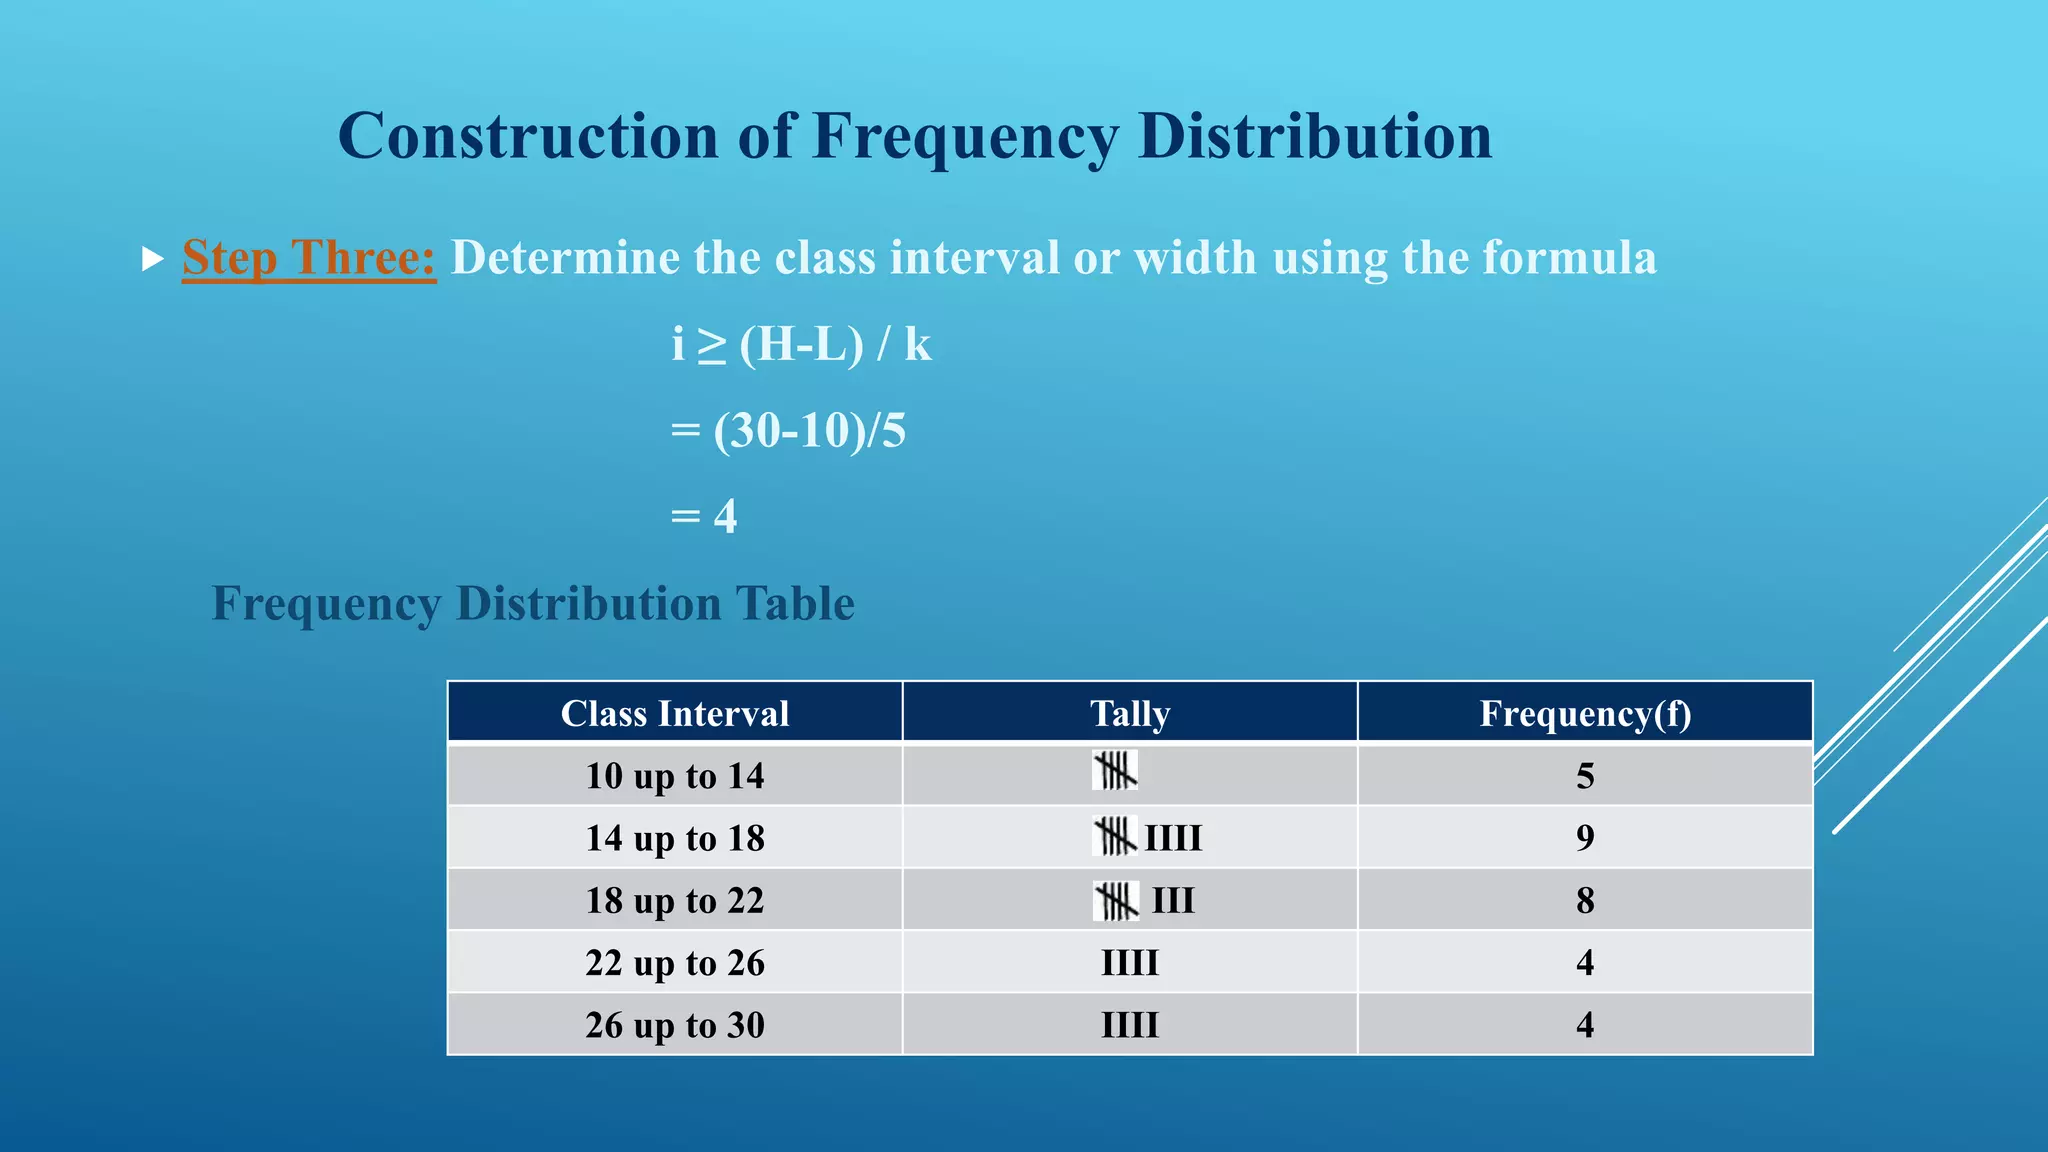
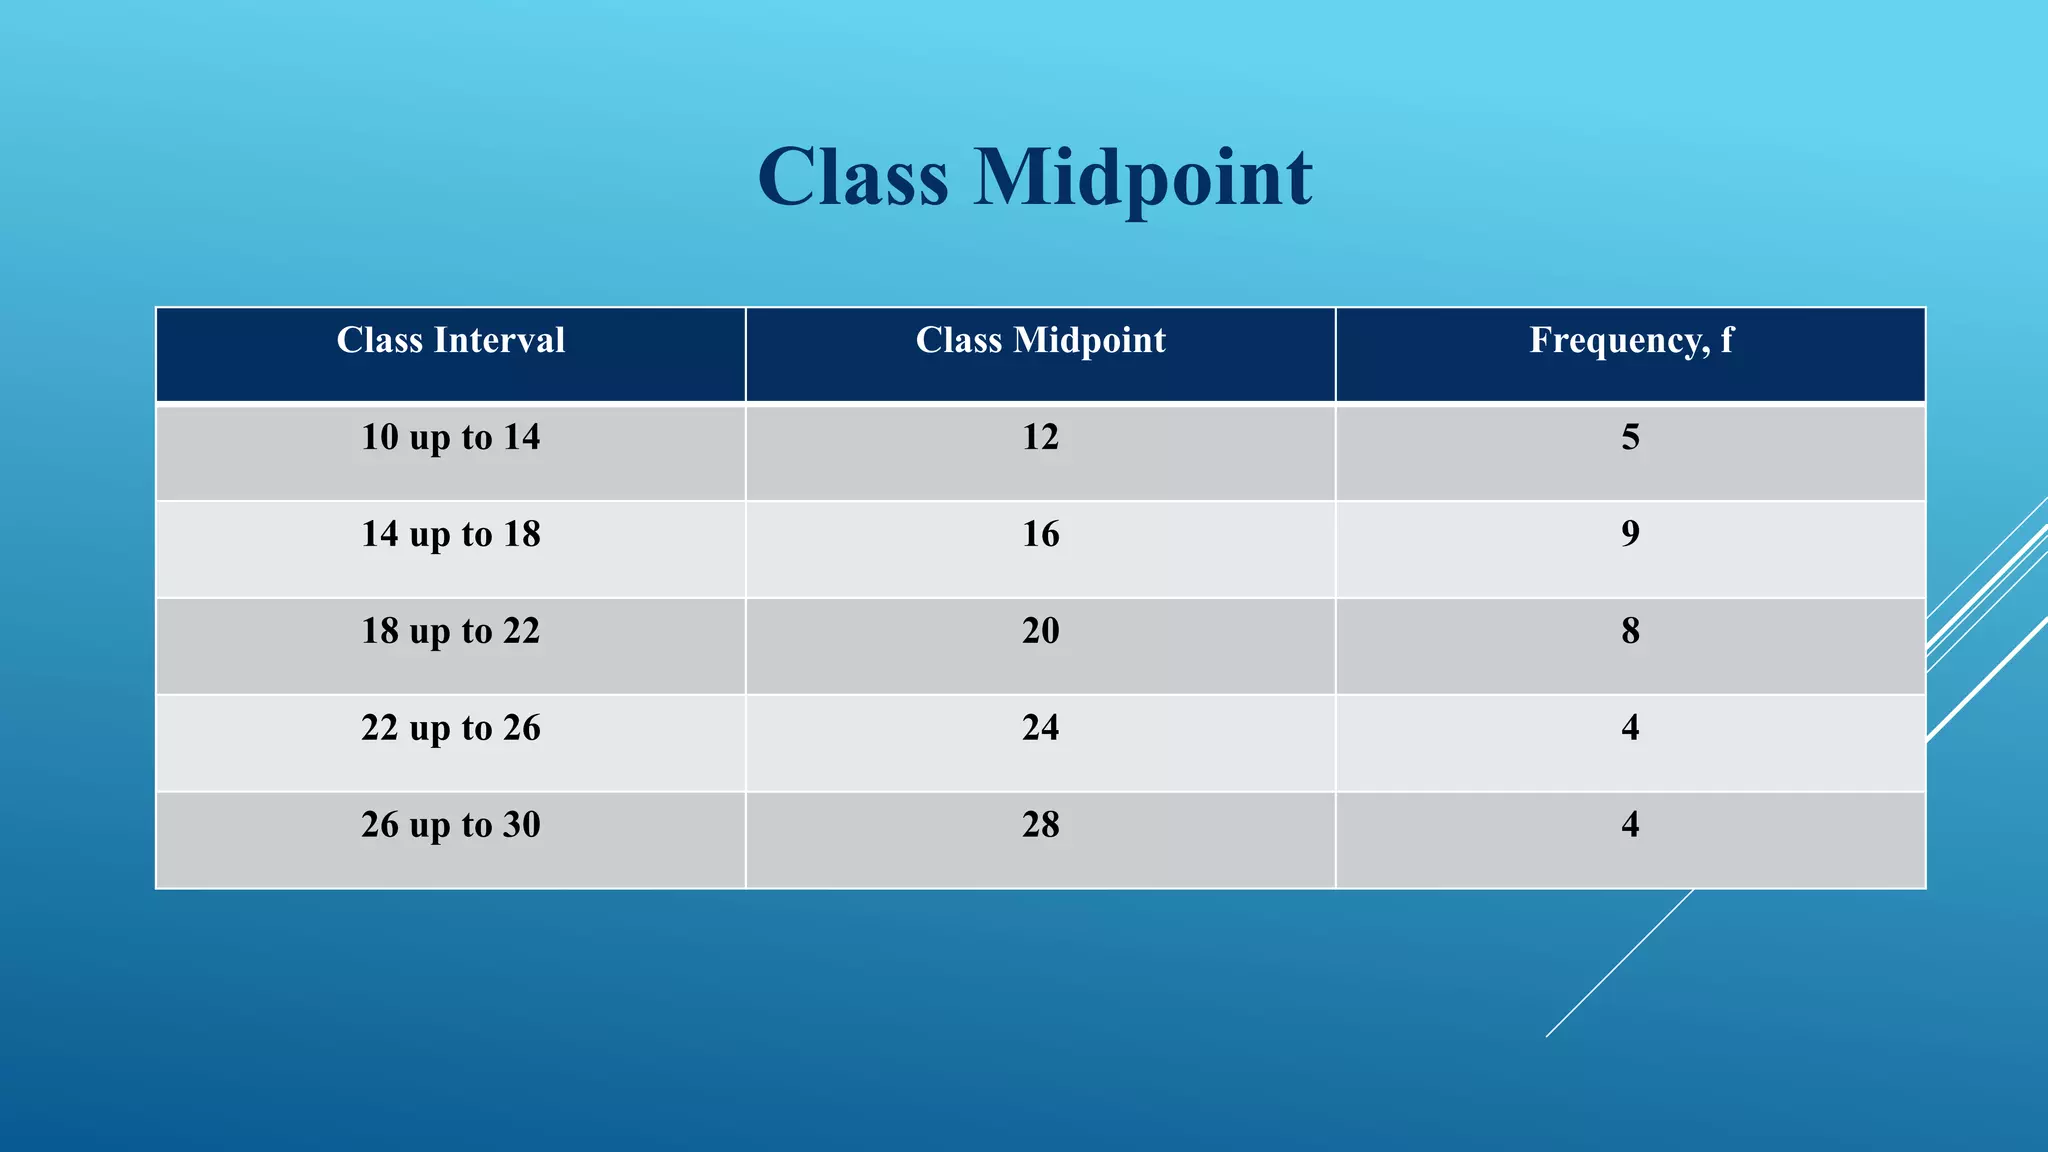
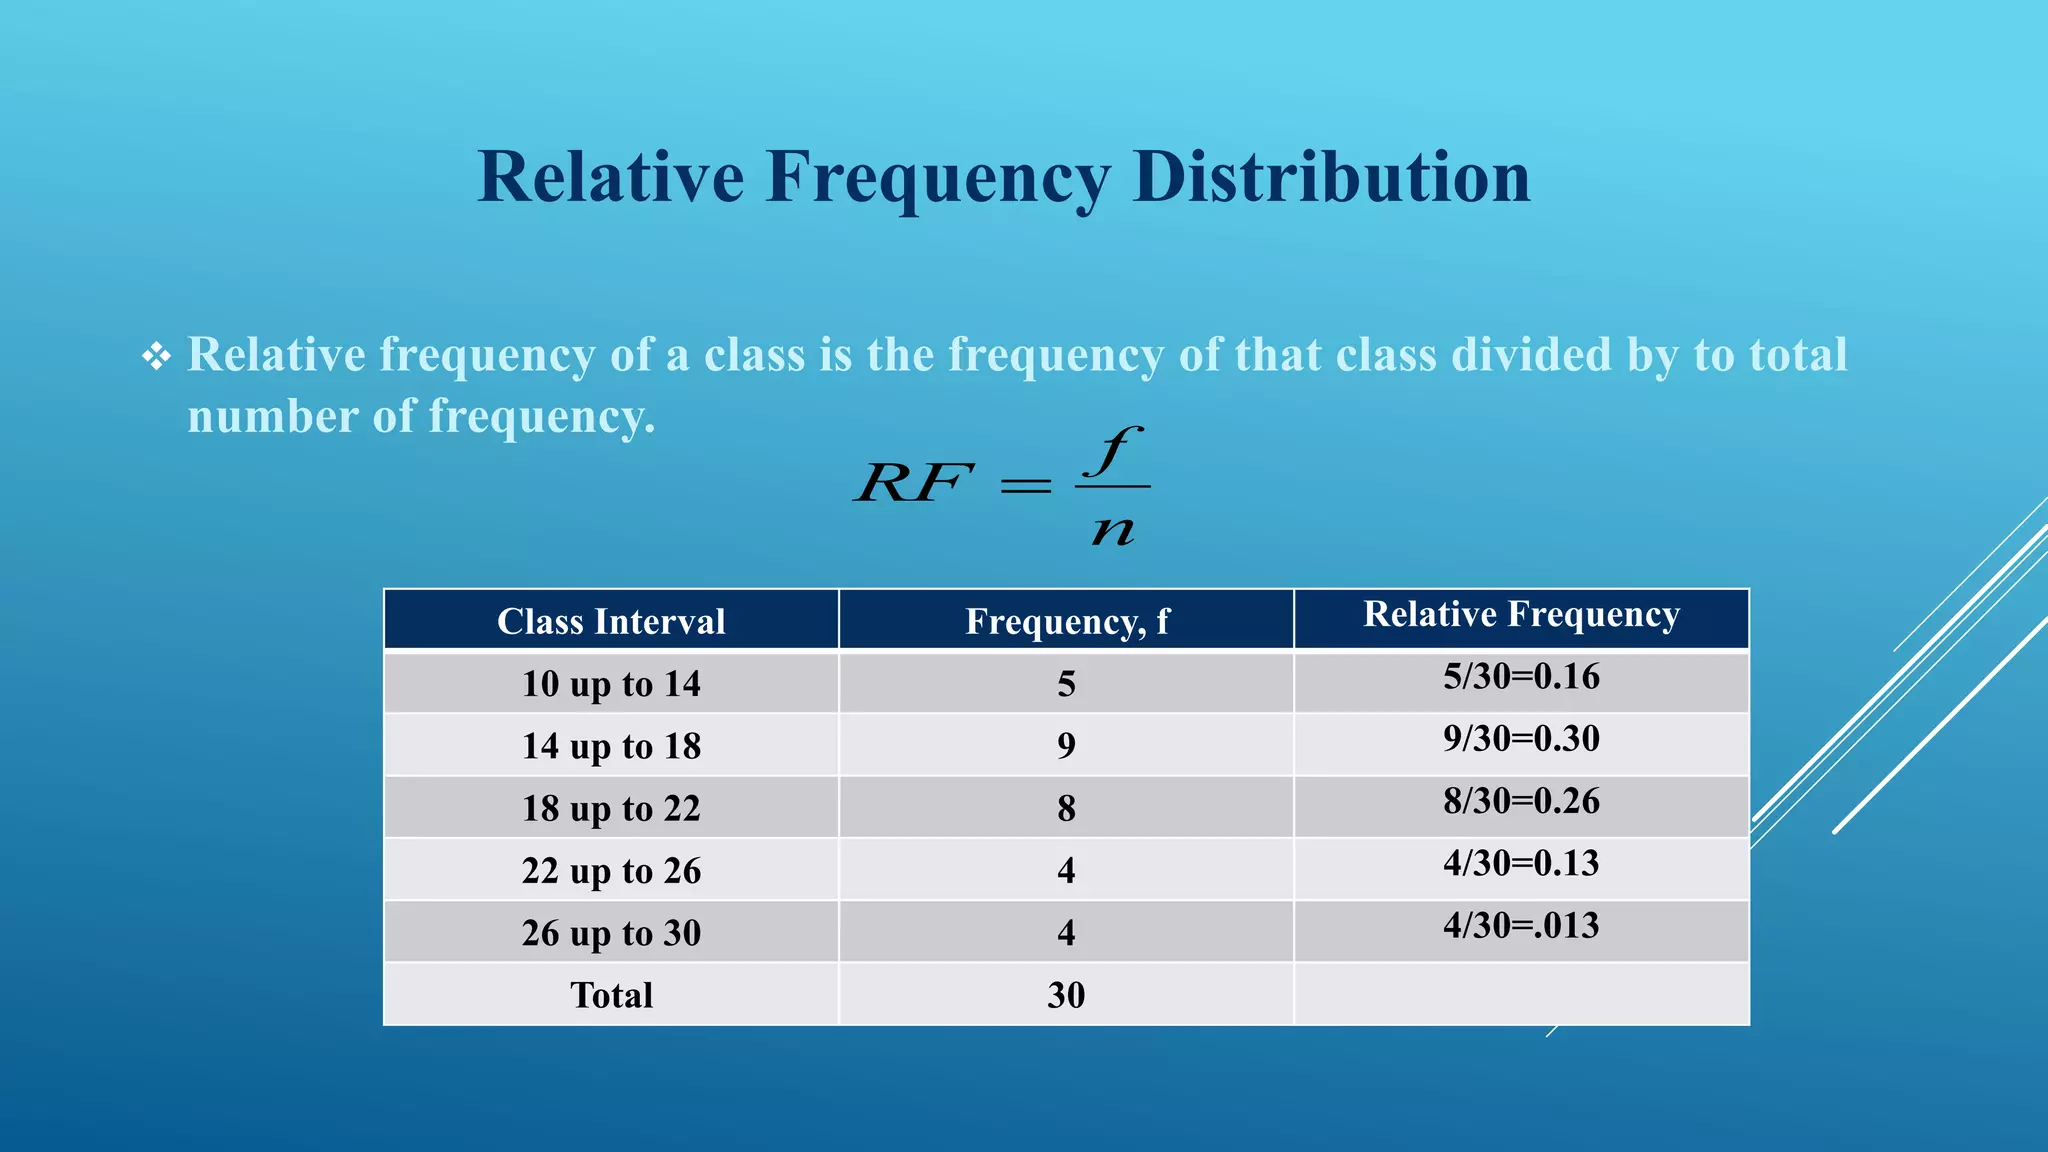
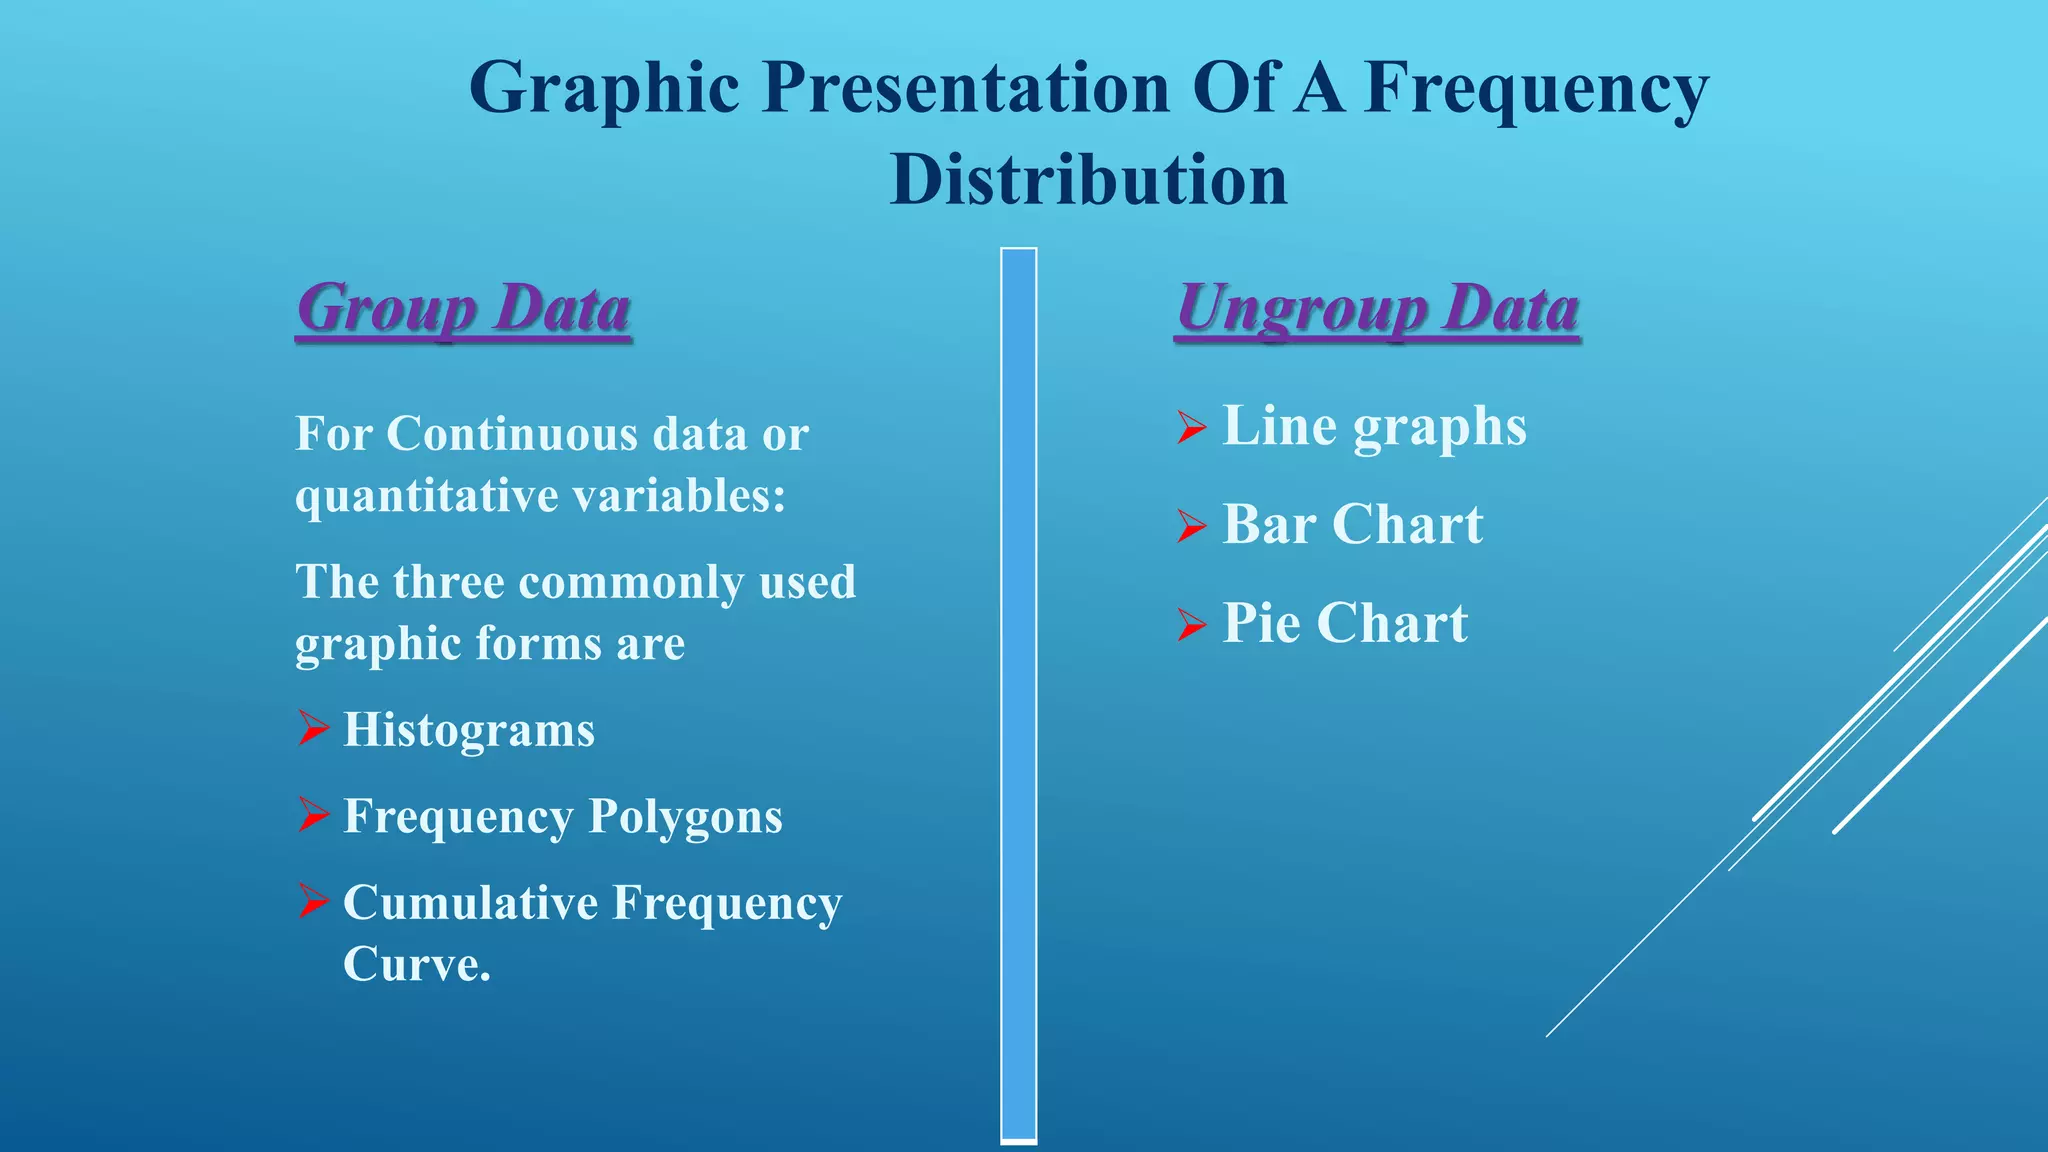
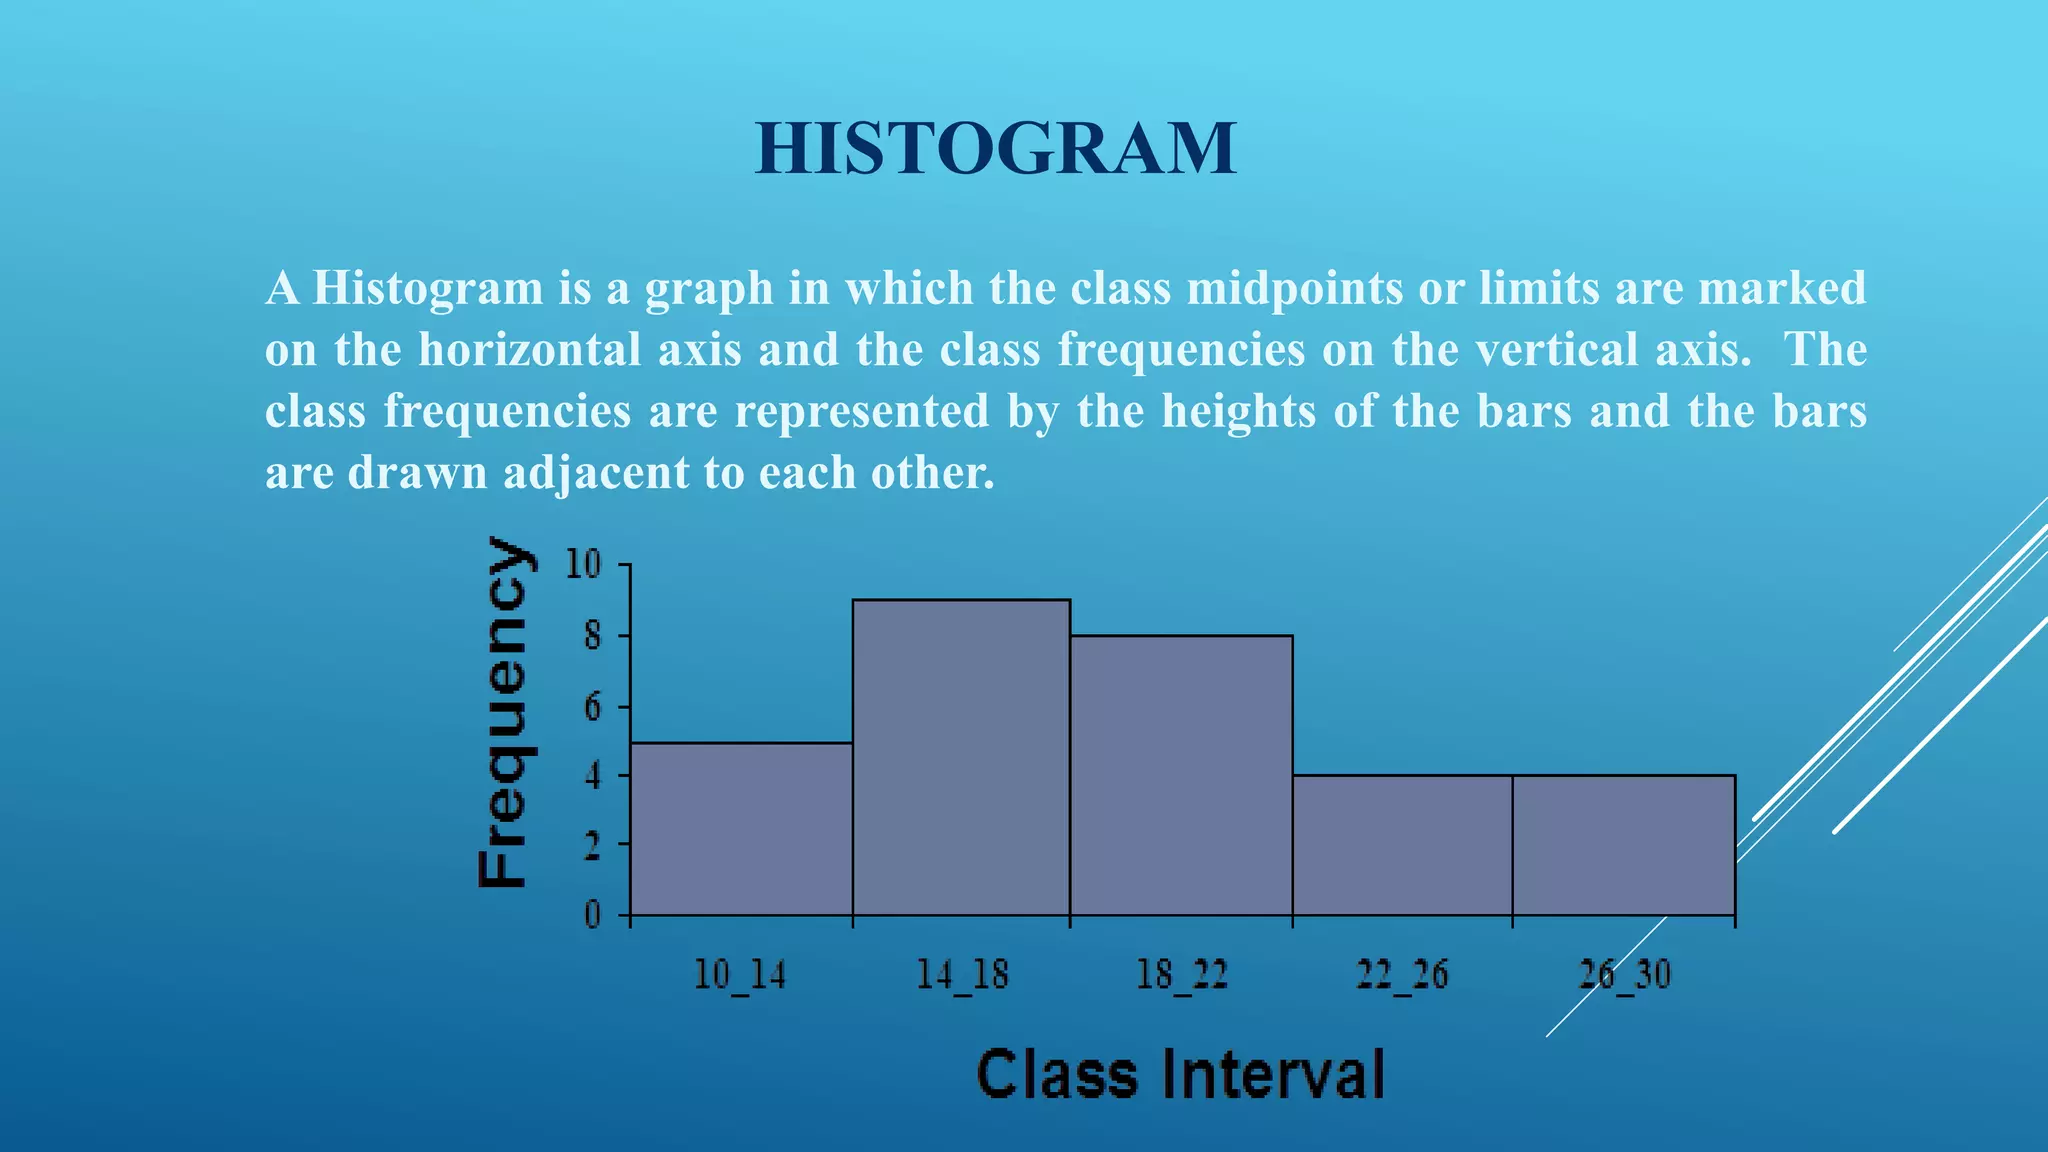
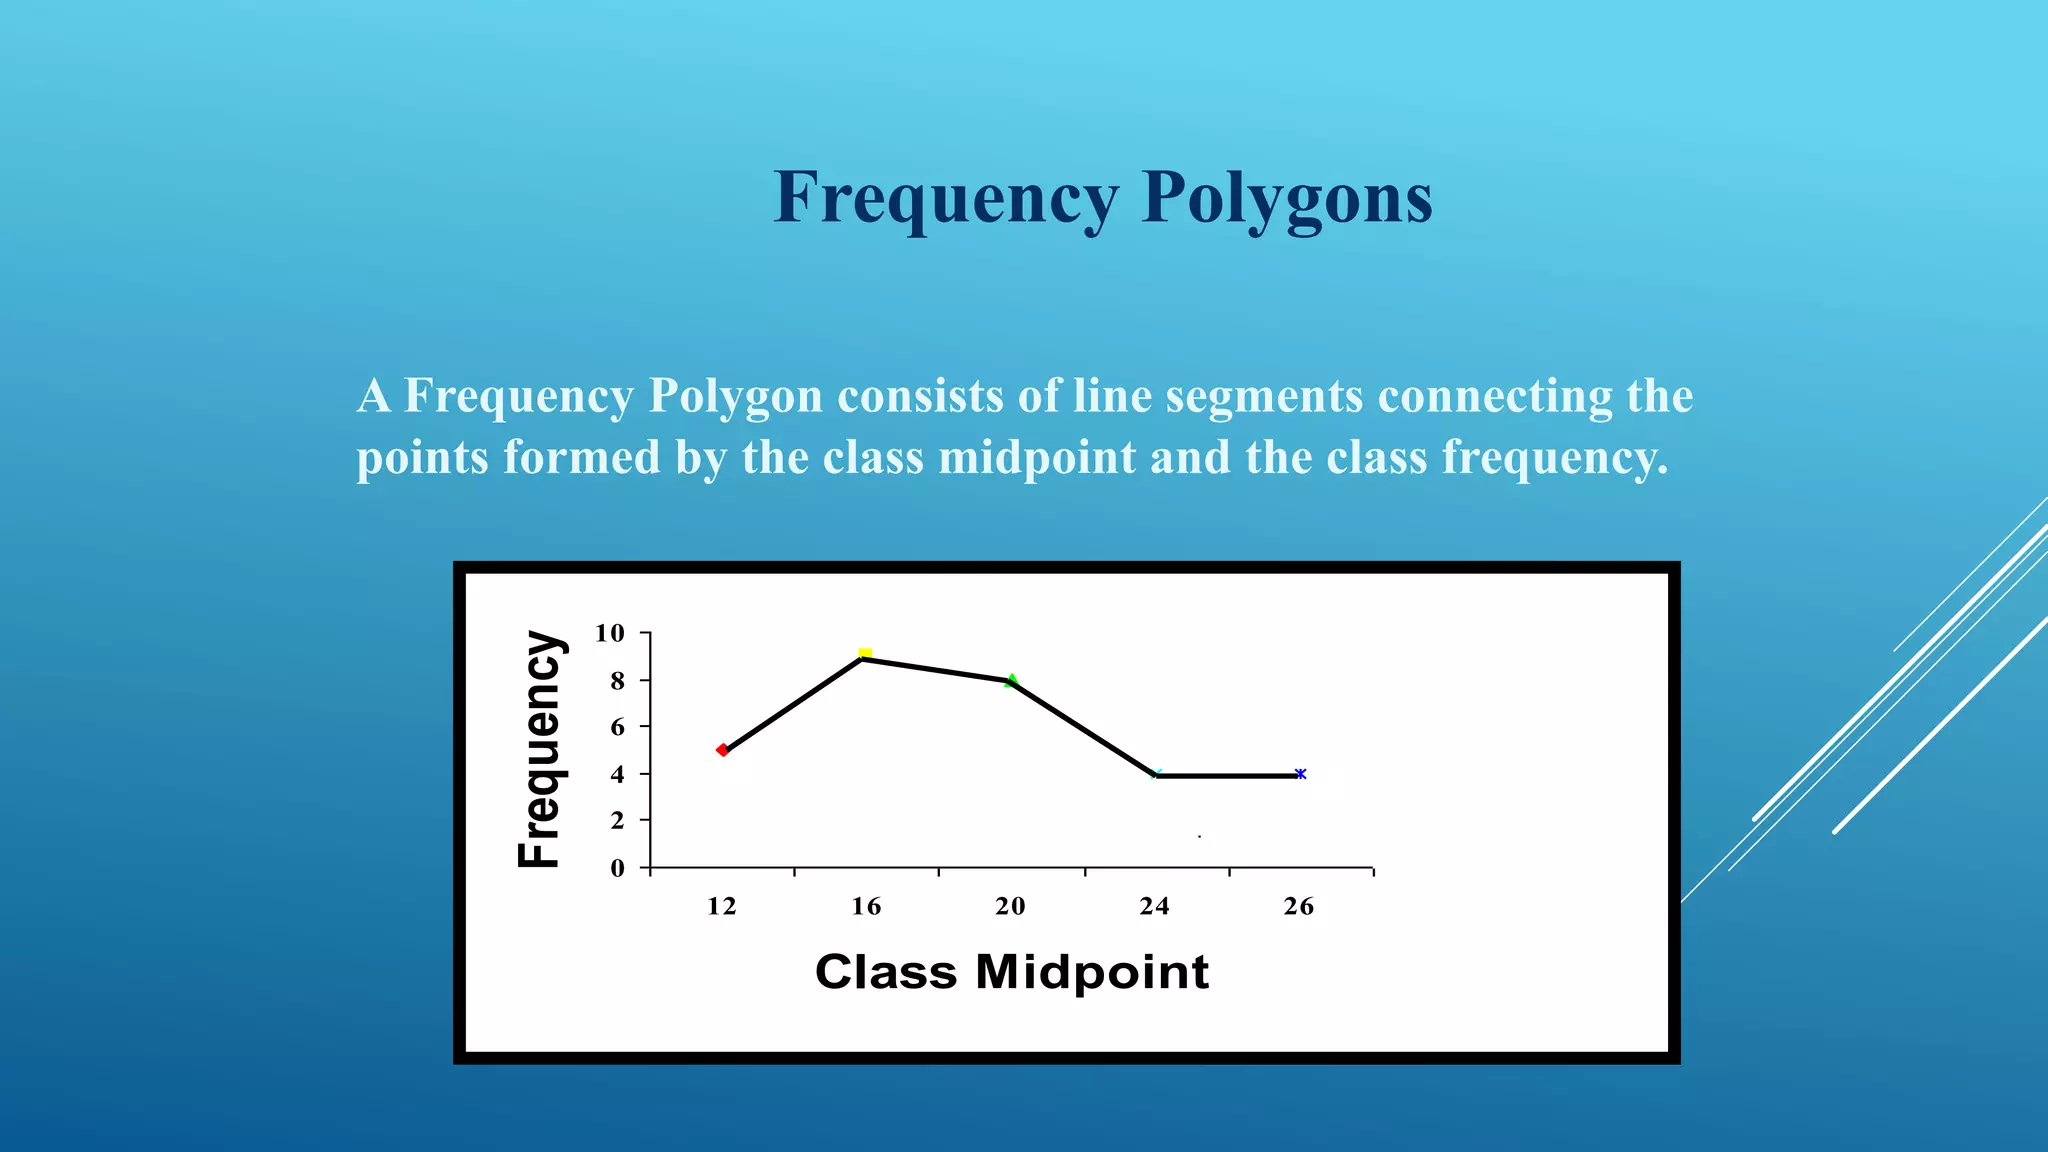
GROUP MEMBERS
NAME ID NO
Frequency
Distribution &
Graph
FREQUENCY DISTRIBUTION
Frequency Distribution is a grouping of data into mutually
exclusive categories showing the number of observations in each
class.
The number of hours each student studied last week.
SOME IMPORTANT TERMS
 Class Limit: The class limits are the lowest and the highest values that can
be included in the class.
 Class Interval: The class interval is obtained by subtracting the lower limit
of a class from the lower limit of the next class. The class intervals should
be equal. It is denoted here by i.
 Class Frequency: The number of observations in each class. It is denoted
here by f.
Class Midpoint: A point that divides a class into two
equal parts. This is the average of the upper and
lower class limits.
Find the midpoint of each interval, use the following
formula:
Upper limit + lower limit
2
Characteristic of Class
There should be between 5 and 20 classes.
The classes must be continuous.
The classes must be exhaustive.
The classes must be mutually exclusive.
The classes must be equal in width.
Construction of Frequency Distribution
Example:
Here is some Ungroup data on the minimum minutes spending for
Reading Newspaper of 30 People.
15, 23, 19, 15, 18, 23, 14, 20, 13, 20, 17, 12, 20, 13, 21, 18, 29, 17, 18,
10, 26, 15, 14, 17, 30, 23, 12, 27, 16, 24.
Step One: First arranging the data into ascending order. Then we
get the data as:
10, 12, 12, 13, 13, 14, 14, 15, 15, 15, 16,17, 17, 17,18, 18, 18, 19, 20,
20, 20, 21, 23, 23, 23,24, 26, 27, 29, 30.
Construction of Frequency Distribution
Step Two: Decide on the number of classes using the
formula
2k ≥ n
Where, k = Minimum number of classes
n = Number of observations
There are 30 observations so, n = 30. Therefore, k = 5
A Guide Not A Dictator
Strictly speaking the 2k rule is a guide, not a rule. If the 2k rule
suggests you need 6 classes, also consider using 5 or 7 classes but
certainly not 3 or 9.
Construction of Frequency Distribution
 Step Three: Determine the class interval or width using the formula
i ≥ (H-L) / k
= (30-10)/5
= 4
Frequency Distribution Table
Class Interval Tally Frequency(f)
10 up to 14 5
14 up to 18 IIII 9
18 up to 22 III 8
22 up to 26 IIII 4
26 up to 30 IIII 4
Class Midpoint
Class Interval Class Midpoint Frequency, f
10 up to 14 12 5
14 up to 18 16 9
18 up to 22 20 8
22 up to 26 24 4
26 up to 30 28 4
Relative Frequency Distribution
 Relative frequency of a class is the frequency of that class divided by to total
number of frequency.
f
RF
n

Class Interval Frequency, f Relative Frequency
10 up to 14 5 5/30=0.16
14 up to 18 9 9/30=0.30
18 up to 22 8 8/30=0.26
22 up to 26 4 4/30=0.13
26 up to 30 4 4/30=.013
Total 30
Graphic Presentation Of A Frequency
Distribution
Group Data
For Continuous data or
quantitative variables:
The three commonly used
graphic forms are
Histograms
Frequency Polygons
Cumulative Frequency
Curve.
Ungroup Data
 Line graphs
 Bar Chart
 Pie Chart
HISTOGRAM
A Histogram is a graph in which the class midpoints or limits are marked
on the horizontal axis and the class frequencies on the vertical axis. The
class frequencies are represented by the heights of the bars and the bars
are drawn adjacent to each other.
Frequency Polygons
A Frequency Polygon consists of line segments connecting the
points formed by the class midpoint and the class frequency.
0
2
4
6
8
10
12 16 20 24 26
Class Midpoint
Frequency
Cumulative Frequency Distribution
 A Cumulative Frequency Distribution is used to determine how many or
what proportion of the data values are below or above a certain value.
Cumulative
Frequency
More Than Method Less Than Method
 More Than Method
 Less Than Method
Class Interval Lower Limit Frequency, f Cumulative
Frequency
10 up to 14 10 5 30
14 up to 18 14 9 25
18 up to 22 18 8 16
22 up to 26 22 4 8
26up to 30 26 4 4
Class Interval Upper Limit Frequency, f Cumulative
Frequency
10 up to 14 14 5 5
14 up to 18 18 9 14
18 up to 22 22 8 22
22 up to 26 26 4 26
26up to 30 30 4 30
Line Graphs
 Line graphs are typically used to show the change or trend in a variable over
time.
Bar Chart
 In bar chart the classes are reported on the horizontal axis and the class
frequencies on the vertical axis.
Pie Chart
 A circle is divided proportionally to the relative frequency and portions of
the circle are allocated for the different groups.
Frequency distribution & graph

Frequency distribution & graph

  • 2.
  • 3.
  • 4.
    FREQUENCY DISTRIBUTION Frequency Distributionis a grouping of data into mutually exclusive categories showing the number of observations in each class. The number of hours each student studied last week.
  • 5.
    SOME IMPORTANT TERMS Class Limit: The class limits are the lowest and the highest values that can be included in the class.  Class Interval: The class interval is obtained by subtracting the lower limit of a class from the lower limit of the next class. The class intervals should be equal. It is denoted here by i.  Class Frequency: The number of observations in each class. It is denoted here by f.
  • 6.
    Class Midpoint: Apoint that divides a class into two equal parts. This is the average of the upper and lower class limits. Find the midpoint of each interval, use the following formula: Upper limit + lower limit 2
  • 7.
    Characteristic of Class Thereshould be between 5 and 20 classes. The classes must be continuous. The classes must be exhaustive. The classes must be mutually exclusive. The classes must be equal in width.
  • 8.
    Construction of FrequencyDistribution Example: Here is some Ungroup data on the minimum minutes spending for Reading Newspaper of 30 People. 15, 23, 19, 15, 18, 23, 14, 20, 13, 20, 17, 12, 20, 13, 21, 18, 29, 17, 18, 10, 26, 15, 14, 17, 30, 23, 12, 27, 16, 24. Step One: First arranging the data into ascending order. Then we get the data as: 10, 12, 12, 13, 13, 14, 14, 15, 15, 15, 16,17, 17, 17,18, 18, 18, 19, 20, 20, 20, 21, 23, 23, 23,24, 26, 27, 29, 30.
  • 9.
    Construction of FrequencyDistribution Step Two: Decide on the number of classes using the formula 2k ≥ n Where, k = Minimum number of classes n = Number of observations There are 30 observations so, n = 30. Therefore, k = 5
  • 10.
    A Guide NotA Dictator Strictly speaking the 2k rule is a guide, not a rule. If the 2k rule suggests you need 6 classes, also consider using 5 or 7 classes but certainly not 3 or 9.
  • 11.
    Construction of FrequencyDistribution  Step Three: Determine the class interval or width using the formula i ≥ (H-L) / k = (30-10)/5 = 4 Frequency Distribution Table Class Interval Tally Frequency(f) 10 up to 14 5 14 up to 18 IIII 9 18 up to 22 III 8 22 up to 26 IIII 4 26 up to 30 IIII 4
  • 12.
    Class Midpoint Class IntervalClass Midpoint Frequency, f 10 up to 14 12 5 14 up to 18 16 9 18 up to 22 20 8 22 up to 26 24 4 26 up to 30 28 4
  • 13.
    Relative Frequency Distribution Relative frequency of a class is the frequency of that class divided by to total number of frequency. f RF n  Class Interval Frequency, f Relative Frequency 10 up to 14 5 5/30=0.16 14 up to 18 9 9/30=0.30 18 up to 22 8 8/30=0.26 22 up to 26 4 4/30=0.13 26 up to 30 4 4/30=.013 Total 30
  • 14.
    Graphic Presentation OfA Frequency Distribution Group Data For Continuous data or quantitative variables: The three commonly used graphic forms are Histograms Frequency Polygons Cumulative Frequency Curve. Ungroup Data  Line graphs  Bar Chart  Pie Chart
  • 15.
    HISTOGRAM A Histogram isa graph in which the class midpoints or limits are marked on the horizontal axis and the class frequencies on the vertical axis. The class frequencies are represented by the heights of the bars and the bars are drawn adjacent to each other.
  • 16.
    Frequency Polygons A FrequencyPolygon consists of line segments connecting the points formed by the class midpoint and the class frequency. 0 2 4 6 8 10 12 16 20 24 26 Class Midpoint Frequency
  • 17.
    Cumulative Frequency Distribution A Cumulative Frequency Distribution is used to determine how many or what proportion of the data values are below or above a certain value. Cumulative Frequency More Than Method Less Than Method
  • 18.
     More ThanMethod  Less Than Method Class Interval Lower Limit Frequency, f Cumulative Frequency 10 up to 14 10 5 30 14 up to 18 14 9 25 18 up to 22 18 8 16 22 up to 26 22 4 8 26up to 30 26 4 4 Class Interval Upper Limit Frequency, f Cumulative Frequency 10 up to 14 14 5 5 14 up to 18 18 9 14 18 up to 22 22 8 22 22 up to 26 26 4 26 26up to 30 30 4 30
  • 19.
    Line Graphs  Linegraphs are typically used to show the change or trend in a variable over time.
  • 20.
    Bar Chart  Inbar chart the classes are reported on the horizontal axis and the class frequencies on the vertical axis.
  • 21.
    Pie Chart  Acircle is divided proportionally to the relative frequency and portions of the circle are allocated for the different groups.