The document discusses using integrals to calculate distance traveled based on a velocity-time graph. It explains that the area under the graph between two times represents the distance traveled during that interval. Specifically, it asks the reader to:
1) Find the velocity between 30-50 seconds from the given graph and explain why the distance can be found from the rectangular area.
2) Count the squares and find the distance traveled from 0-20 seconds by finding the area under the curved graph.
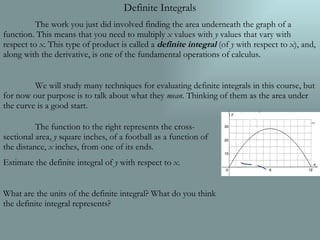
3) Estimate the definite integral of a function representing a football's cross-sectional area to find its total volume.
![As you drive on the highway you accelerate to 100 feet per second to pass a truck. After you have passed, you slow down to a more moderate 60 ft/s. The diagram shows the graph of your velocity, v(t) as a function of the number of seconds, t, since you started slowing. Copy the diagram in your notes. What does your velocity seem to be between t = 30 and t = 50 seconds? How far do you travel in the time interval [30,50]? Explain why your answer can be represented as the area of a rectangular region of the graph. Shade this reason.](https://image.slidesharecdn.com/section-13-1221506656867348-8/85/Section-1-3-Definite-Integrals-1-320.jpg)
![As you drive on the highway you accelerate to 100 feet per second to pass a truck. After you have passed, you slow down to a more moderate 60 ft/s. The diagram shows the graph of your velocity, v(t) as a function of the number of seconds, t, since you started slowing. Copy the diagram in your notes. What does your velocity seem to be between t = 30 and t = 50 seconds? How far do you travel in the time interval [30,50]? Explain why your answer can be represented as the area of a rectangular region of the graph. Shade this reason.](https://image.slidesharecdn.com/section-13-1221506656867348-8/75/Section-1-3-Definite-Integrals-1-2048.jpg)
![The distance you travel between t = 0 and t = 20 can also be represented as the area of a region bounded by the (curved) graph. Identify and count the number of squares in this region. How many feet of traveling distance does each small square on the graph represent? How far did you go in the time interval [0,20]?](https://image.slidesharecdn.com/section-13-1221506656867348-8/85/Section-1-3-Definite-Integrals-2-320.jpg)