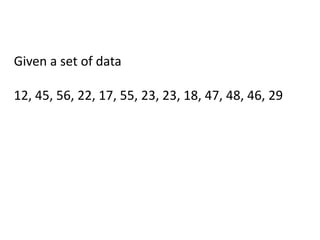
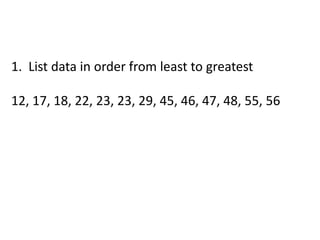
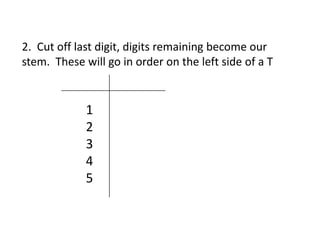
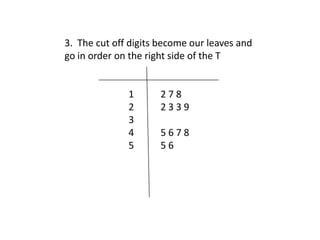
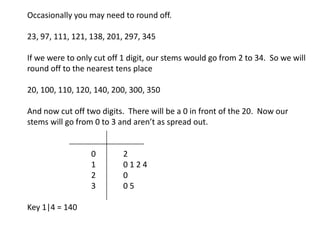
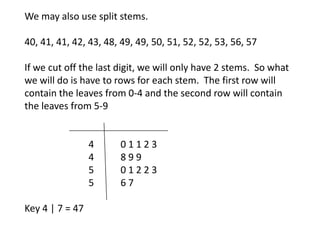
This document describes how to create stemplots, which are a visual way to represent data values. It involves ordering the data from least to greatest, using all but the last digit of each number as "stems" on the left side of a T-chart, and placing the removed last digits as "leaves" on the right side to show the distribution of values. It provides examples of creating stemplots and discusses techniques like rounding stems or using split stems when data is not well-distributed along a single stem.