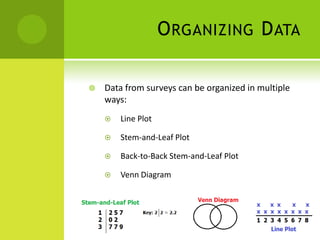
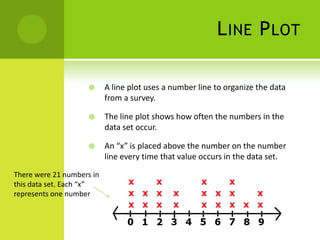
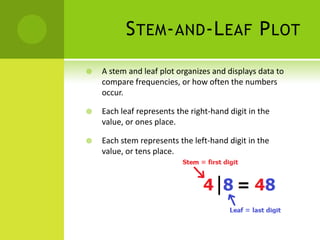
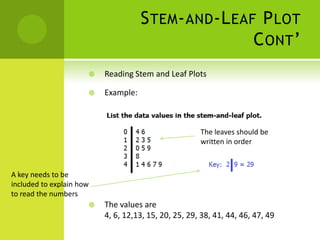
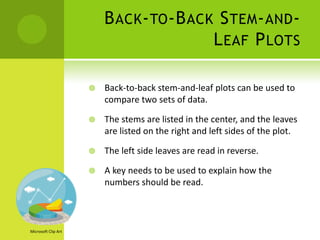
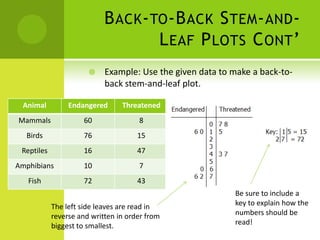
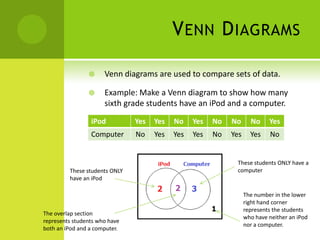
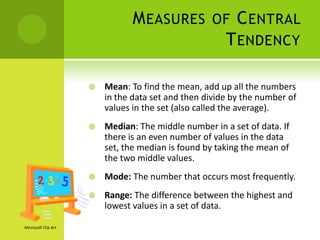
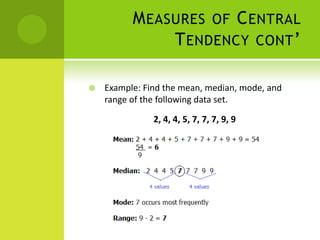
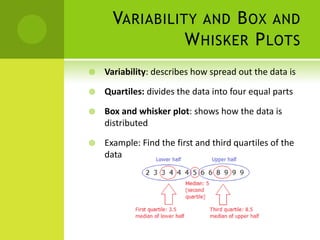
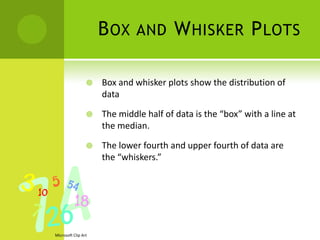
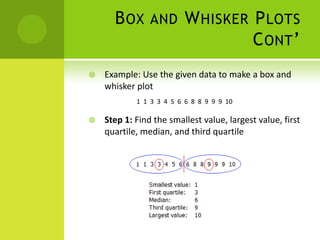
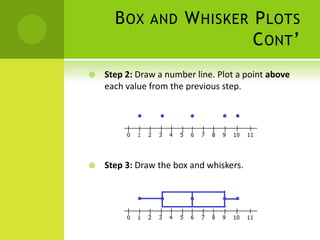
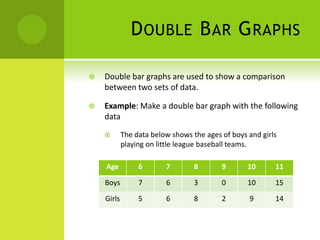
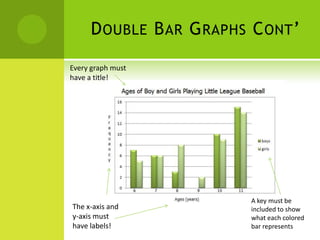
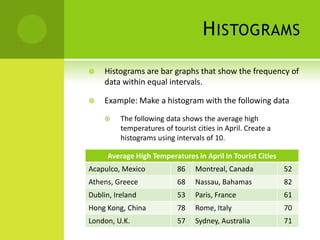
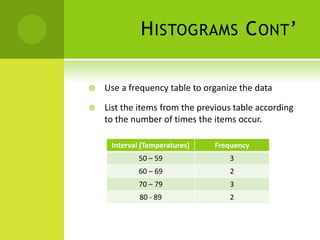
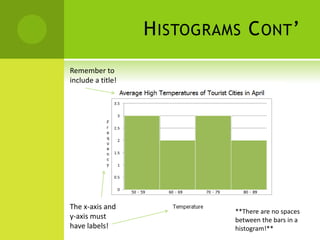
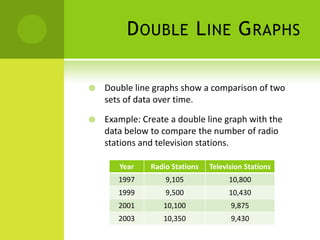
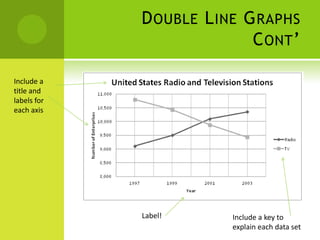
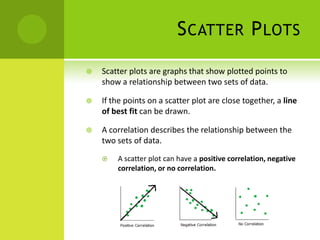
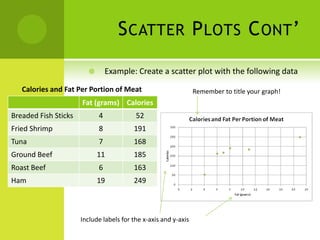
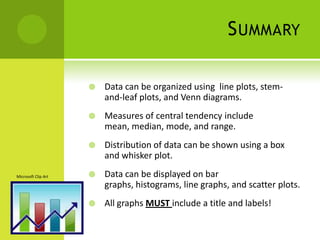
This document discusses various methods for organizing and displaying data, including line plots, stem-and-leaf plots, Venn diagrams, measures of central tendency, box and whisker plots, histograms, scatter plots, and double bar graphs and line graphs. It provides examples and explanations of each method. Key requirements for graphs like titles and labels are also covered.