Download to read offline
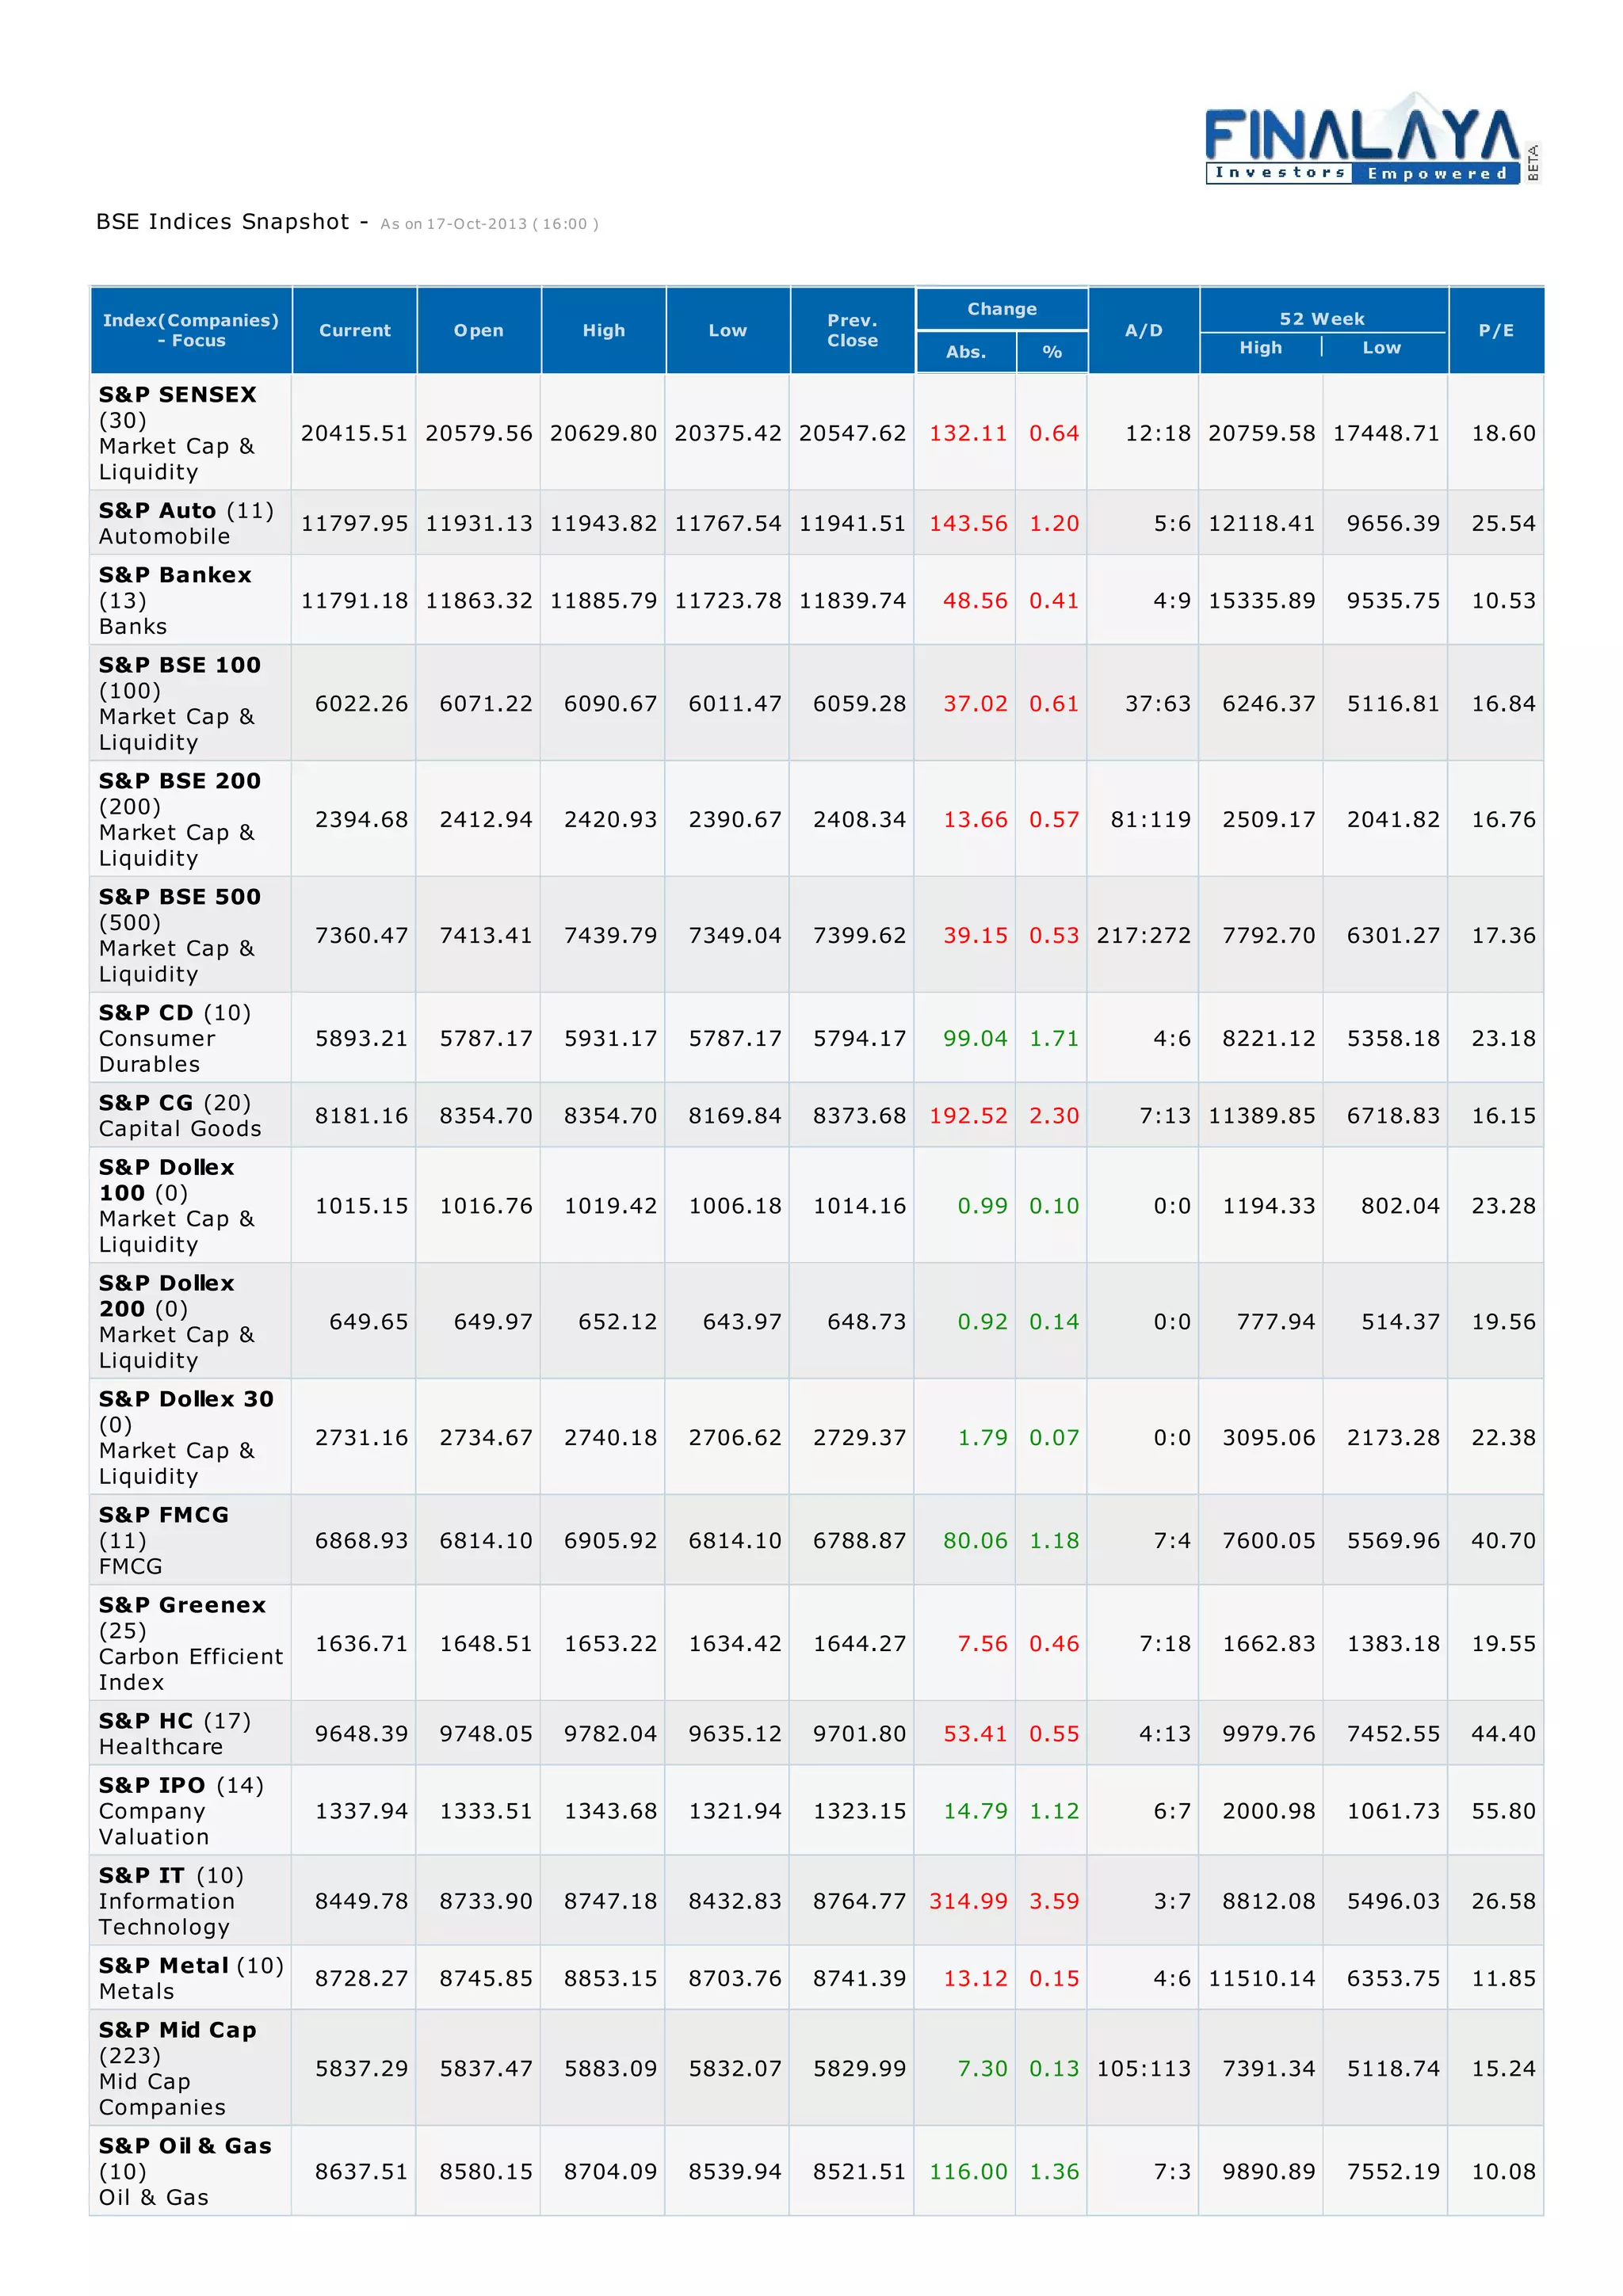
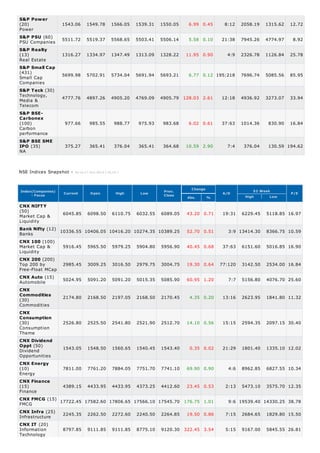
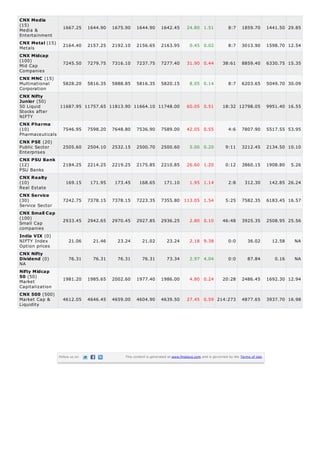

The document provides a snapshot of key Indian stock market indices as of 17 October 2013 at 4:00 PM. It lists 20 indices including the S&P BSE Sensex, Nifty 50, Bank Nifty, and CNX Midcap 50. For each index it provides the current value, day's high and low, previous close, change from previous close in absolute and percentage terms, and other statistical data like 52-week high and low, and P/E ratio. The indices largely closed higher for the day with gains of up to 3.59% and losses of up to 2.90%.


