Downloaded 128 times
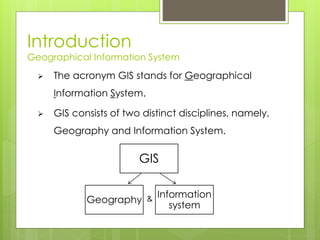
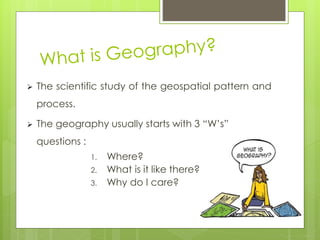
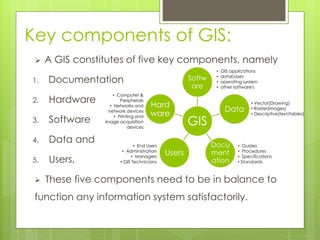

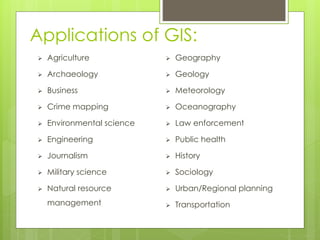


The document introduces Geographic Information Systems (GIS), explaining its components, history, and significance in analyzing geospatial data. It outlines the two primary data models used in GIS—raster and vector—and lists various applications across multiple fields such as agriculture, environmental science, and urban planning. GIS integrates hardware, software, and data for effective geographic data management and decision-making.


