Downloaded 238 times


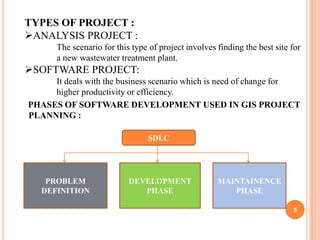
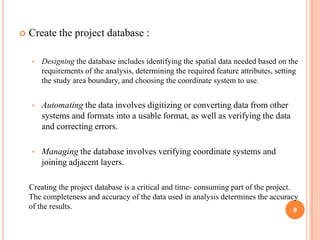
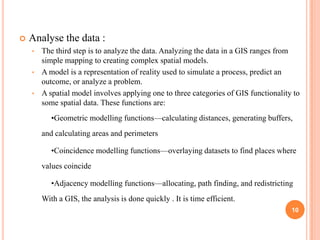

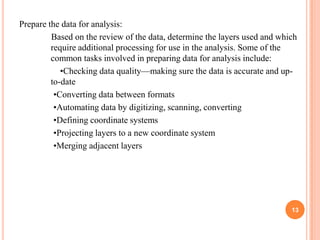


This document outlines the planning process for a GIS analysis project to identify suitable sites for a new wastewater treatment plant. It discusses why many GIS projects fail, the types and phases of GIS projects. It then details the steps involved in a GIS analysis project including: defining the objective, creating the project database by identifying and preparing data, analyzing the data using spatial modeling functions, and presenting the results. For the wastewater treatment plant project, the analysis will identify parcels that meet criteria like being in a low-lying area near water and not residential, and the results will be shown on a presentation map.