Downloaded 1,045 times


![29
function [] = ccdf_log_plot(x)
Th = 20*log10([0.1:0.1:10]);
kk = 1;
th_current = Th(1);
rms = sqrt(mean((x.^2)));
w = 20*log10(x/rms);
z = sort(w);
L = -inf*ones(1, length(Th));
for ii = 1:(length(z)-1)
if (z(ii) > th_current)
L(kk) = ii - 1;
kk = kk + 1;
th_current = Th(kk);
end
end
CCDF = (length(z) - L)/length(z);
semilogy(Th, CCDF);
grid on;](https://image.slidesharecdn.com/fffinalofdmdissertation-150218225131-conversion-gate02/75/Design-Ofdm-System-And-Remove-Nonlinear-Distortion-In-OFDM-Signal-At-Transmitter-Systems-Using-PAPR-Peak-To-Average-Power-Ratio-Reduction-TechniquesF-f-final-ofdm-dissertation-29-2048.jpg)
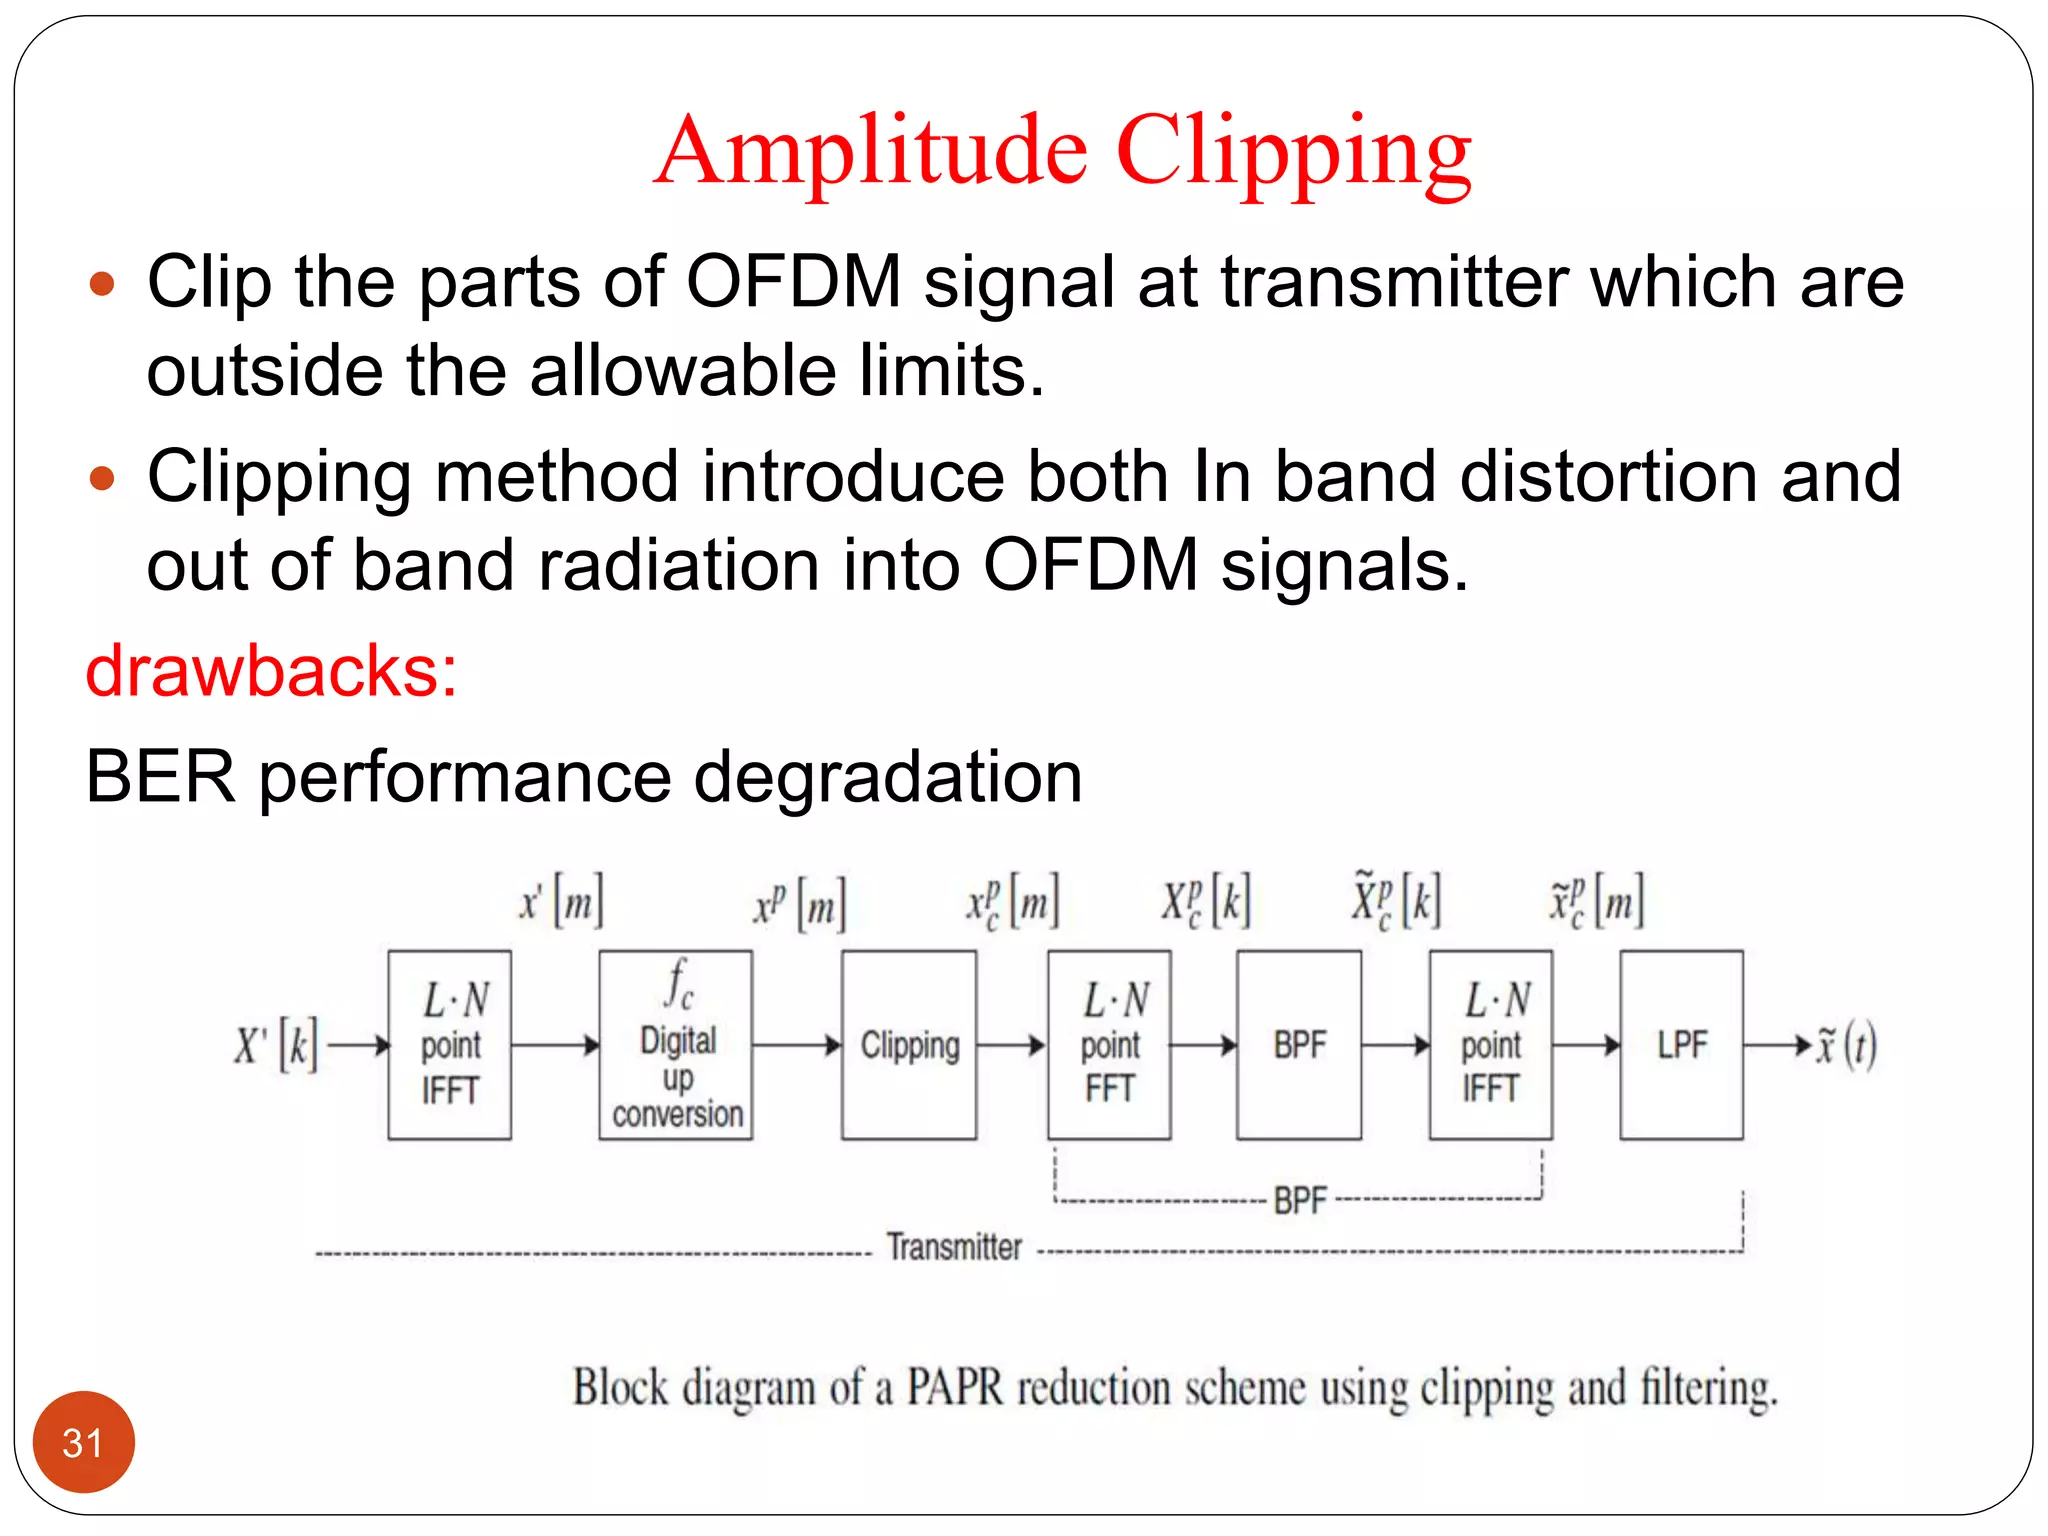

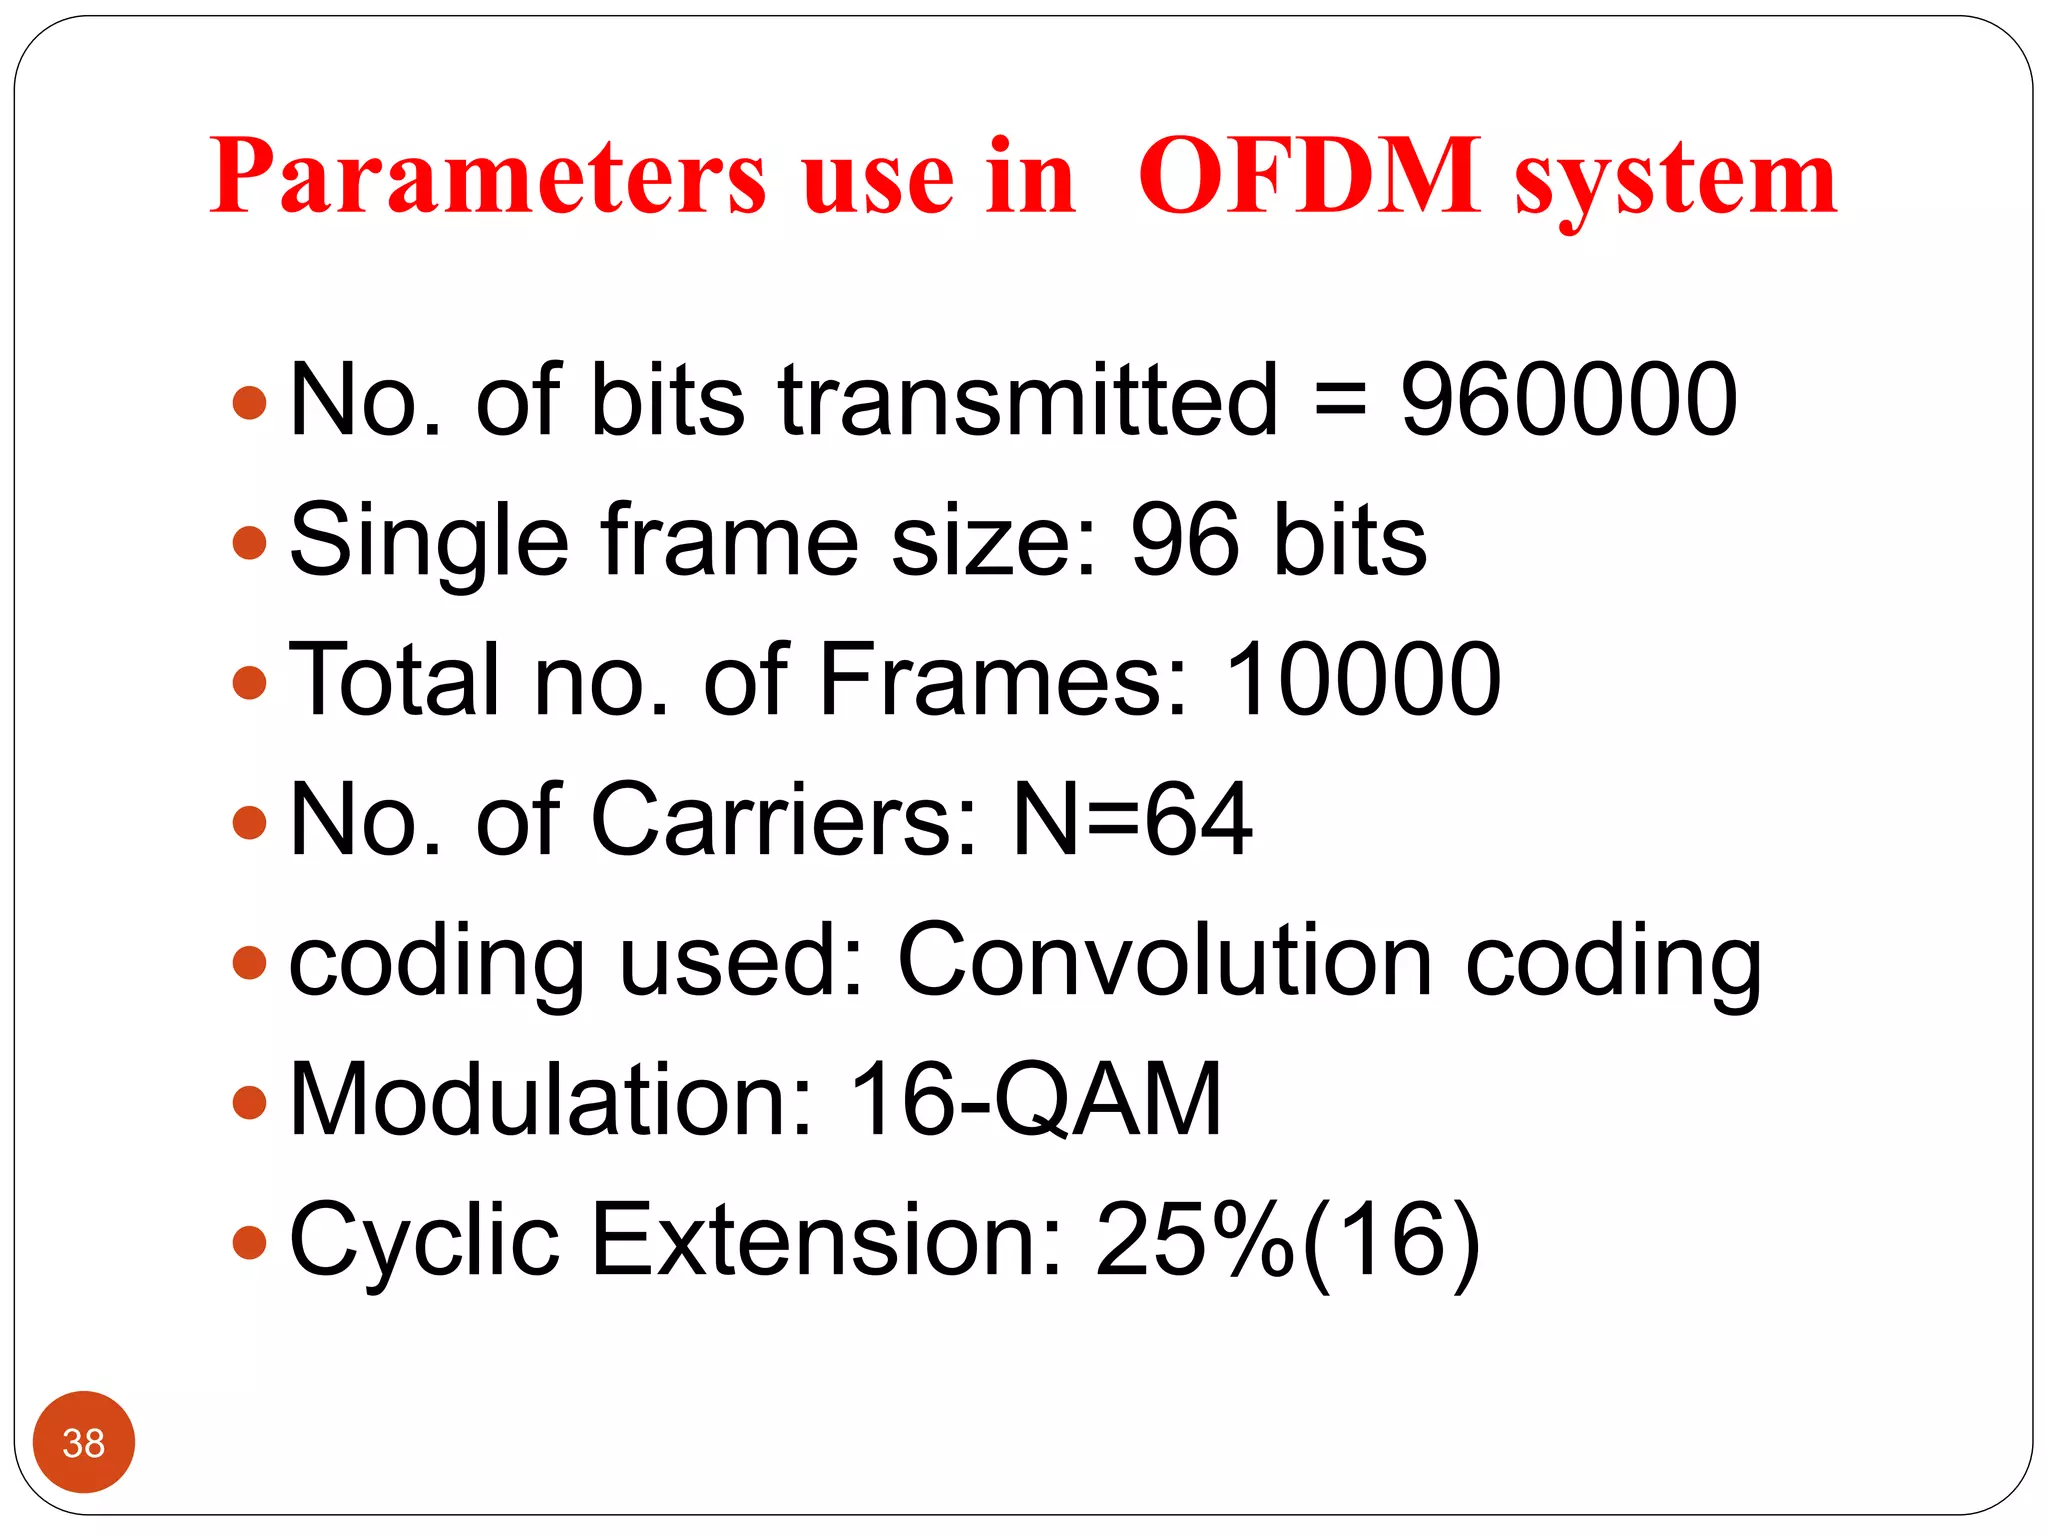
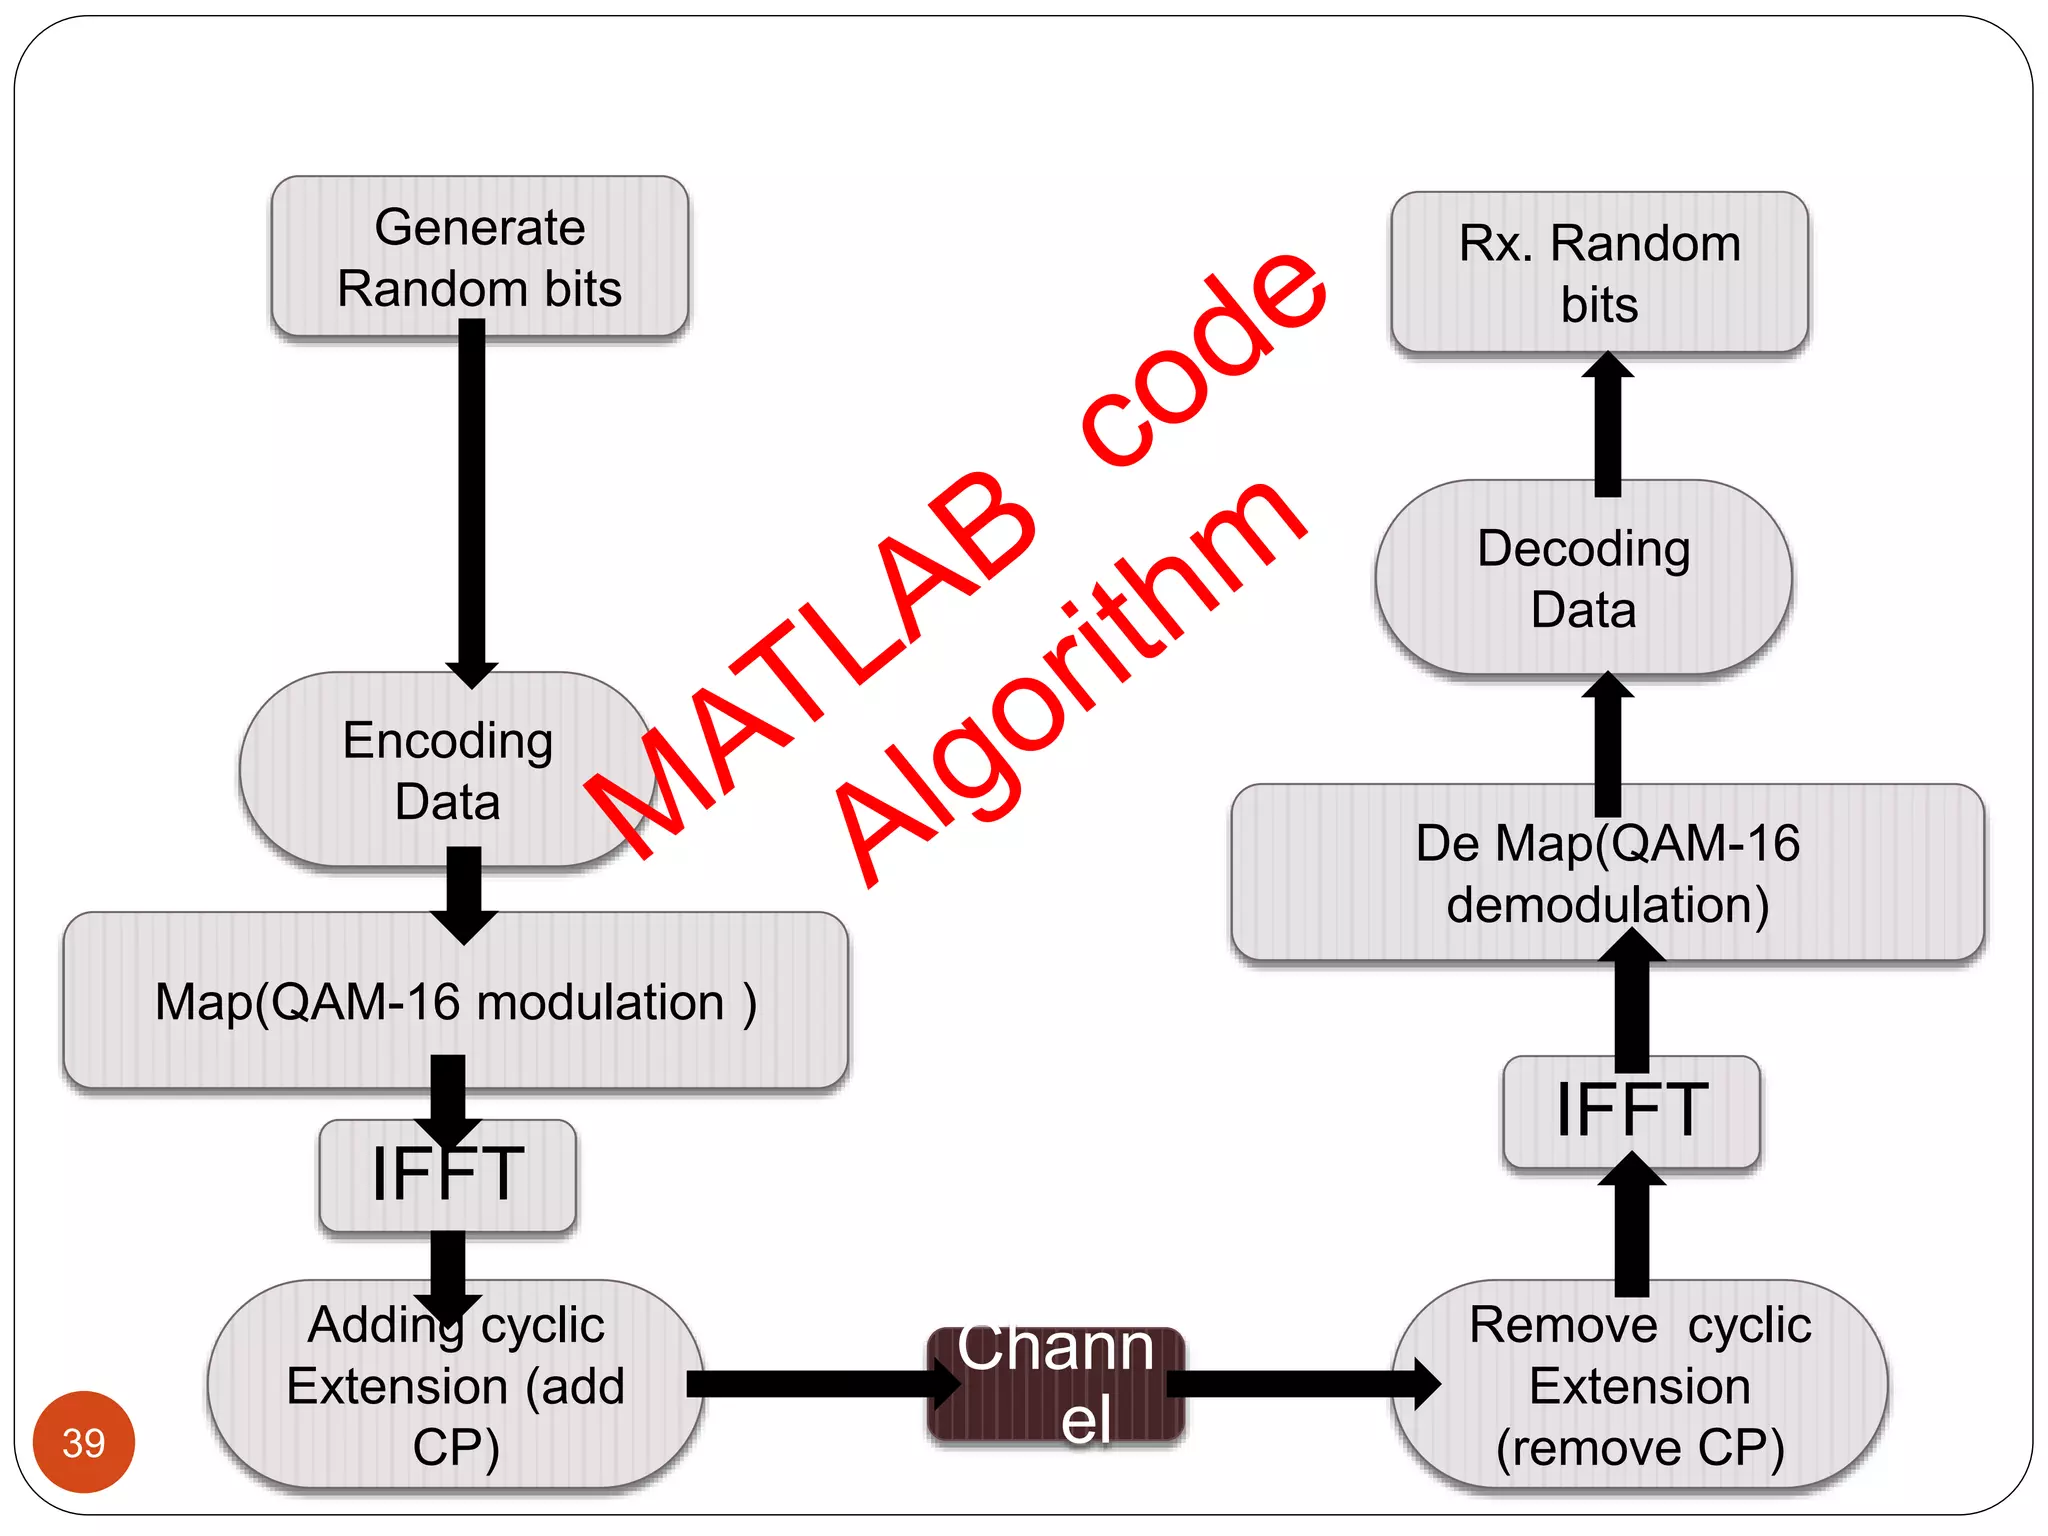
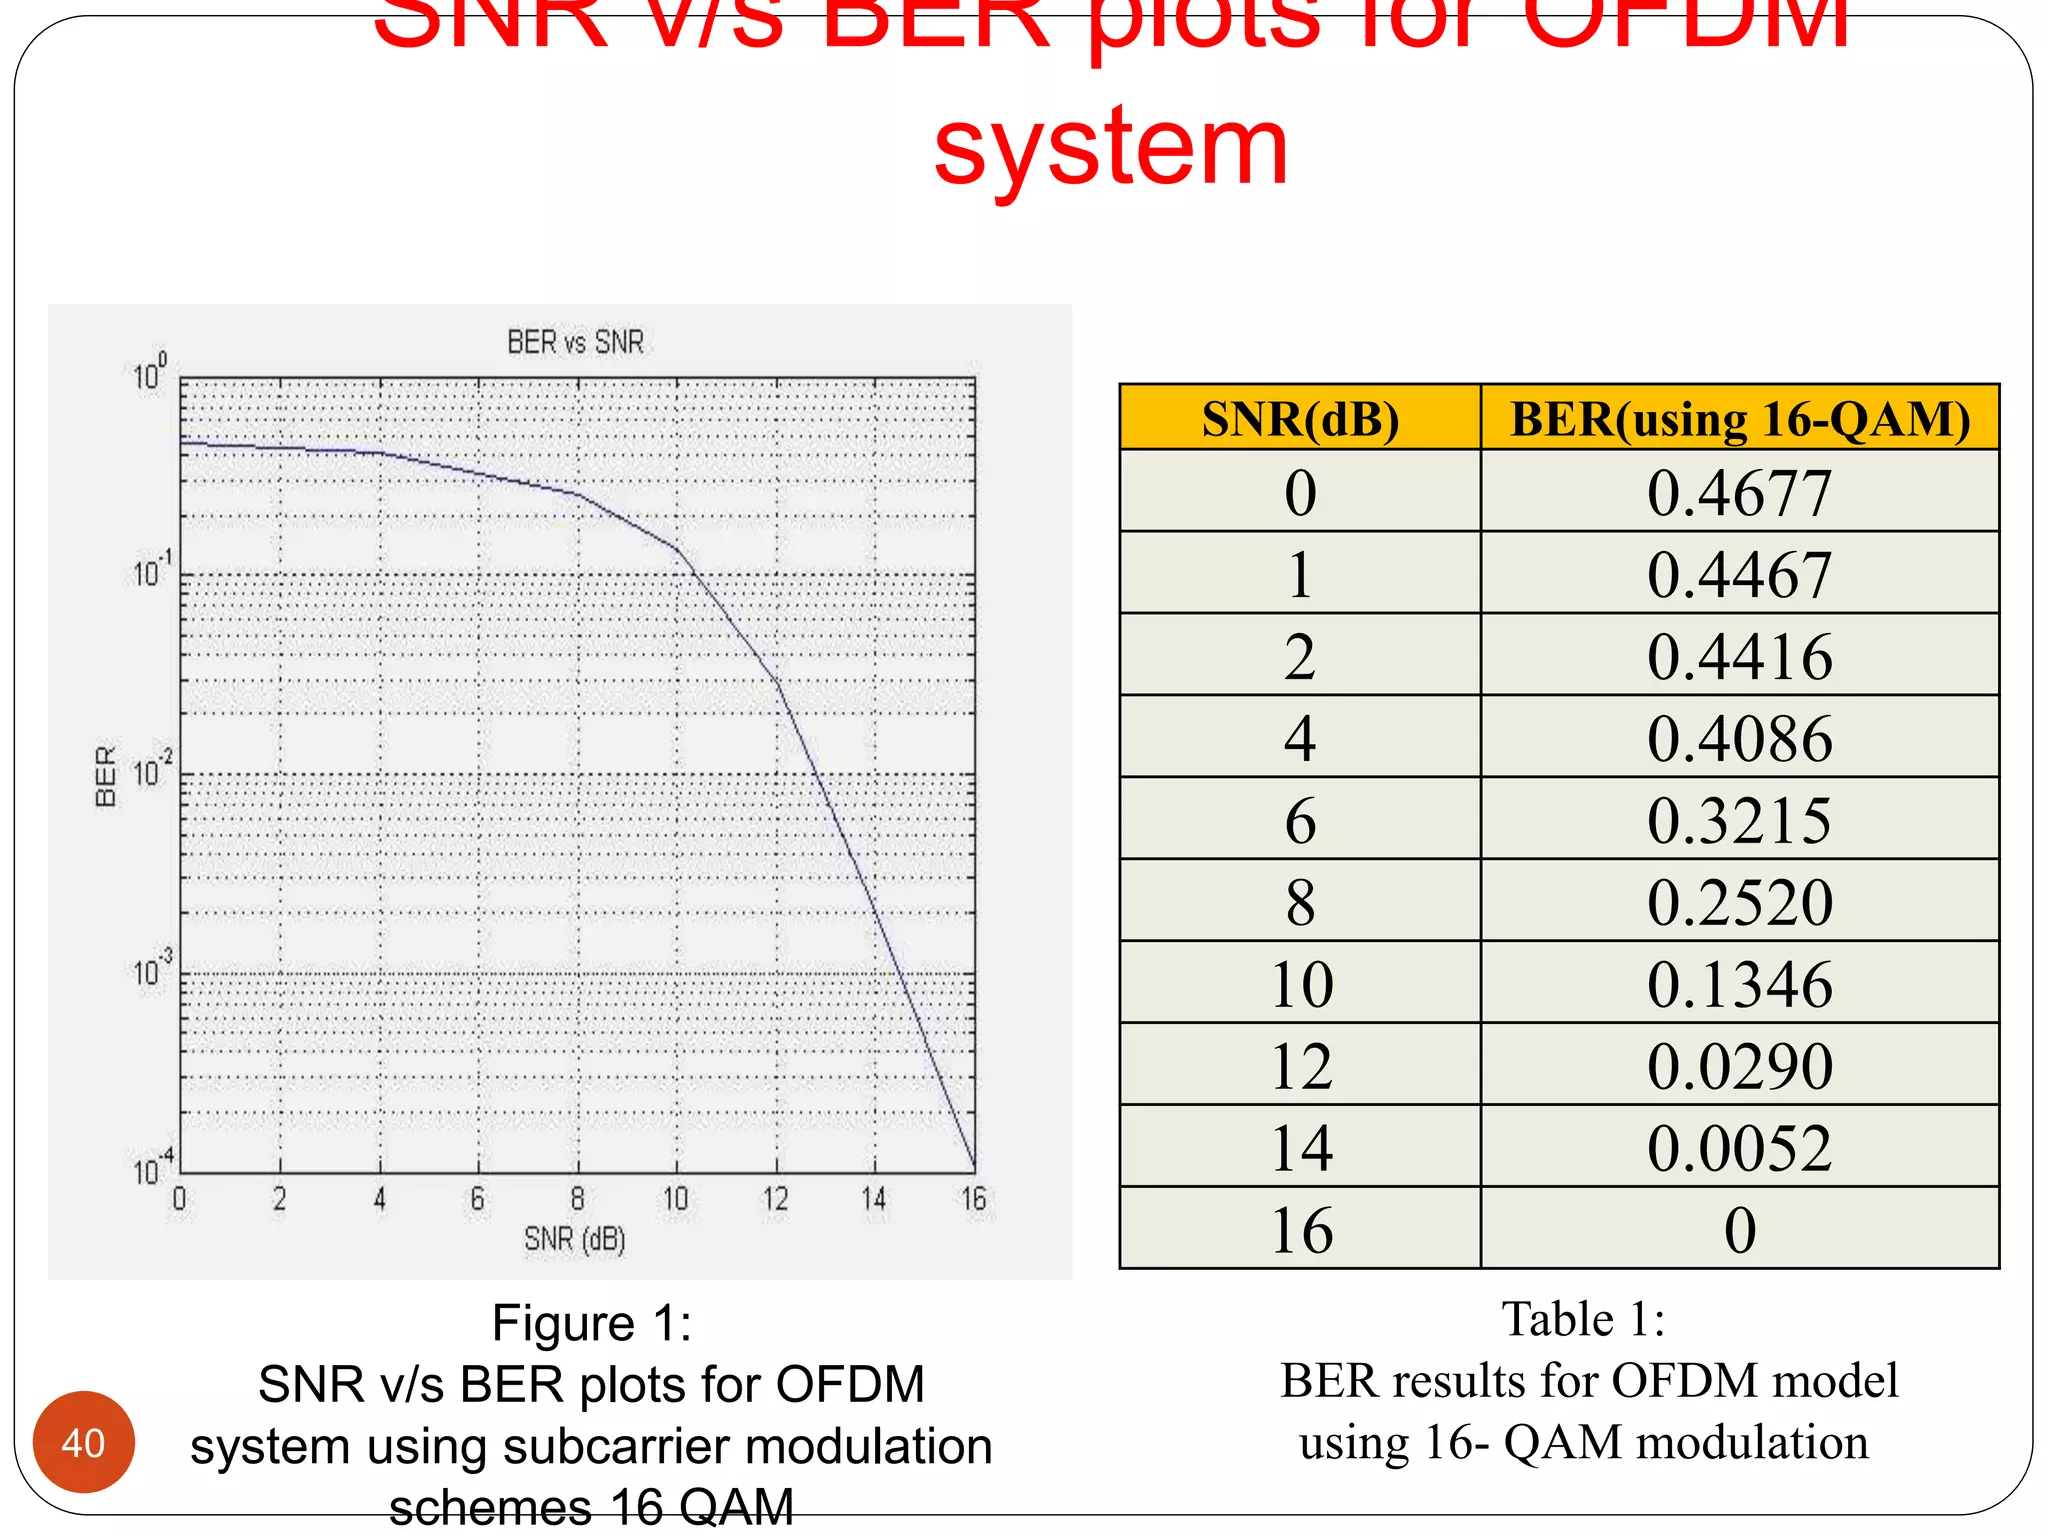
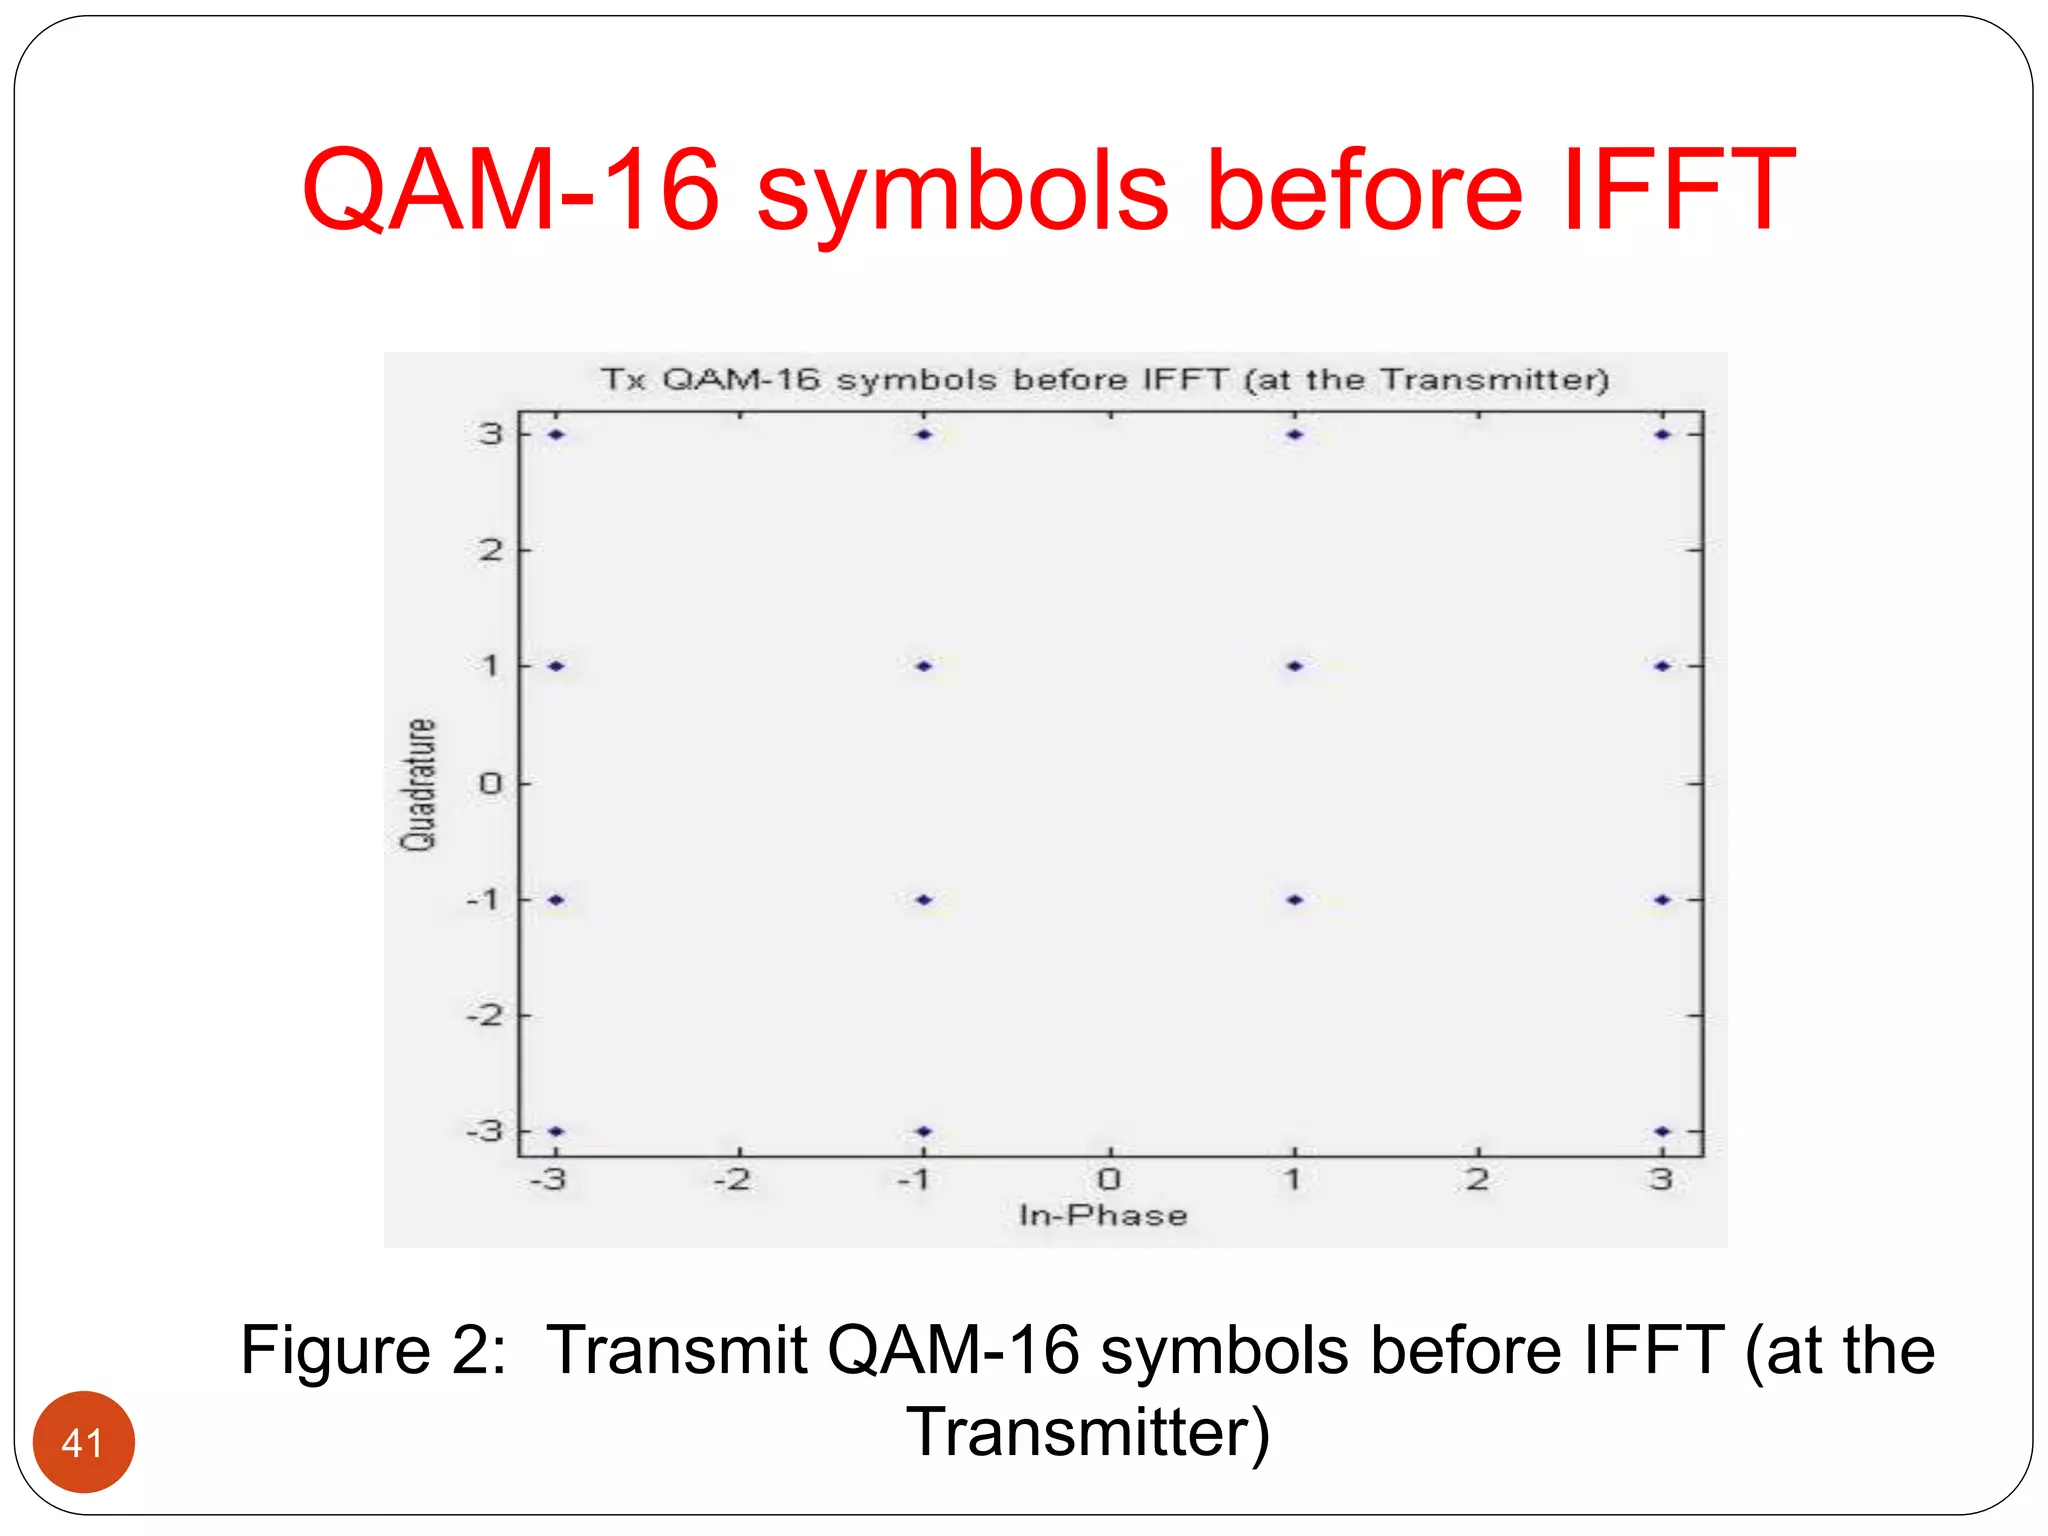
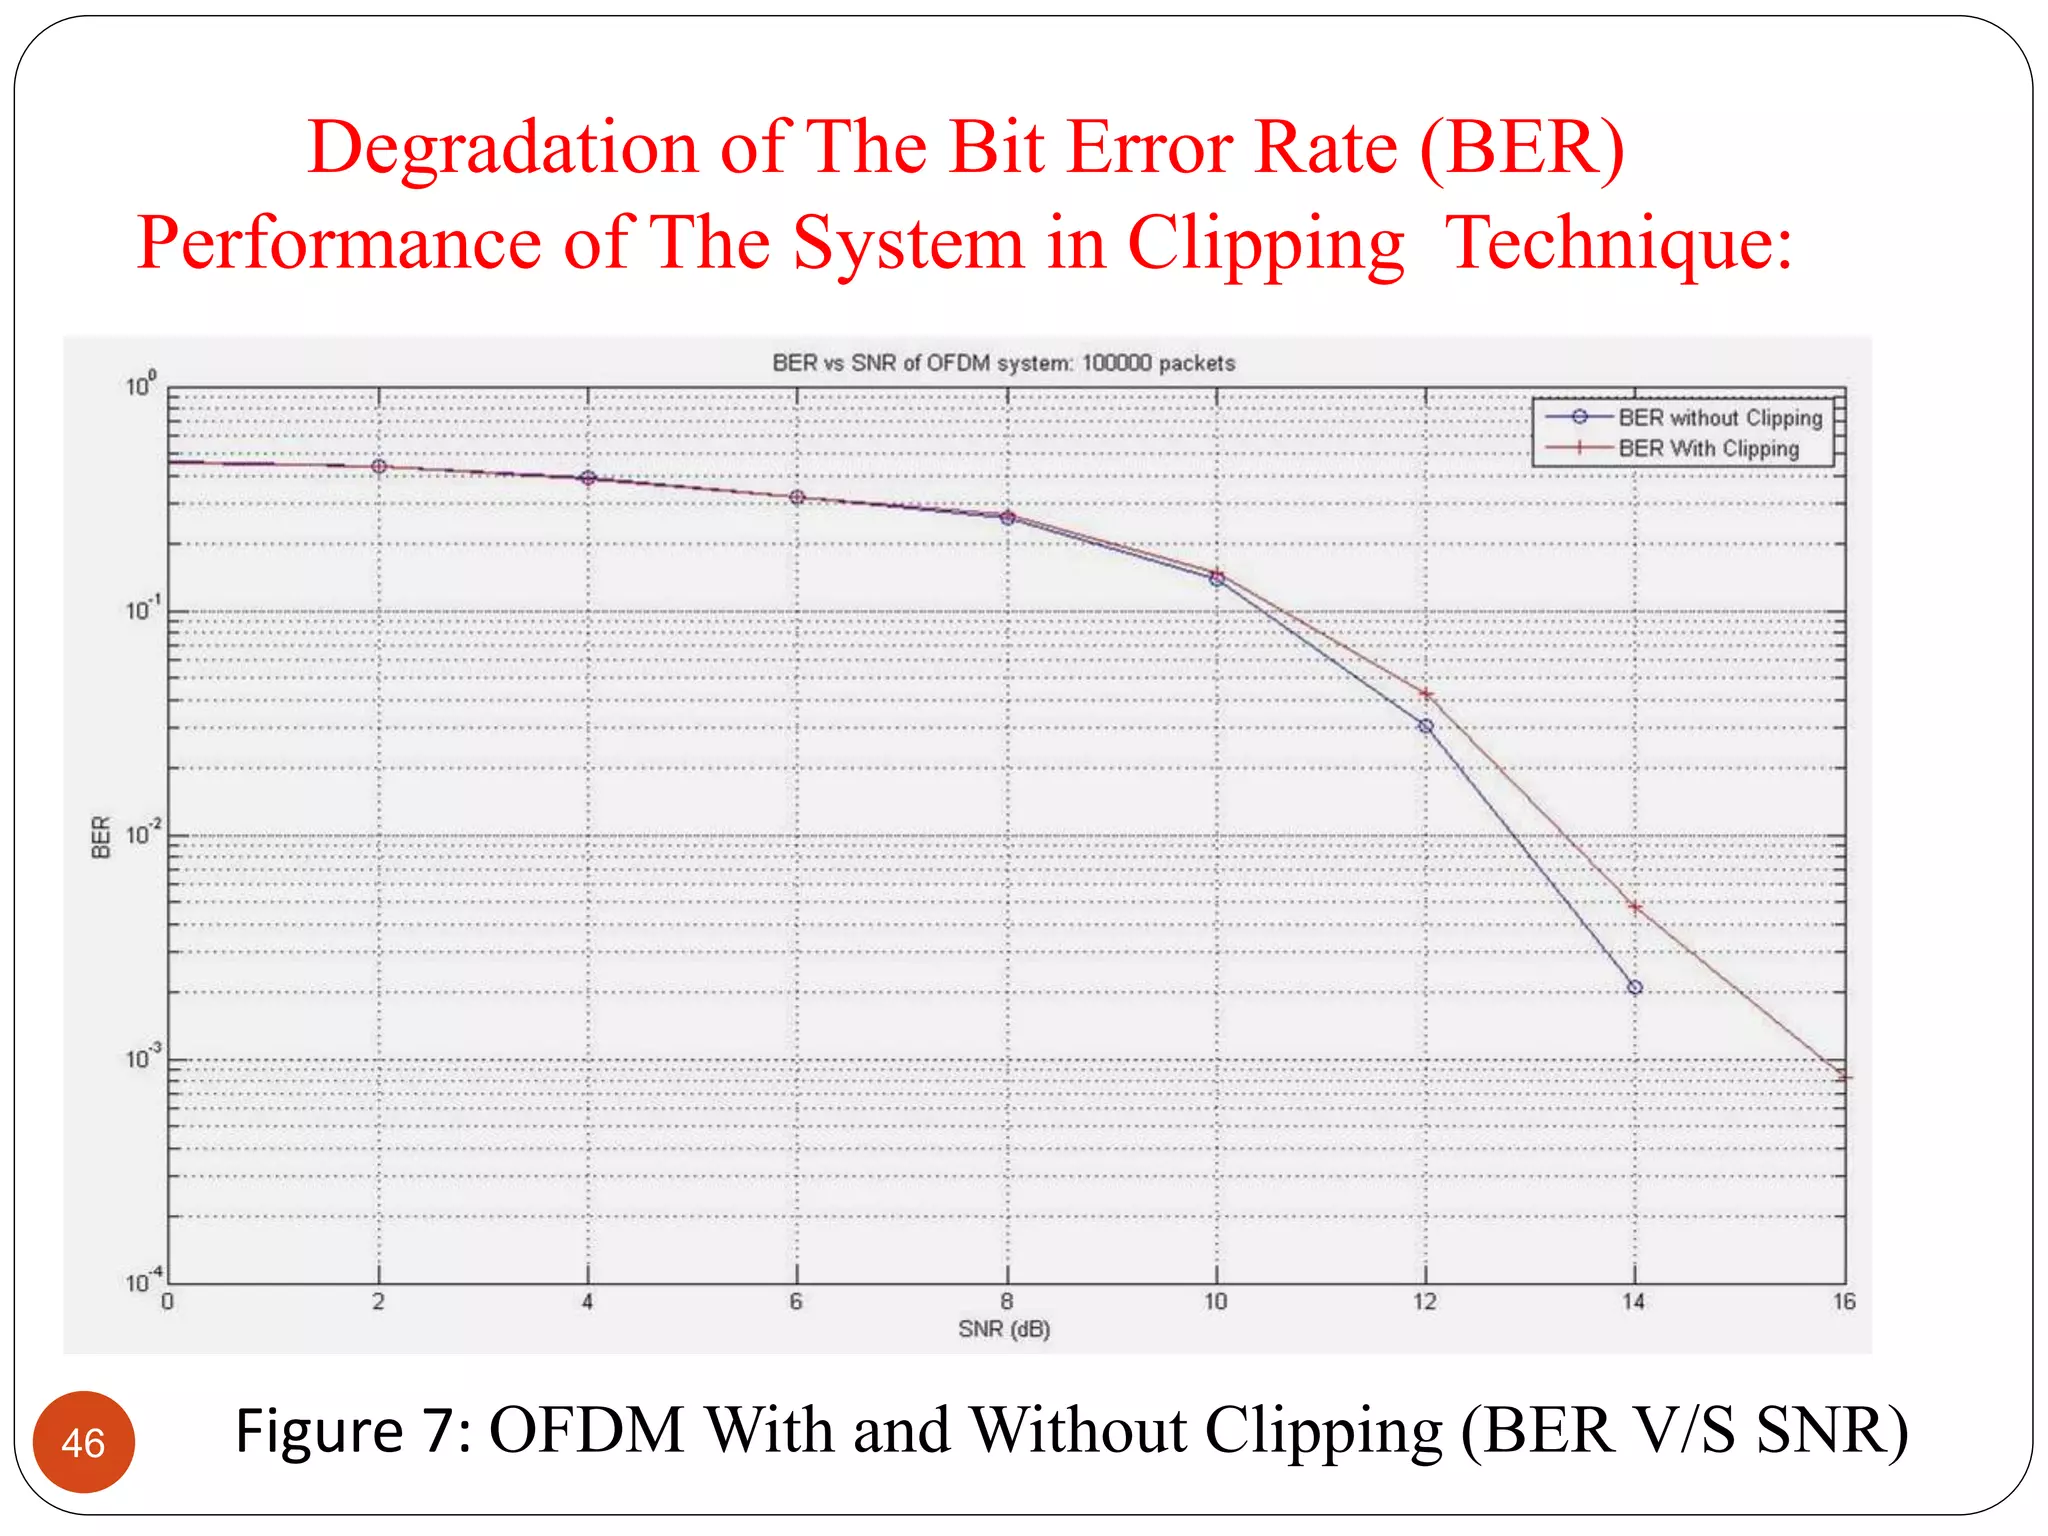
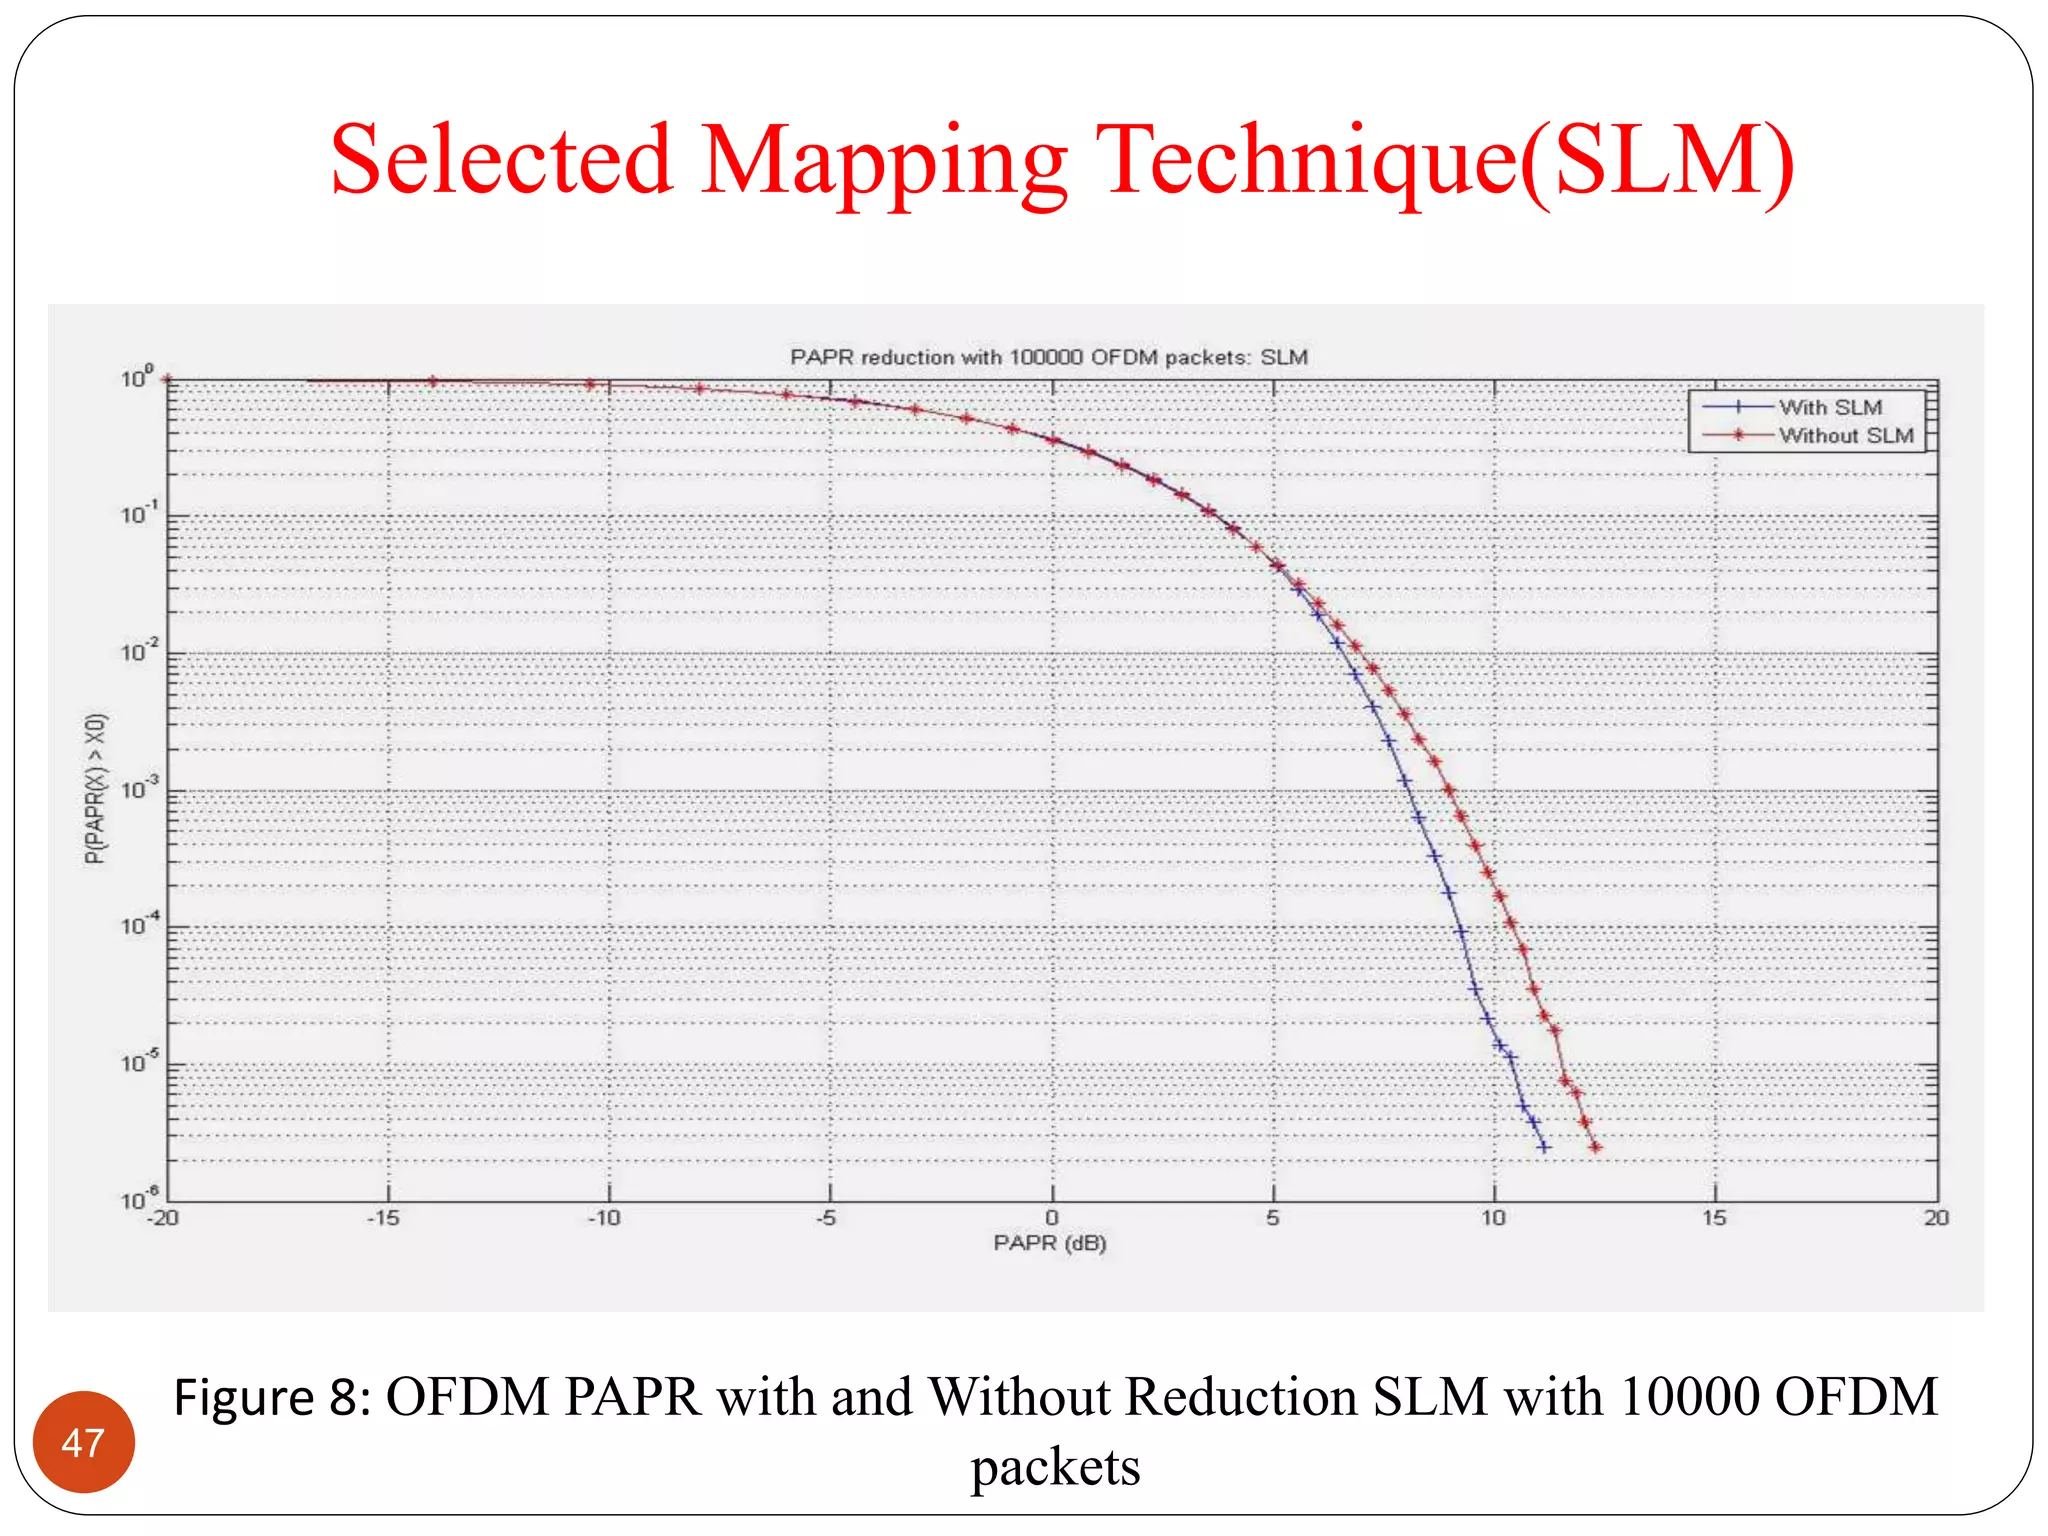
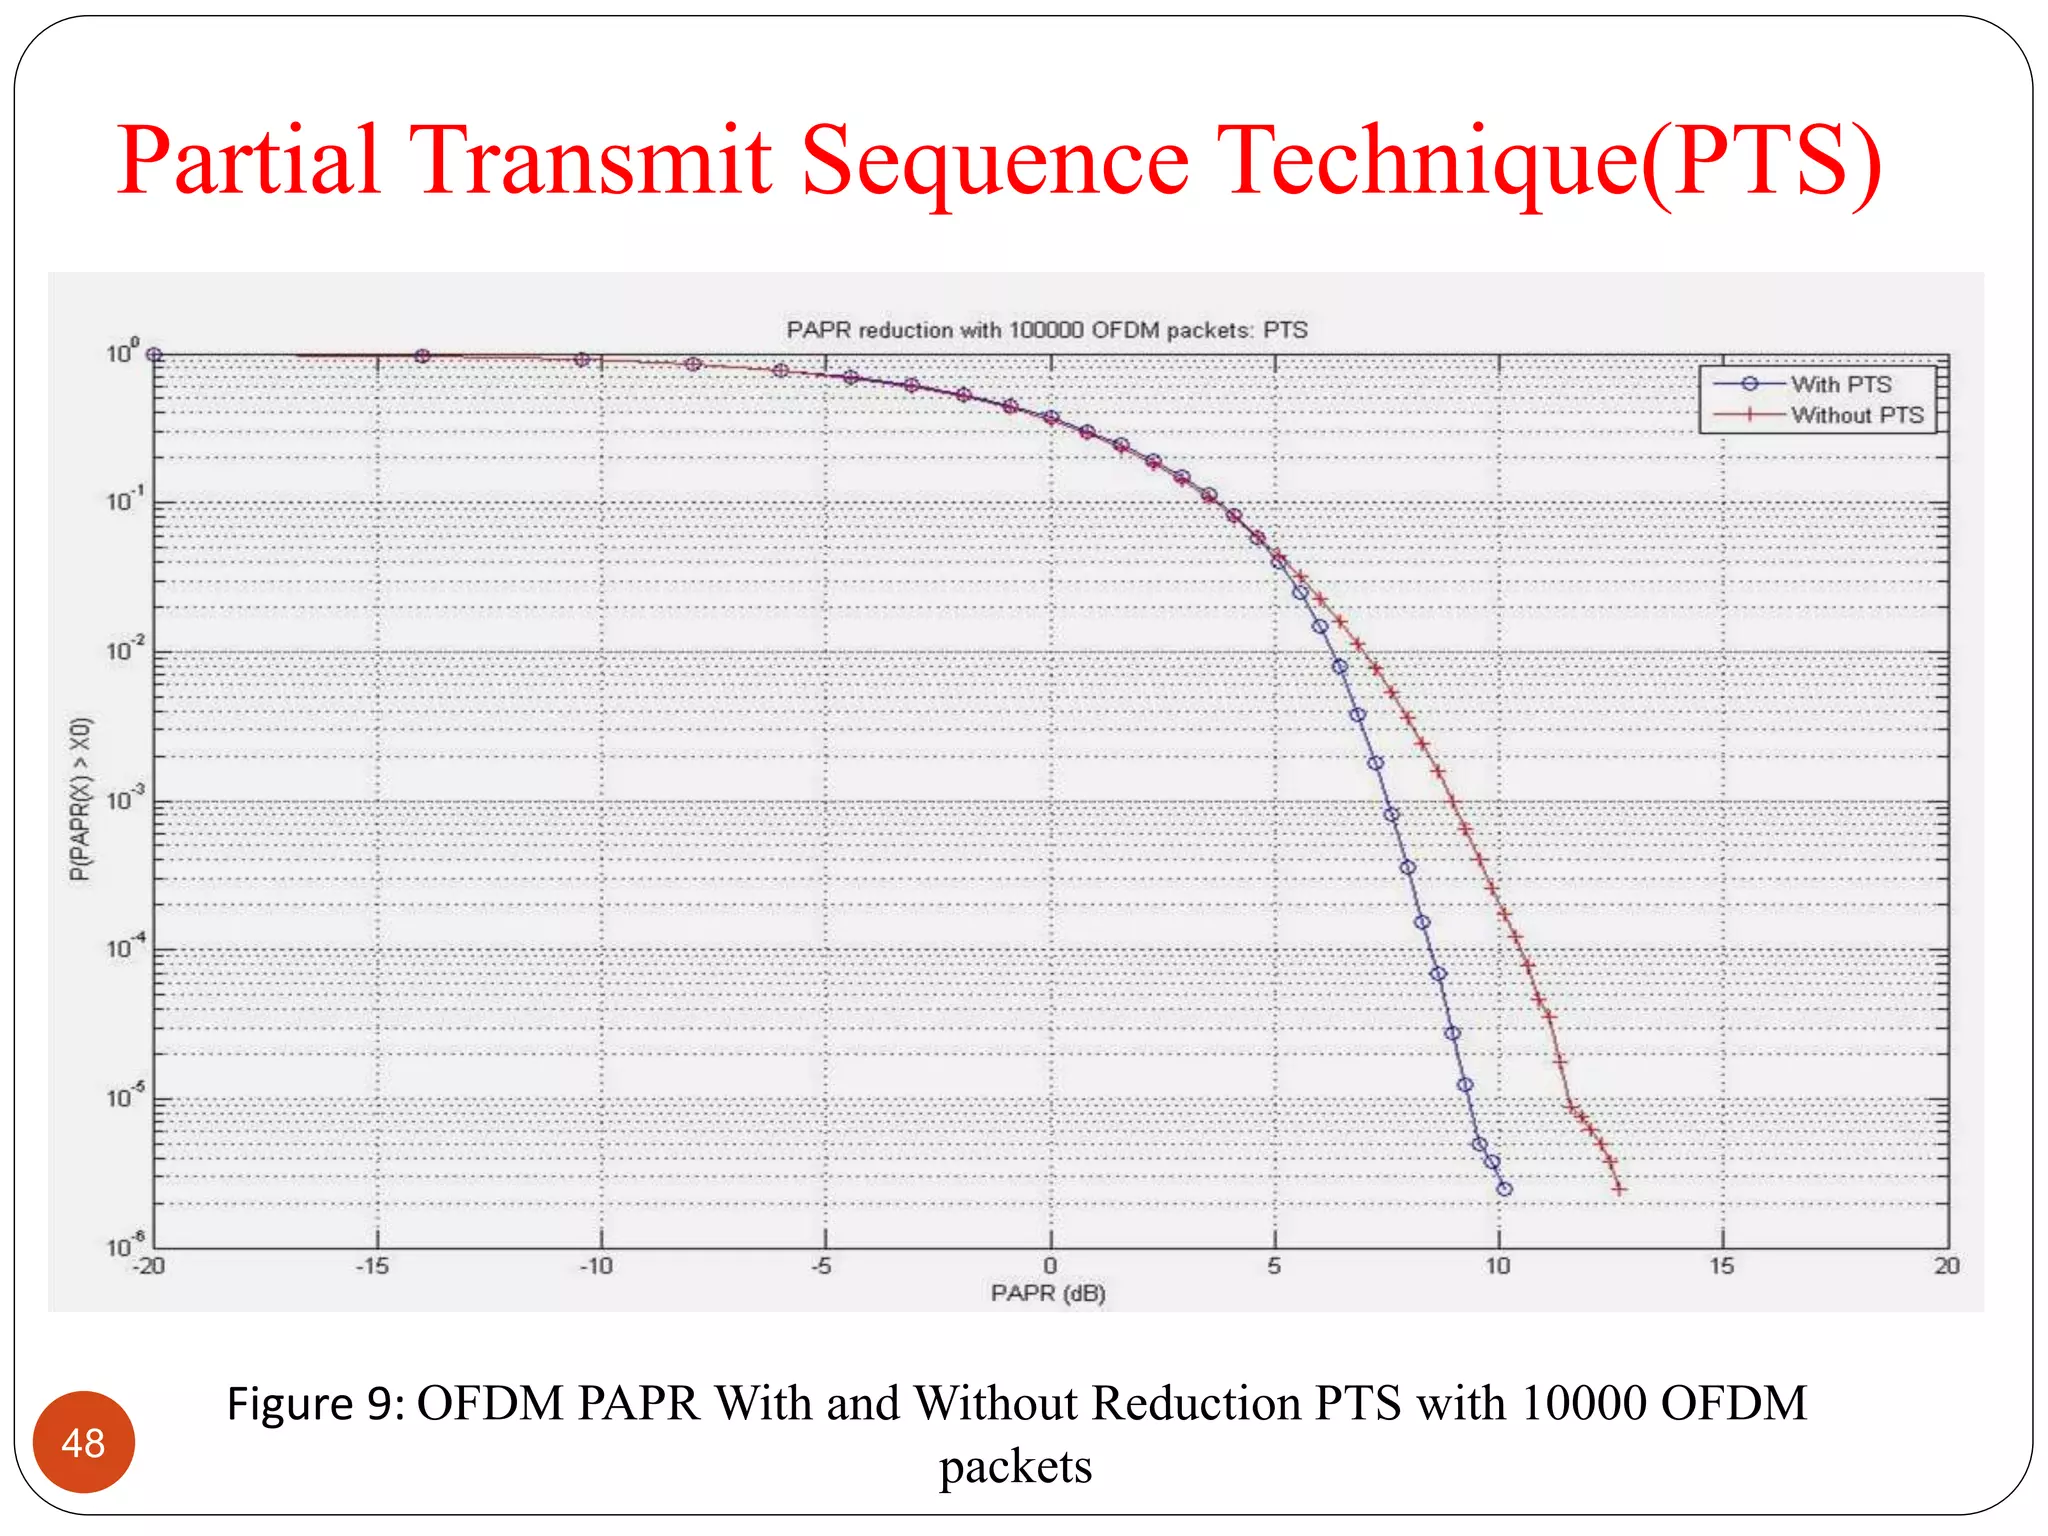
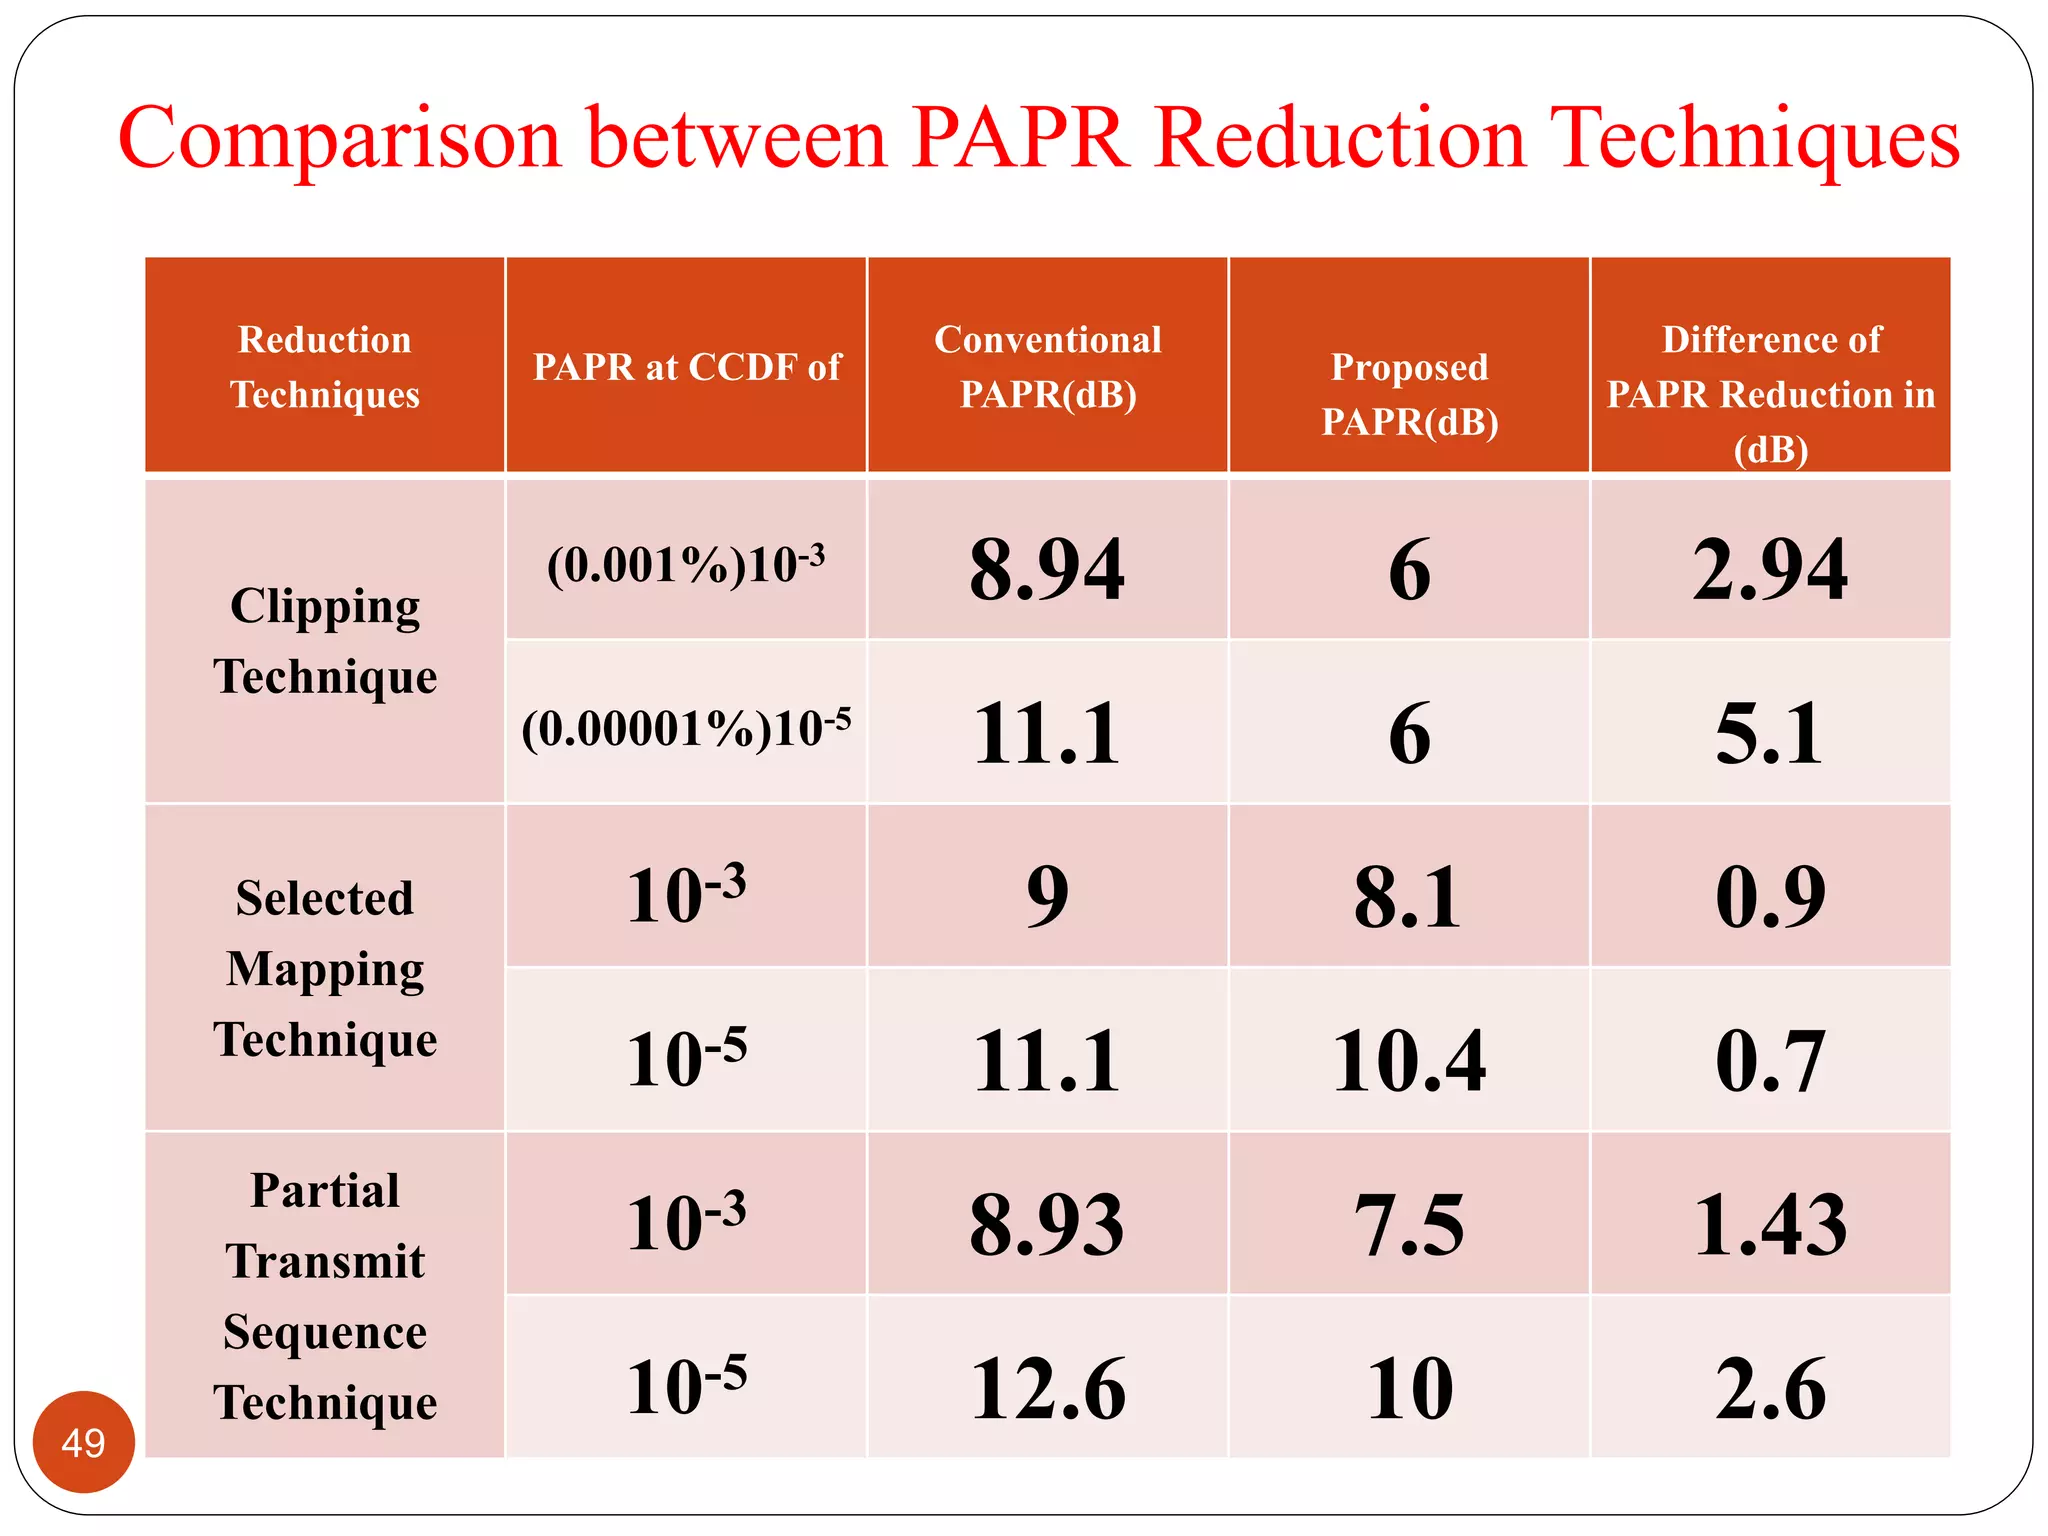
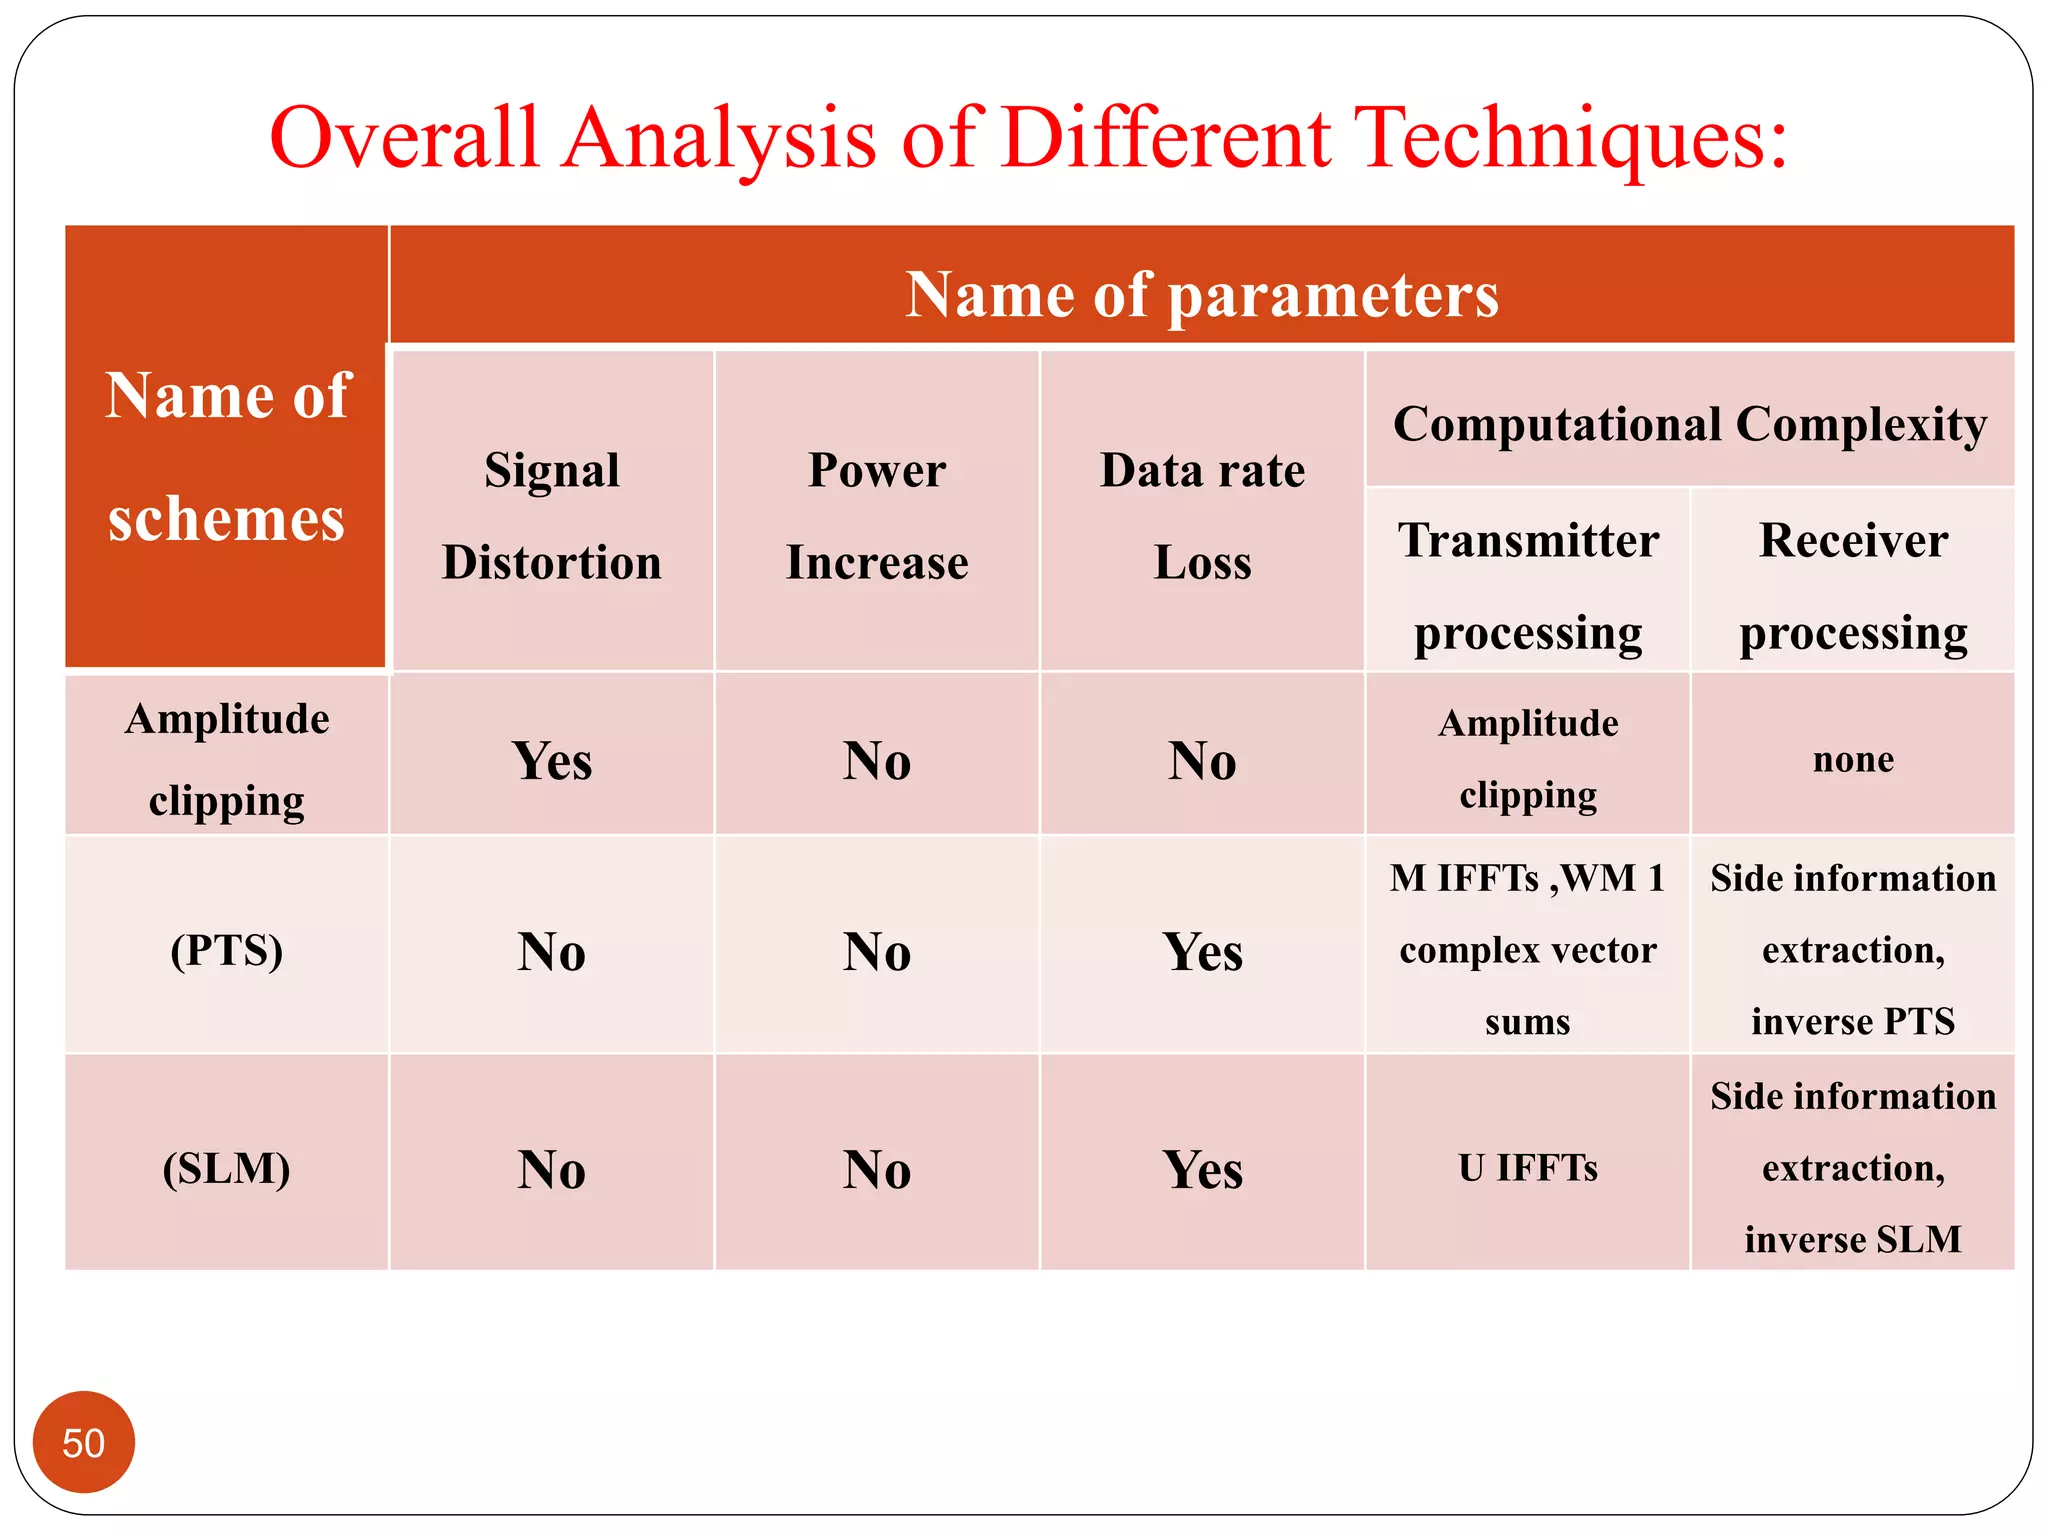
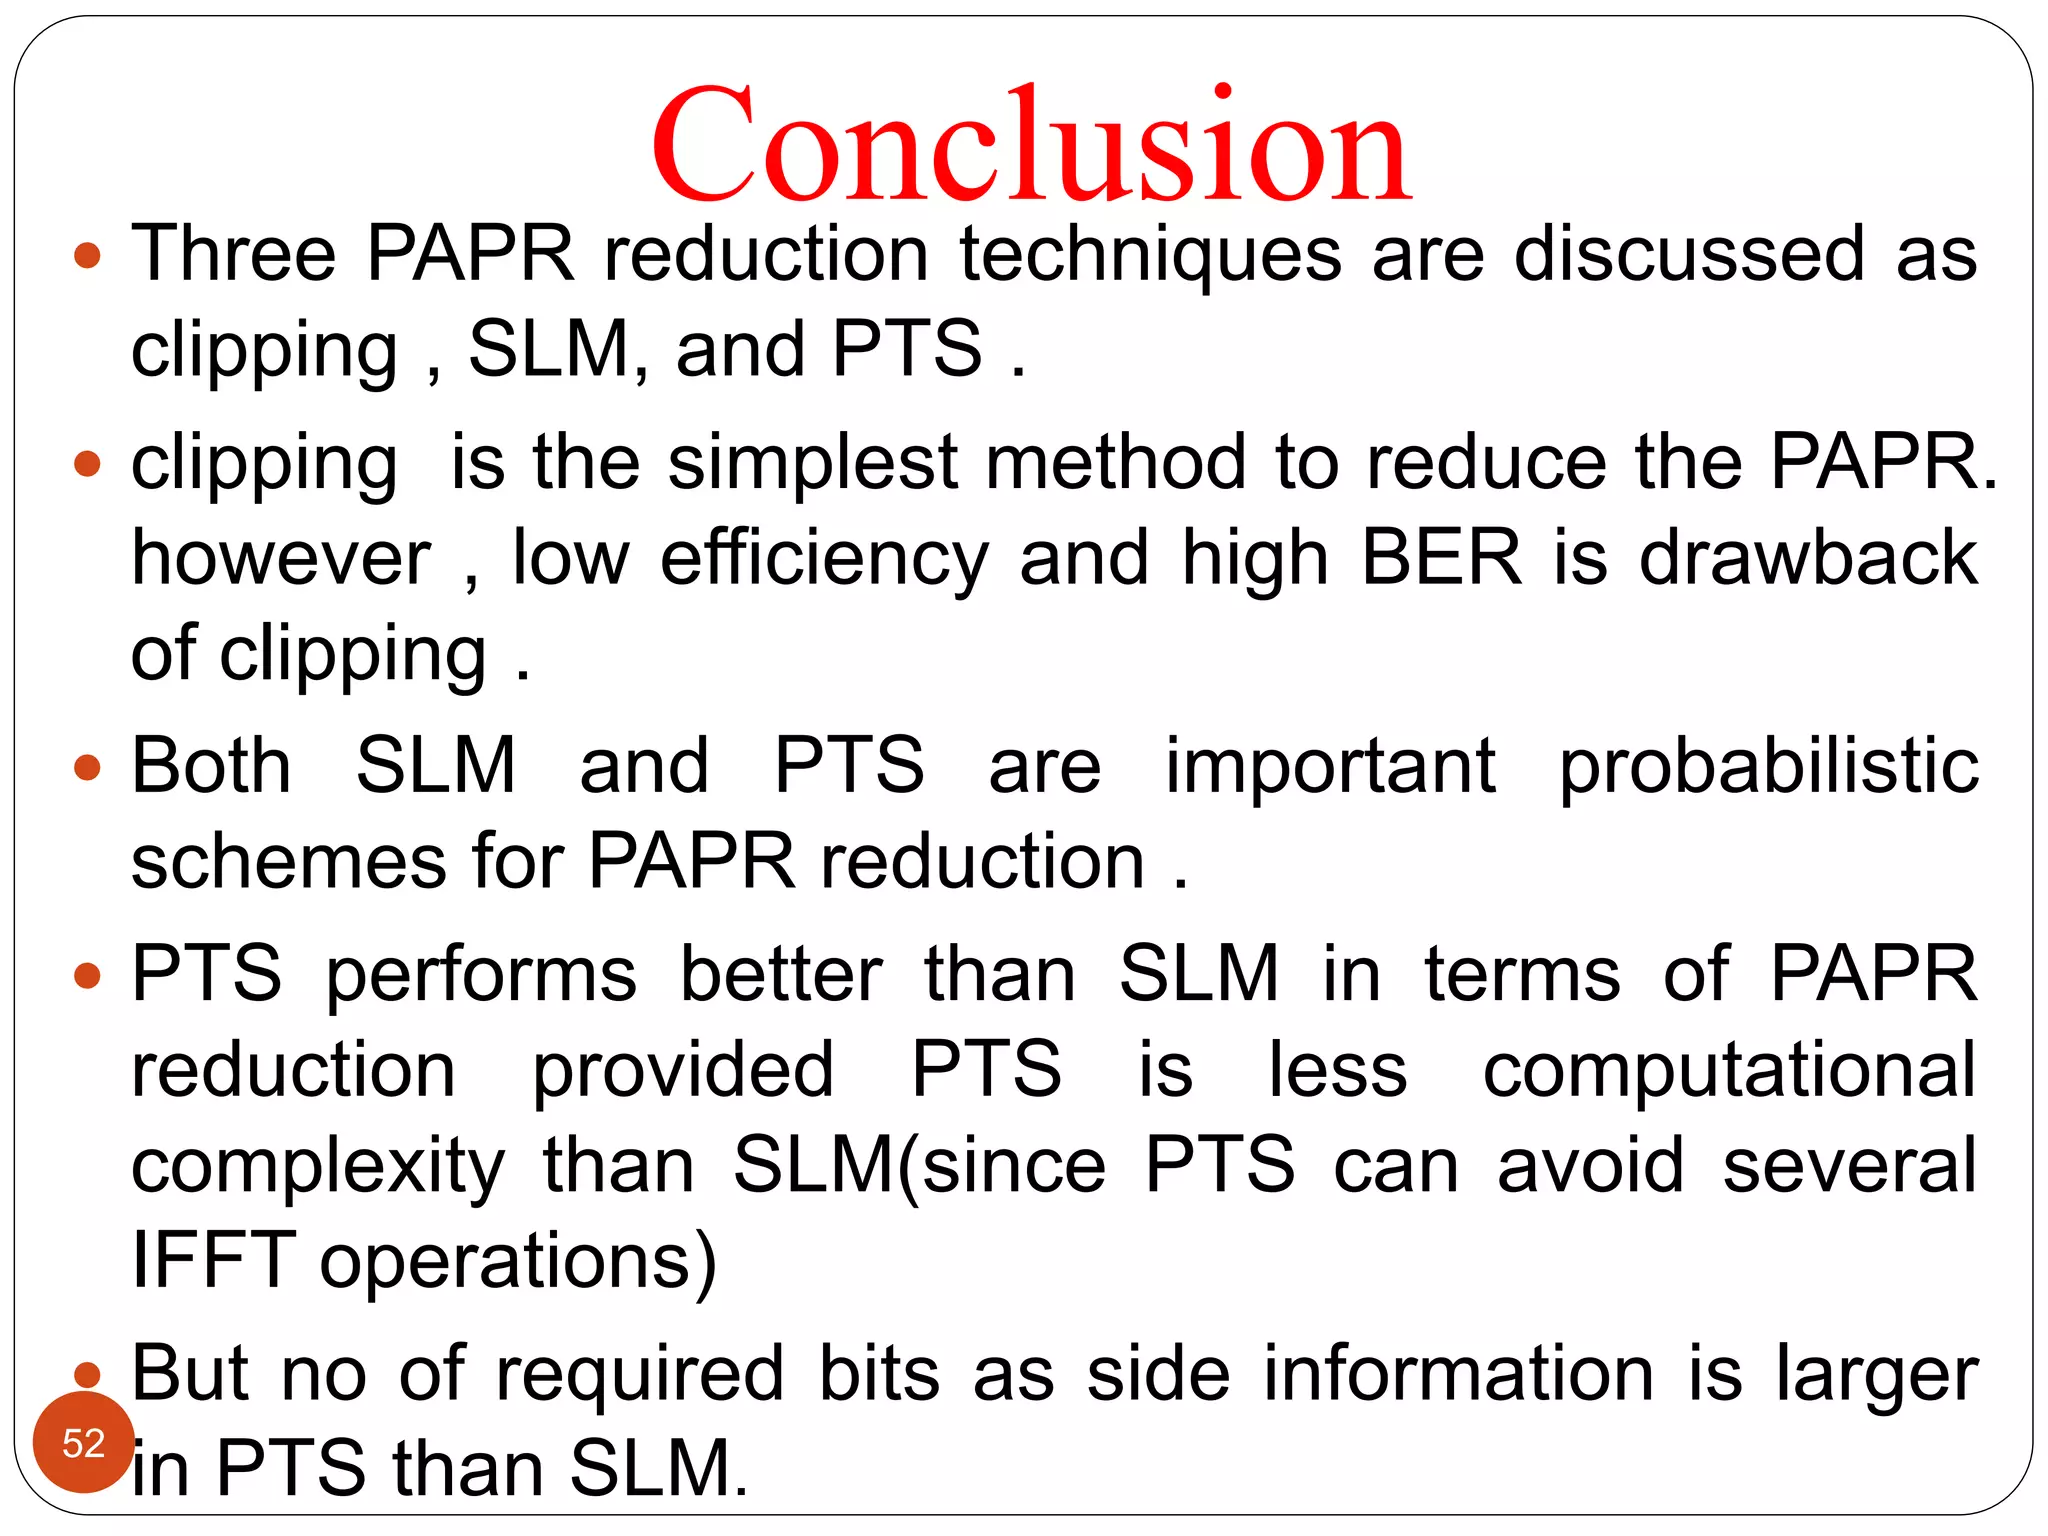


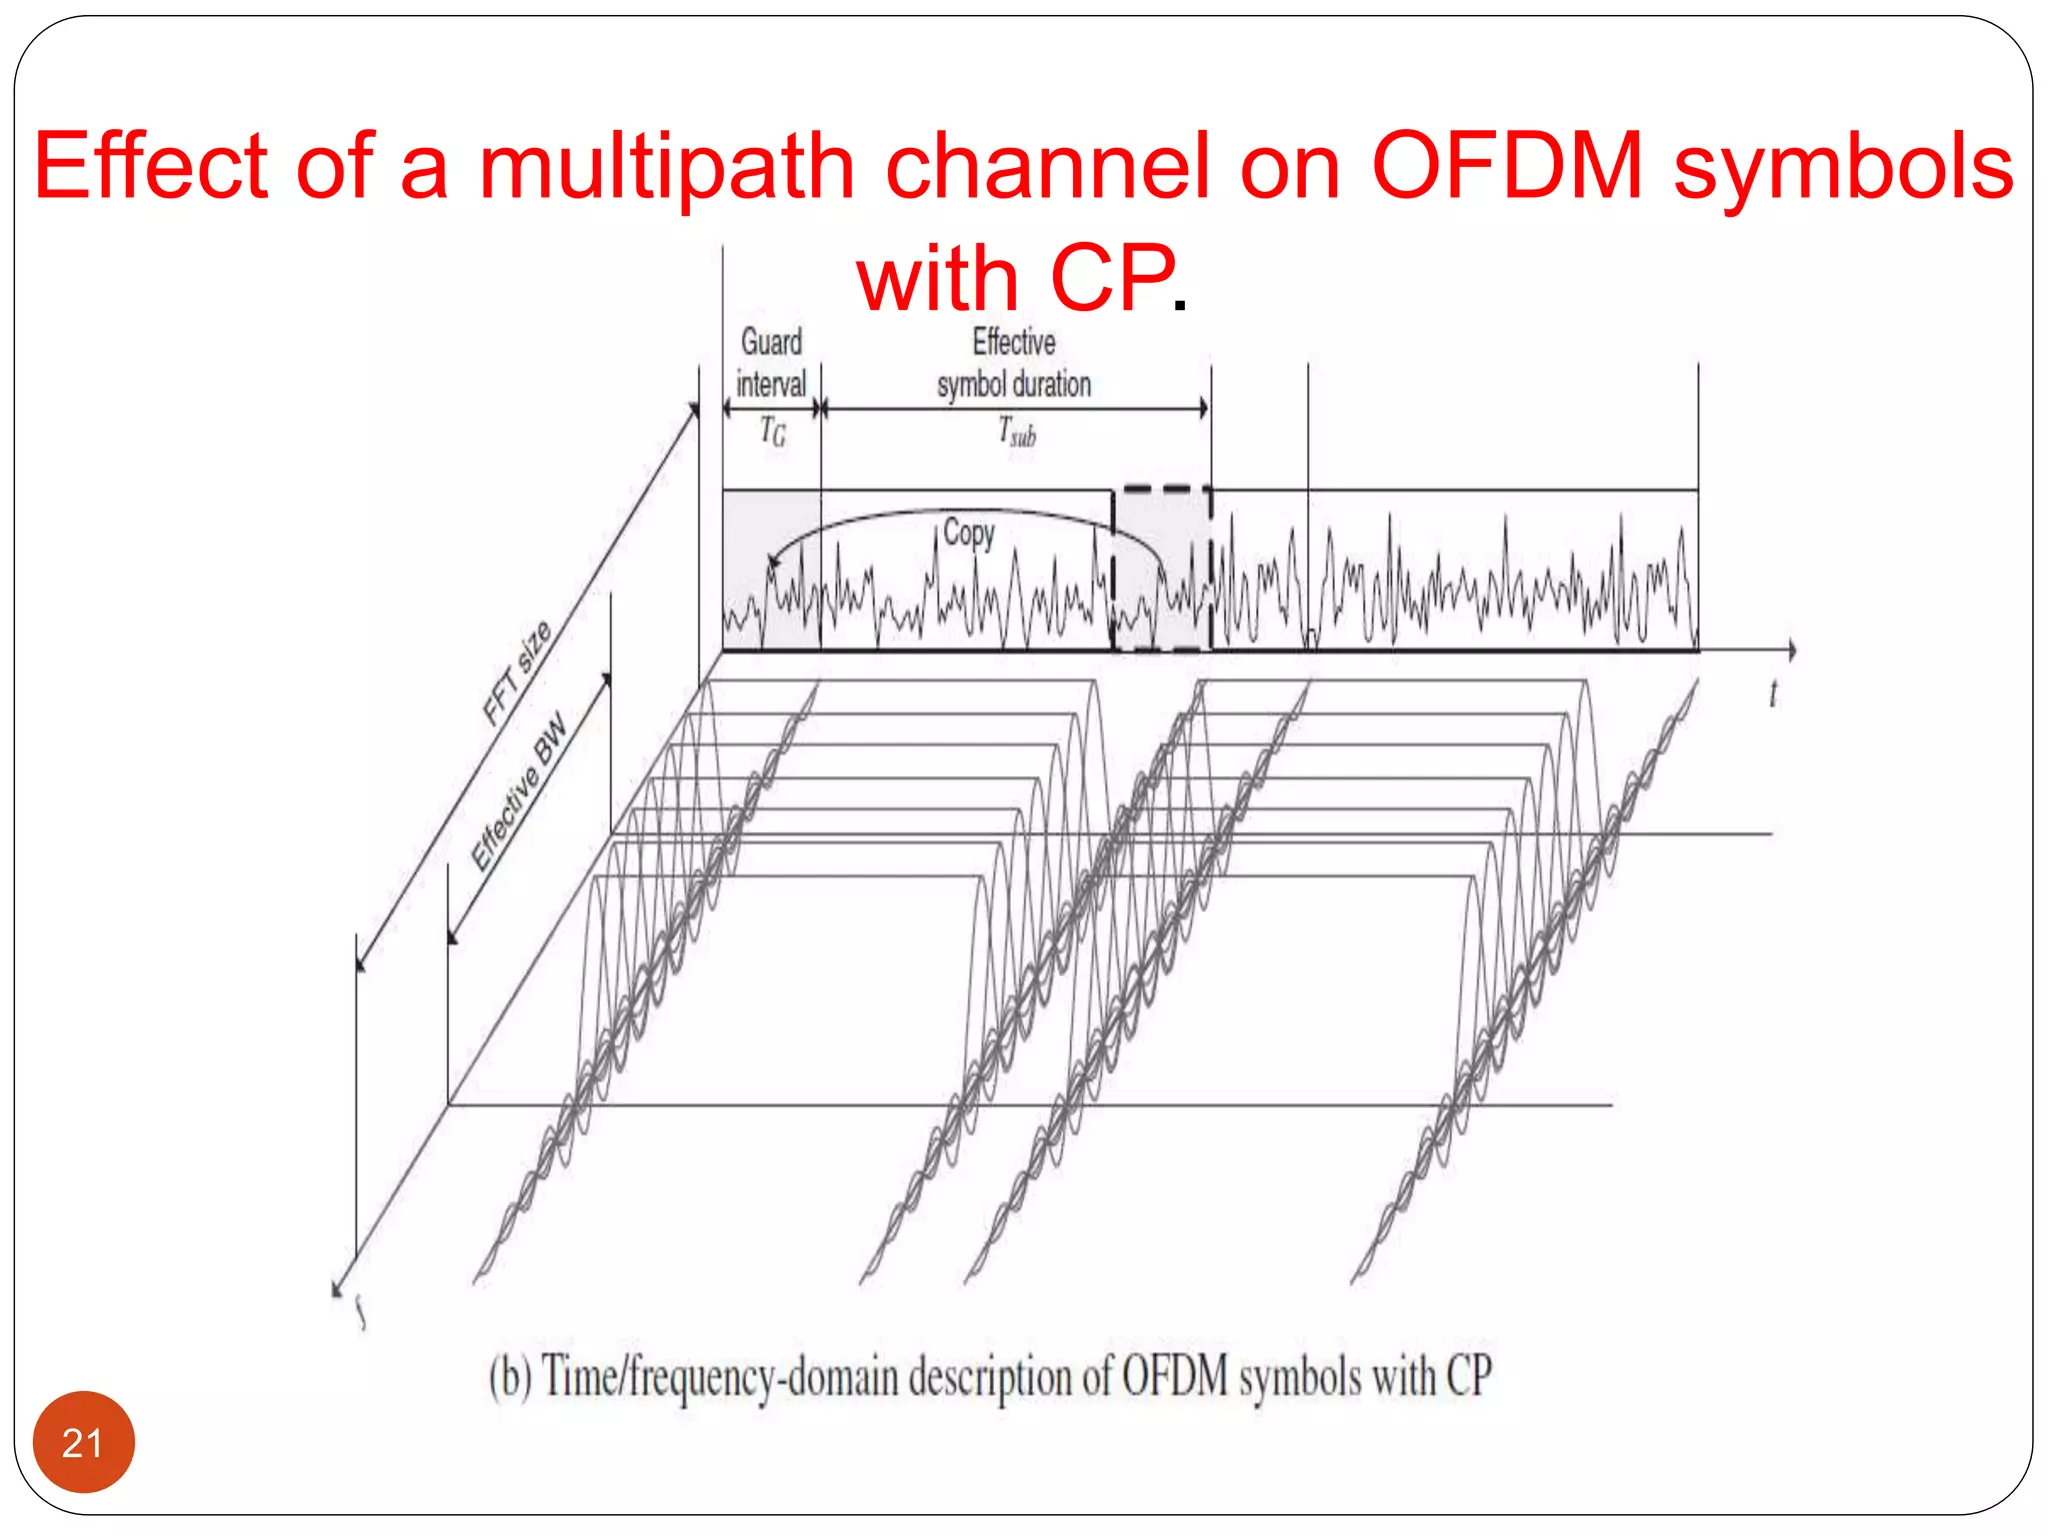
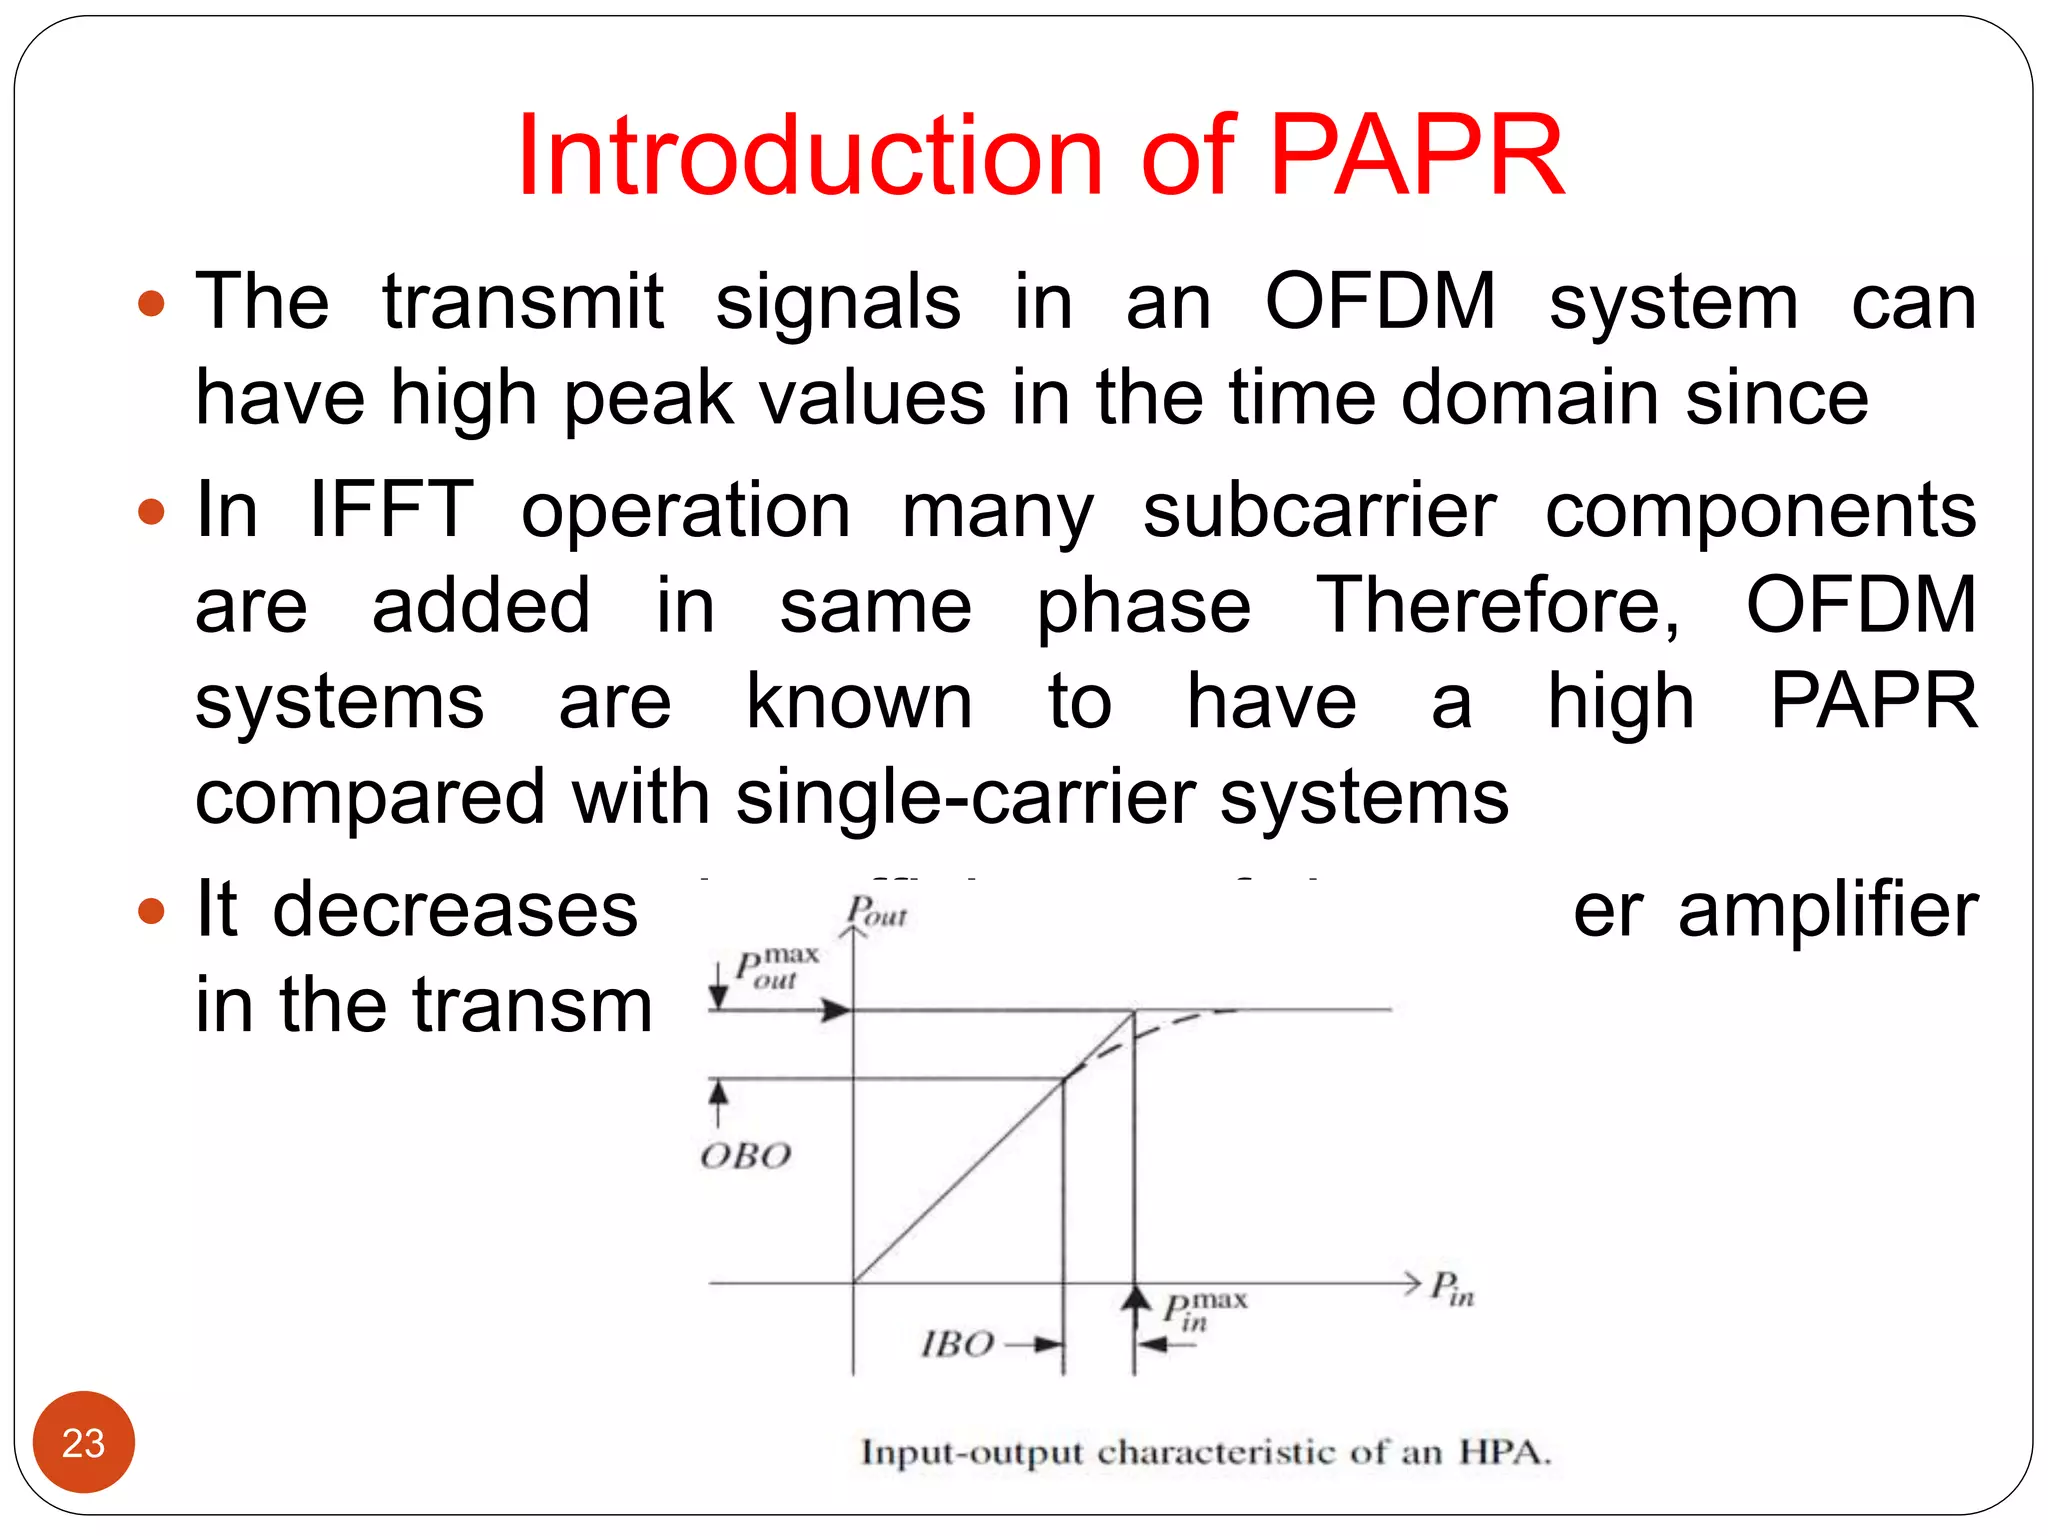
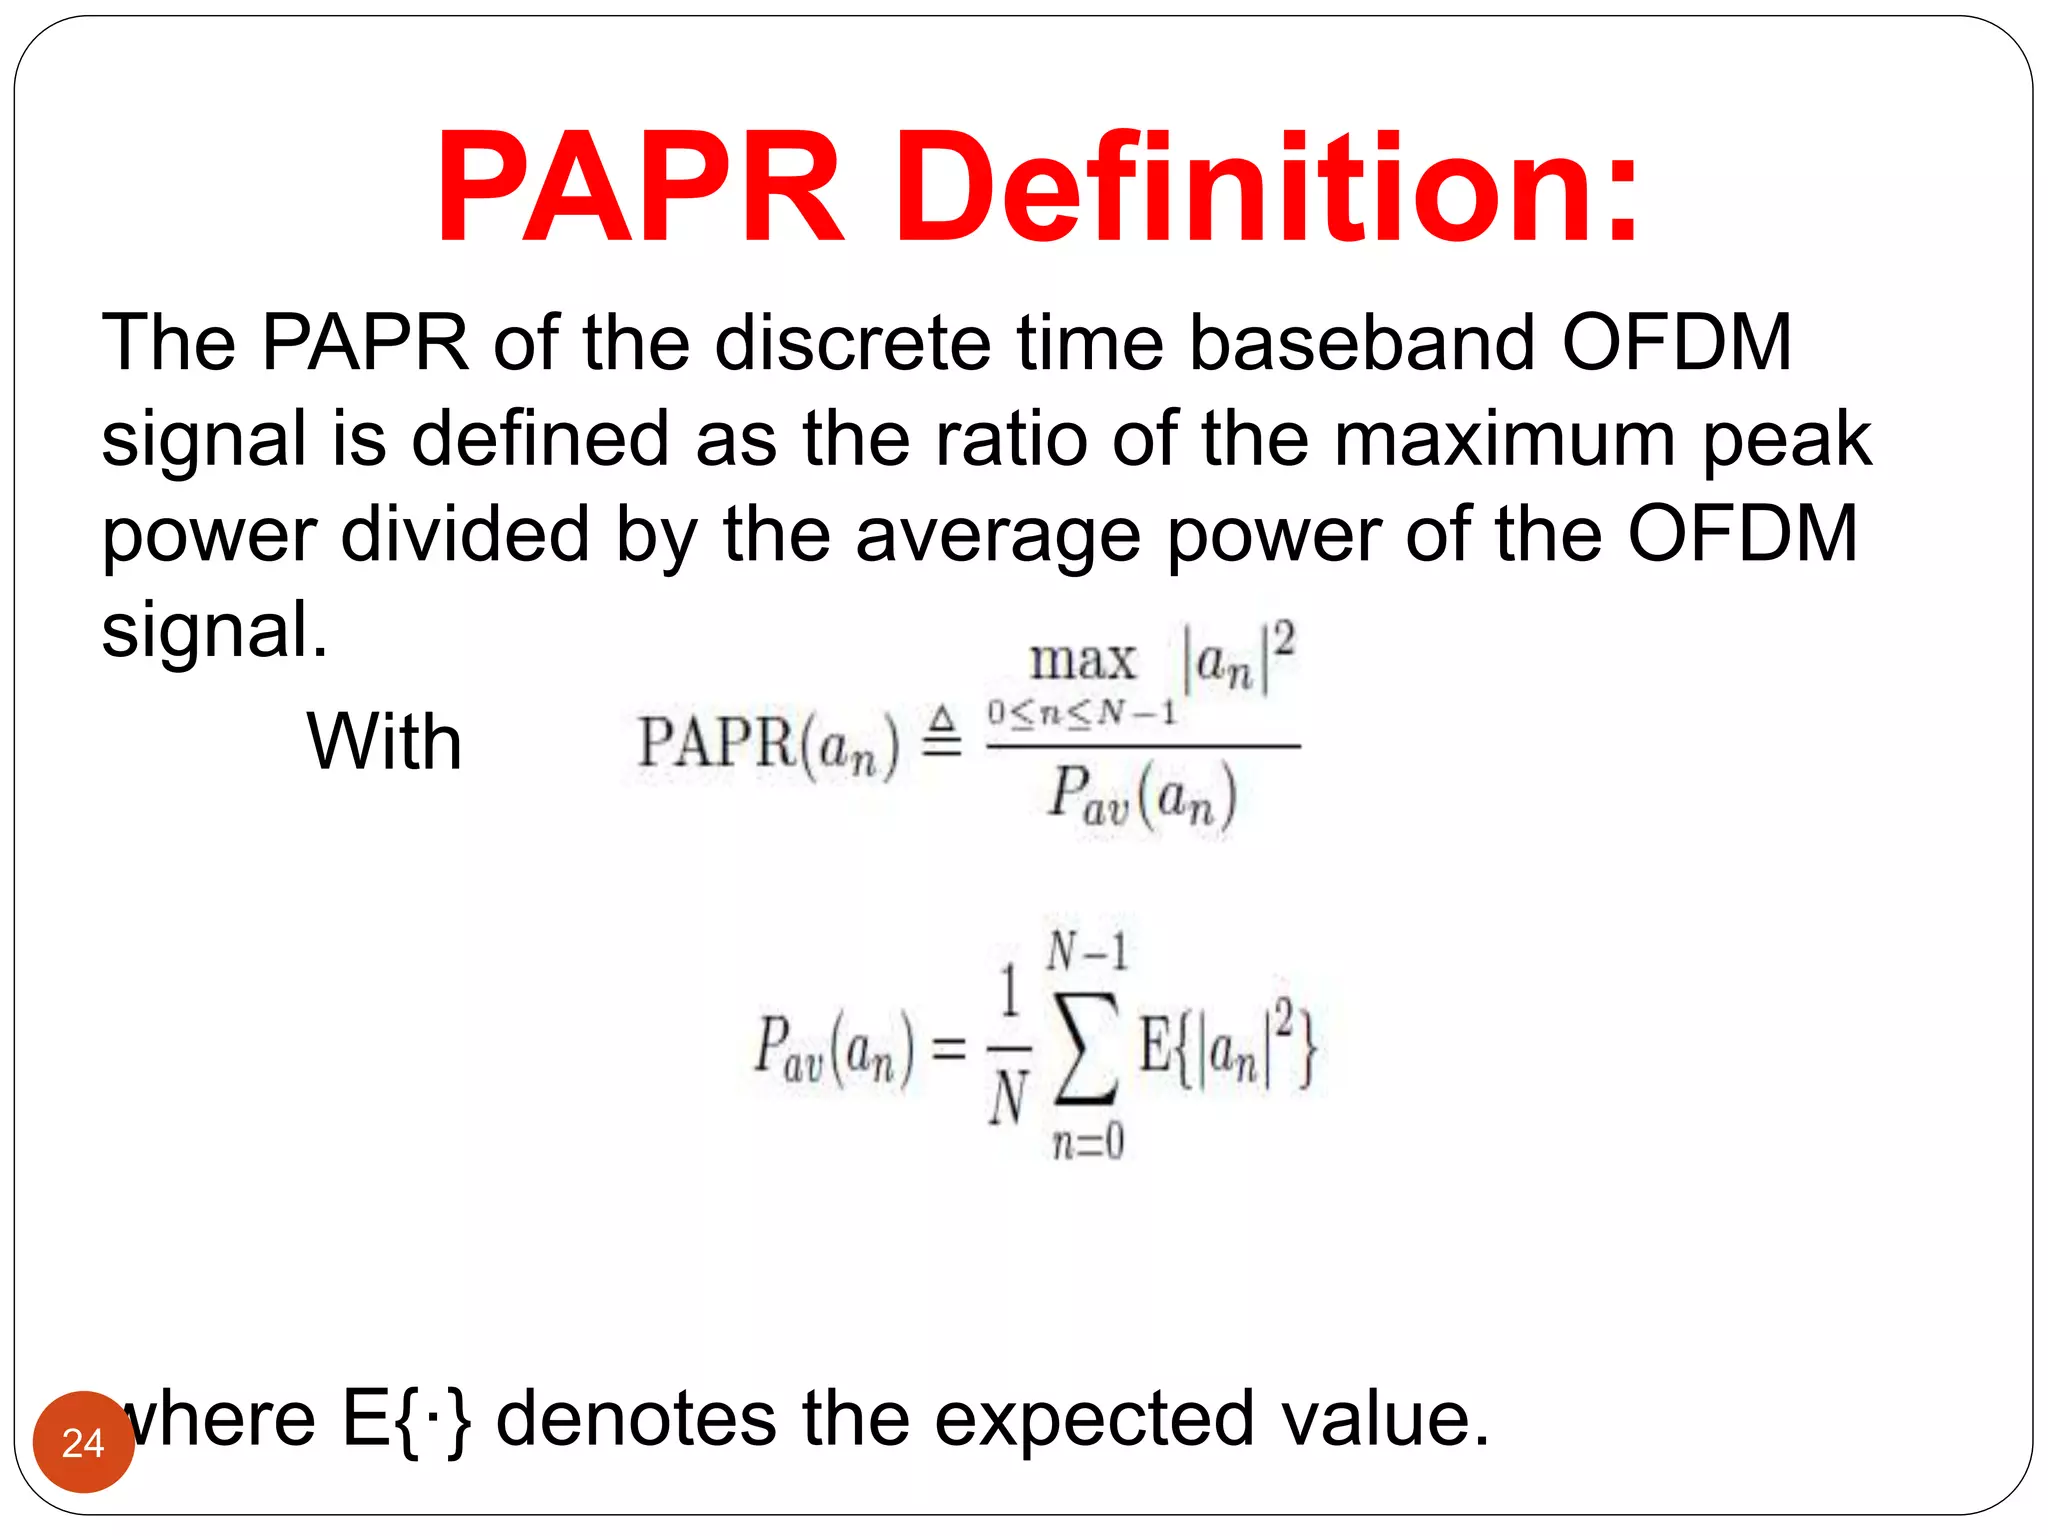
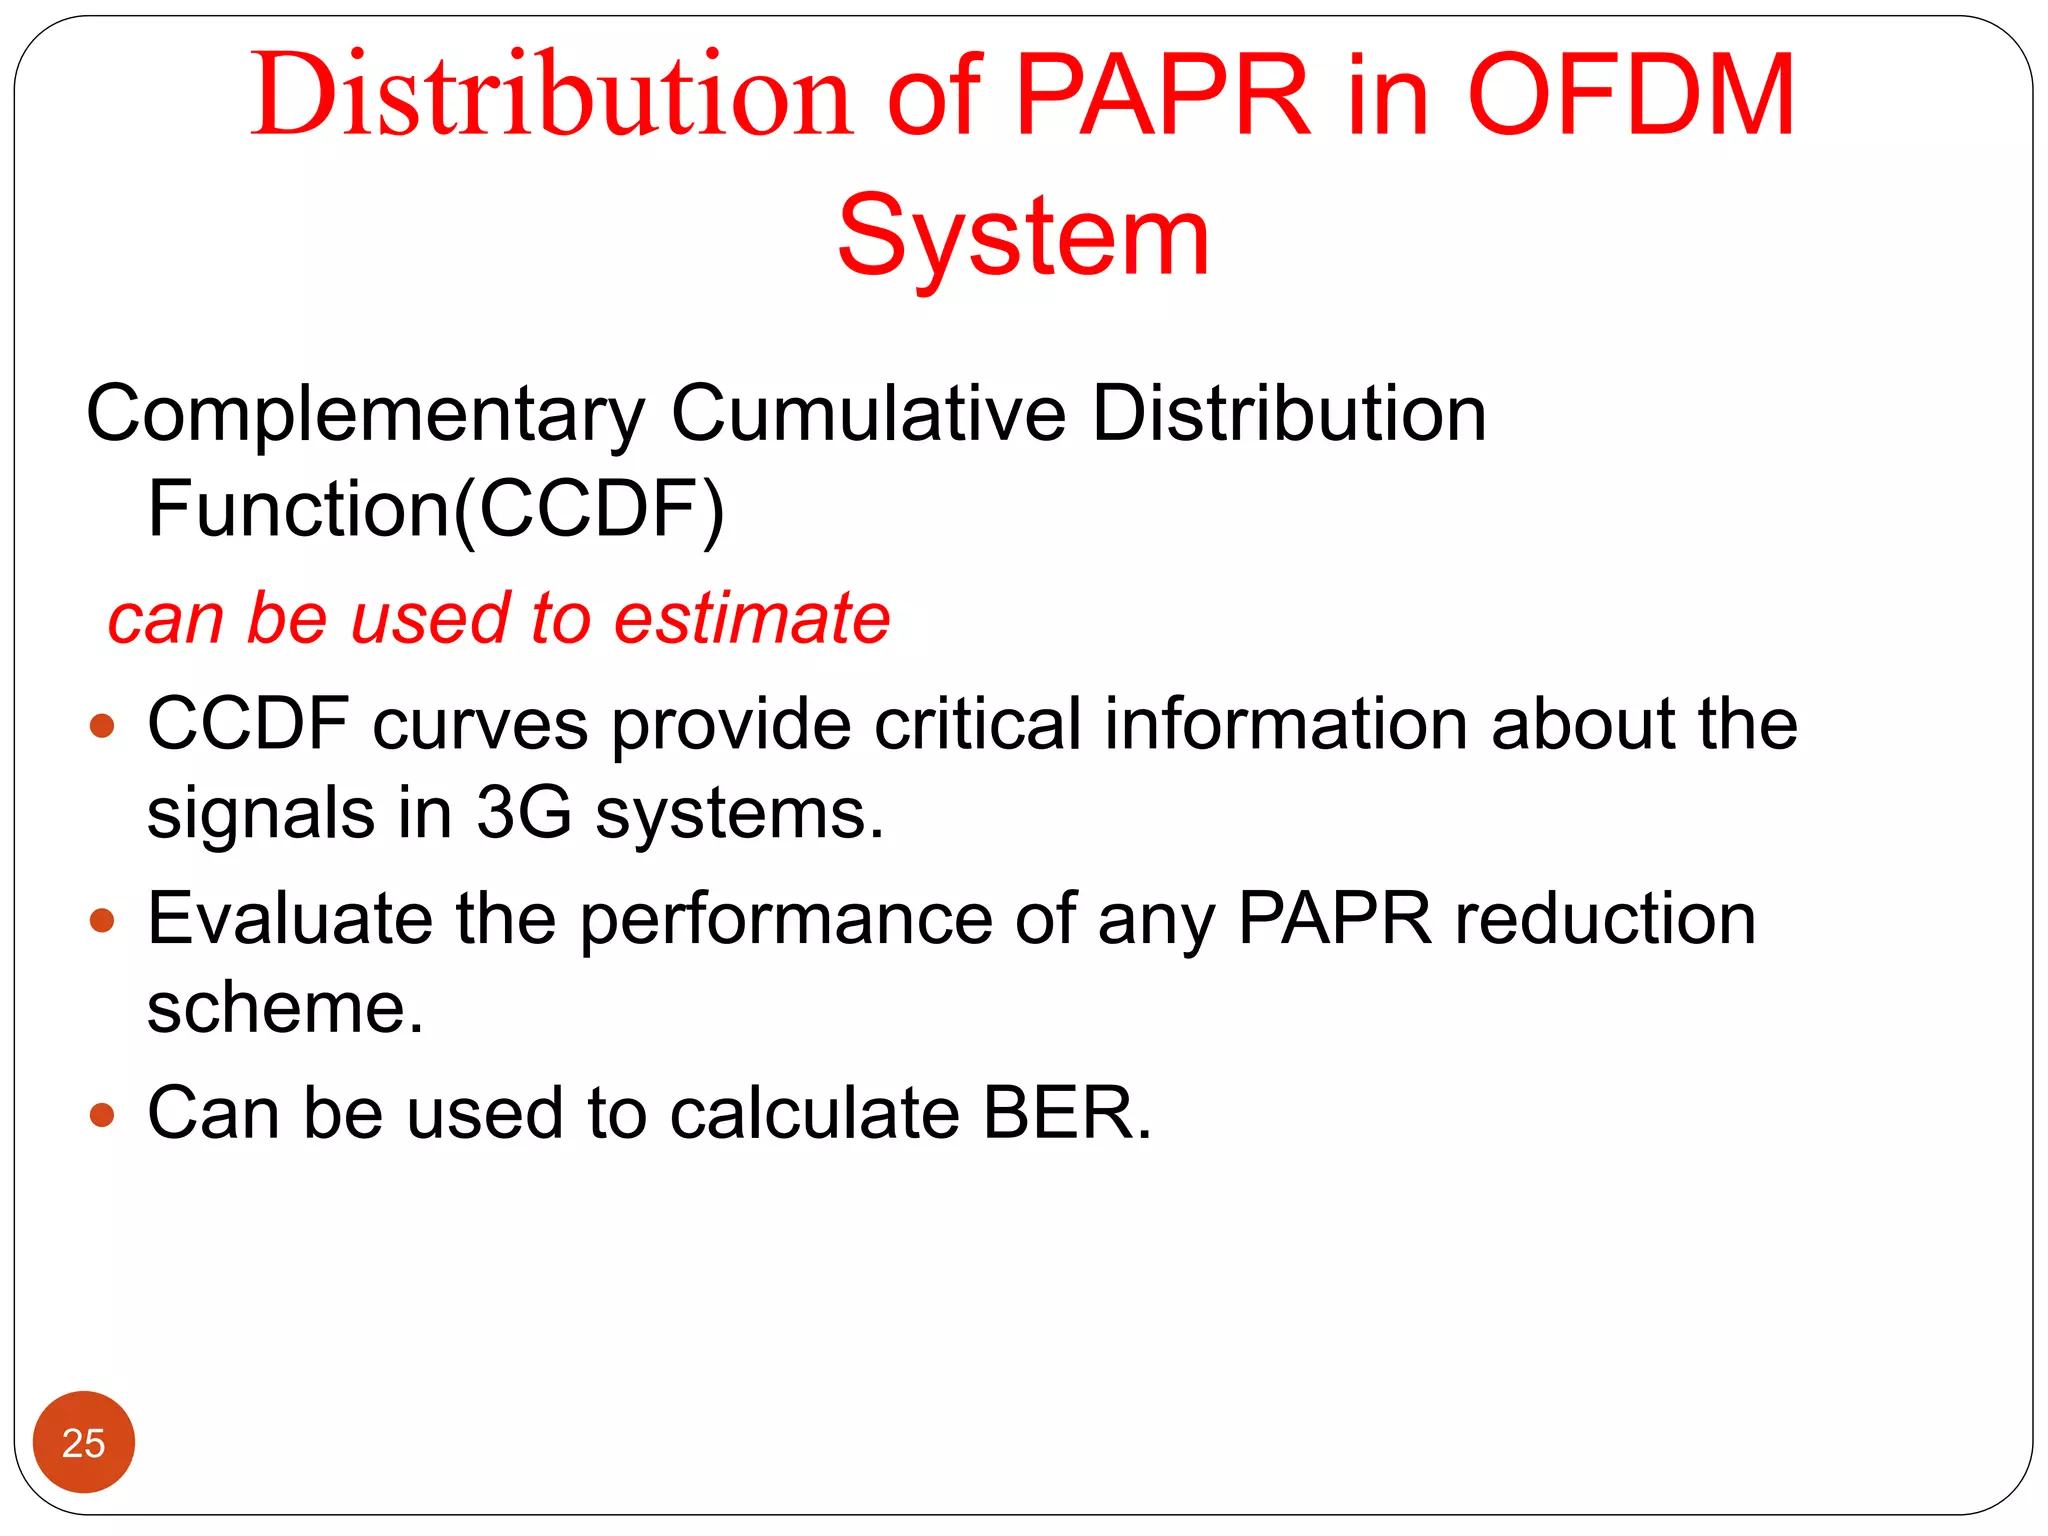
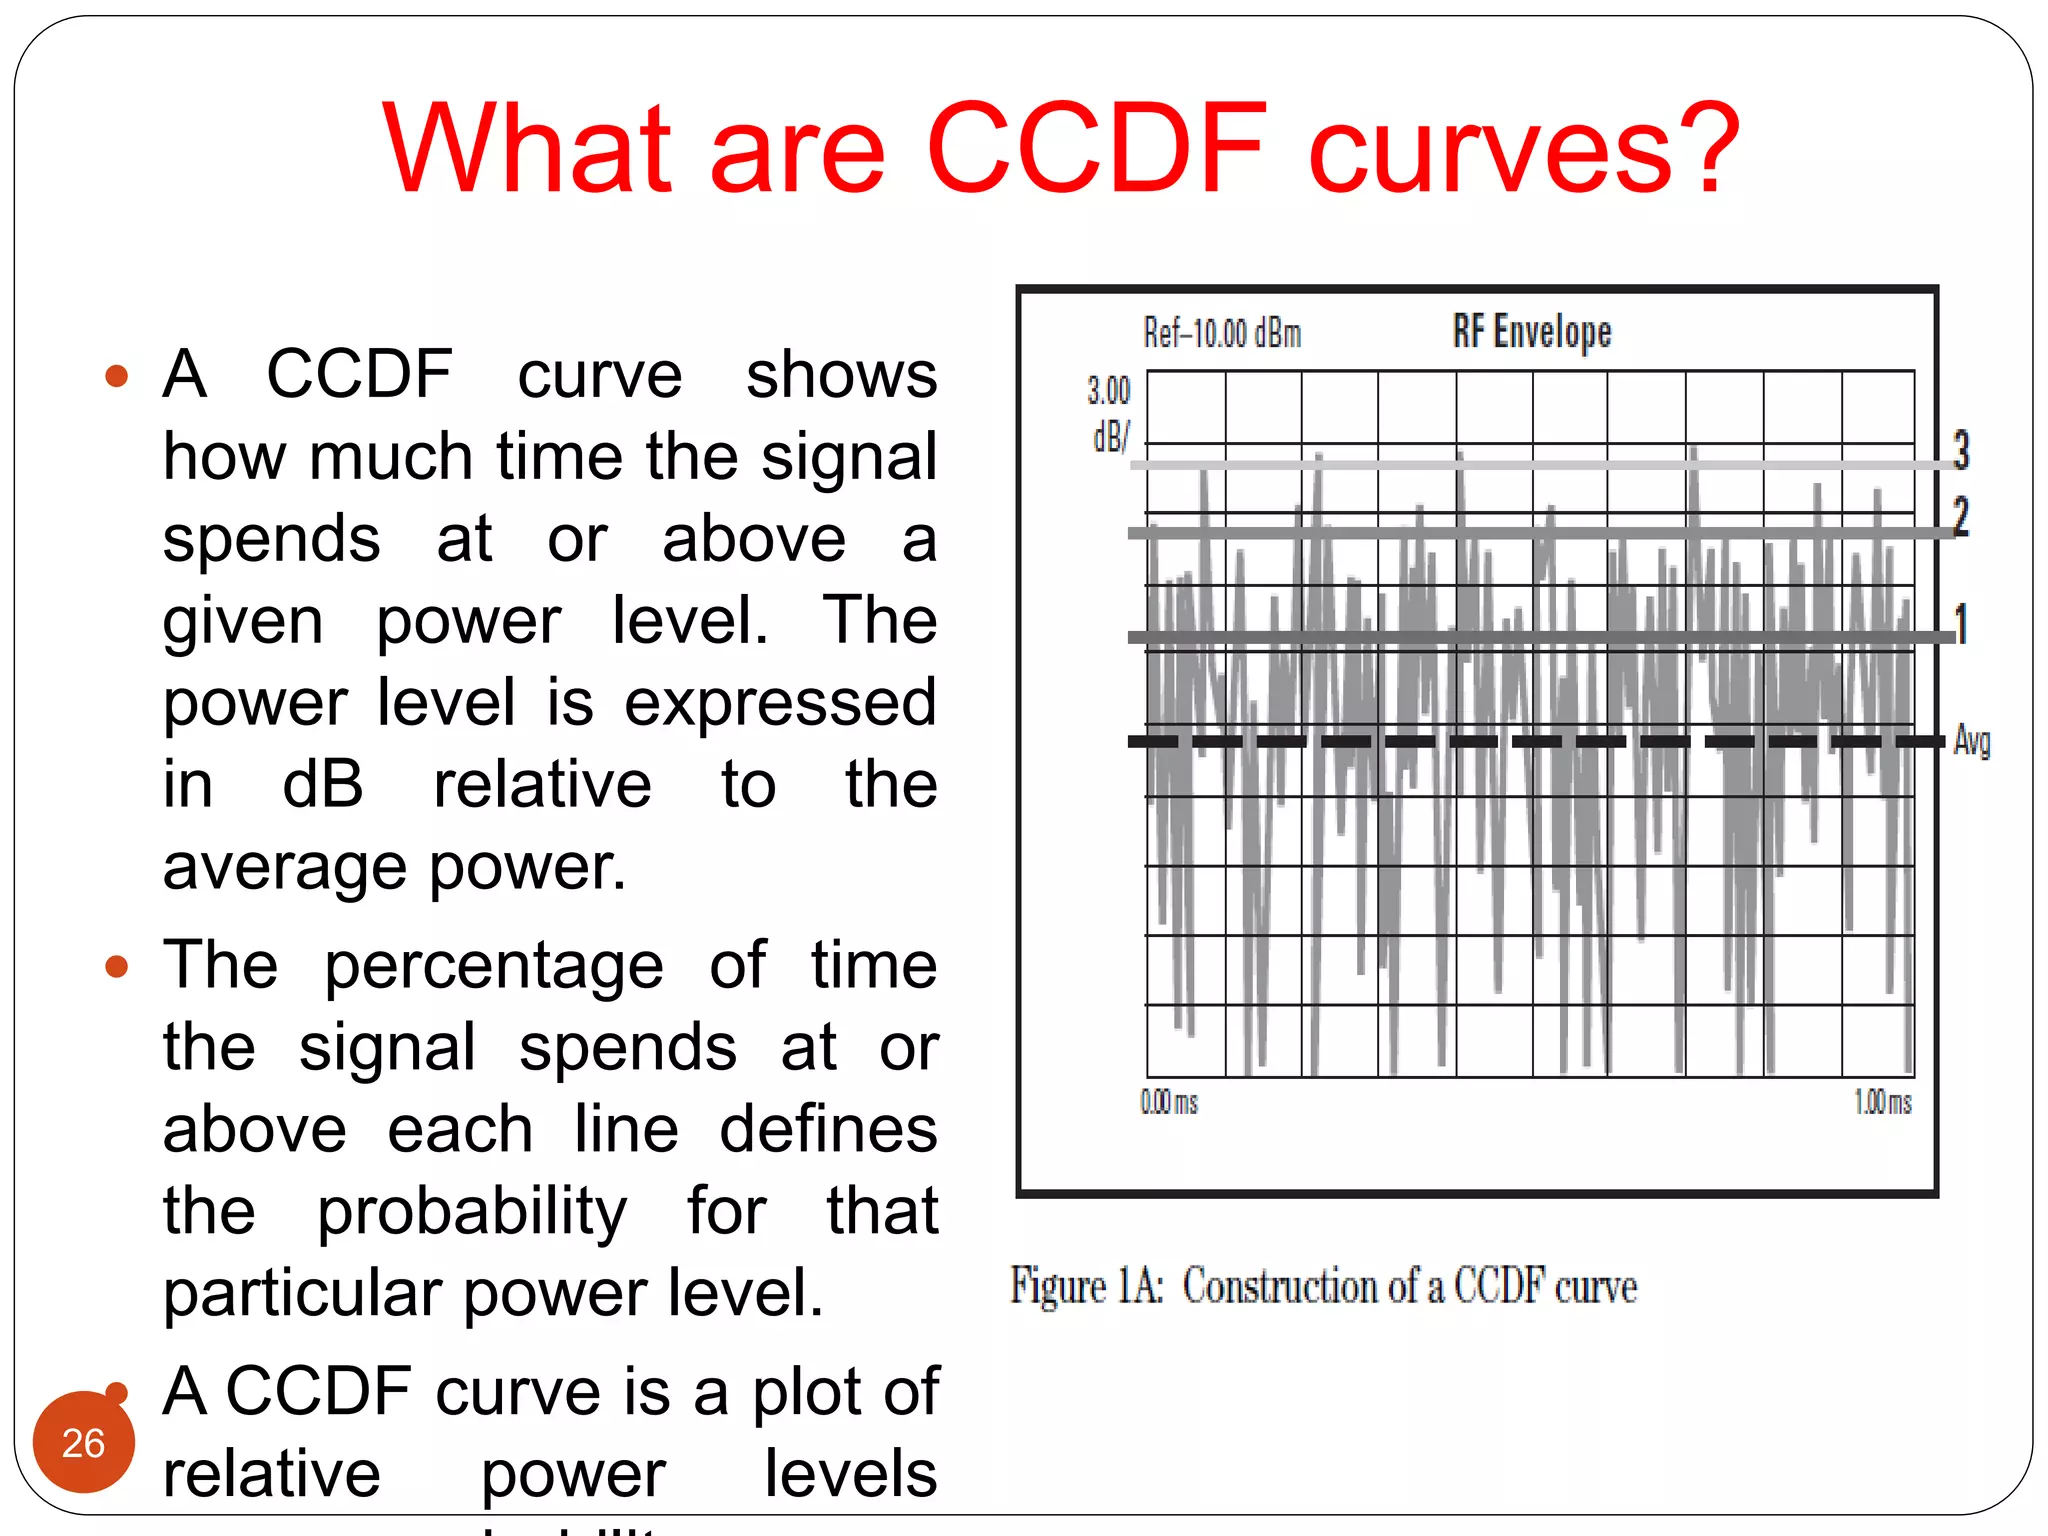
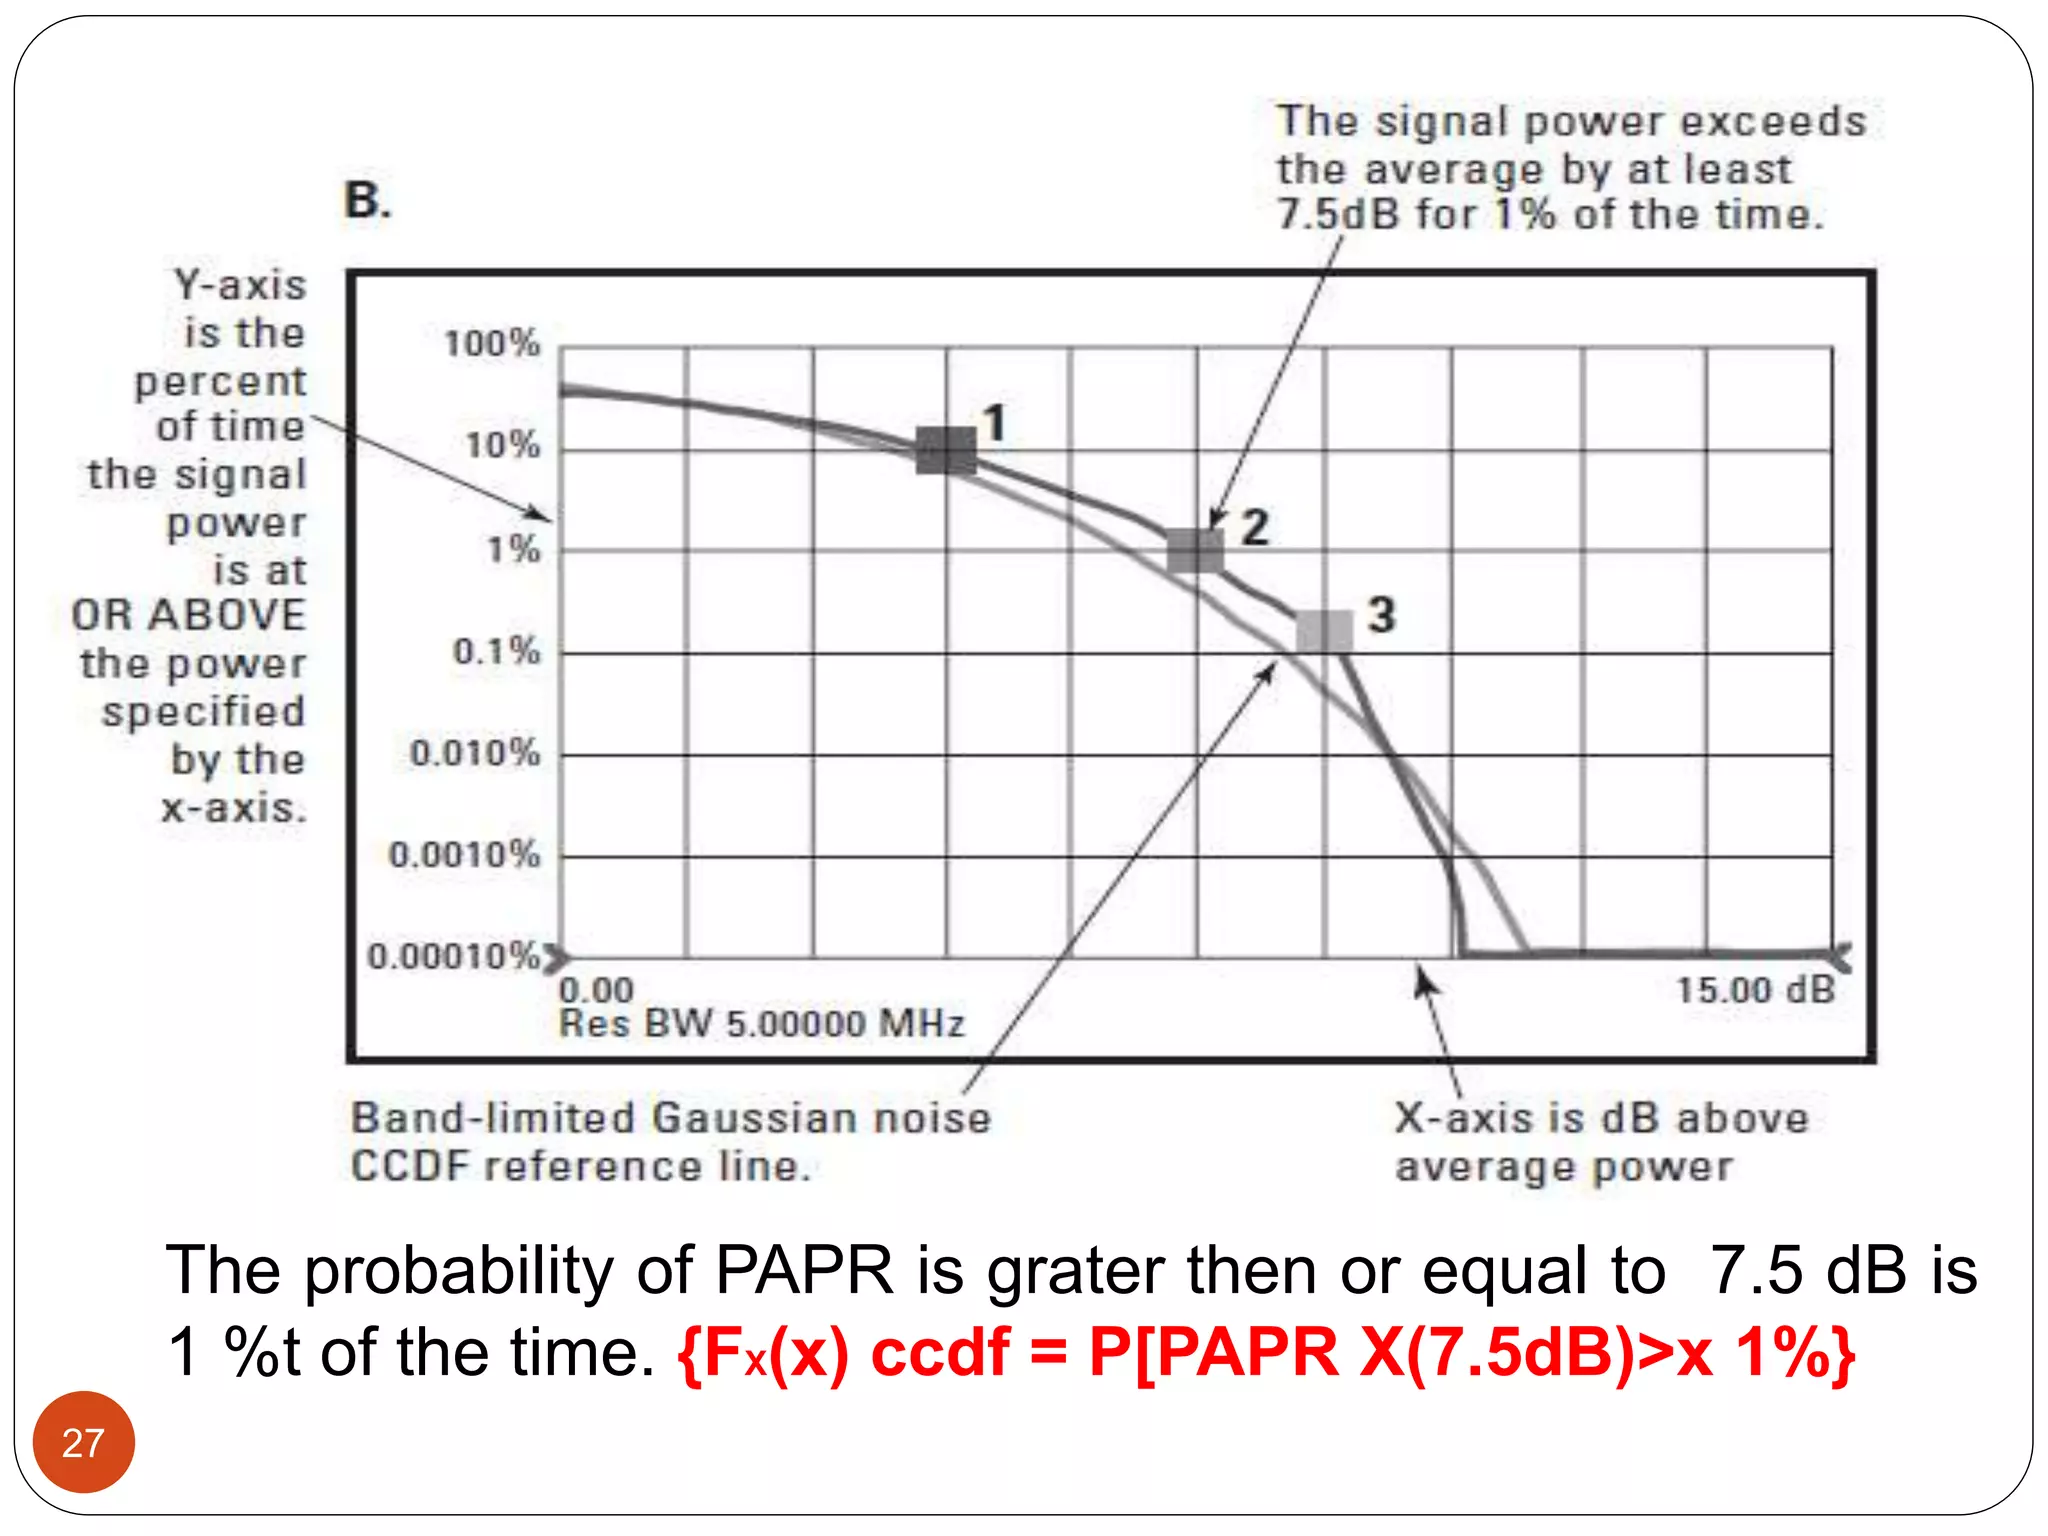
The document discusses the design and analysis of an OFDM (Orthogonal Frequency Division Multiplexing) system, focusing on the challenges of high Peak-to-Average Power Ratio (PAPR) and strategies for its reduction. It provides a comprehensive overview of OFDM, its advantages, various PAPR reduction techniques, and simulation results comparing the performance of these techniques. The conclusion highlights that while clipping is simple, techniques like Selective Mapping (SLM) and Partial Transmit Sequence (PTS) offer better performance, with PTS being computationally more efficient.


![Vibe Coding vs. Spec-Driven Development [Free Meetup]](https://cdn.slidesharecdn.com/ss_thumbnails/vibecodingvsspecdrivendevelopment-251209105622-43f455e7-thumbnail.jpg?width=640&height=640&fit=bounds)