Downloaded 751 times

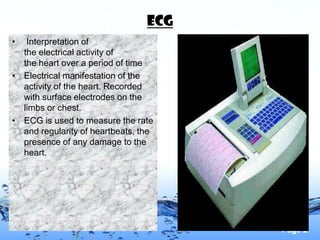
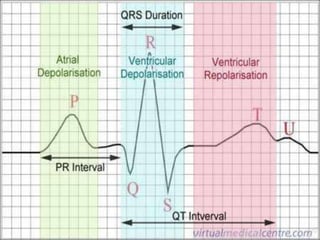
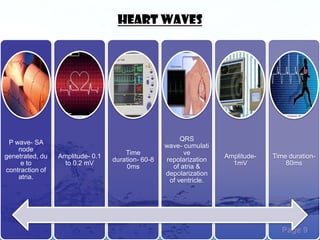
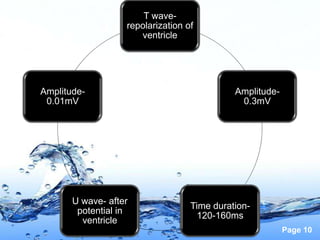
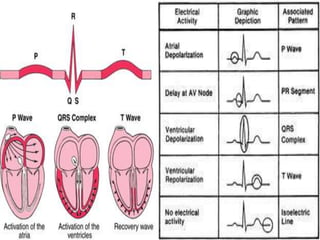
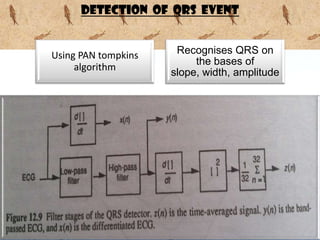
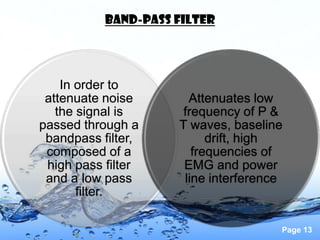
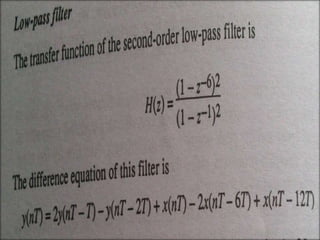
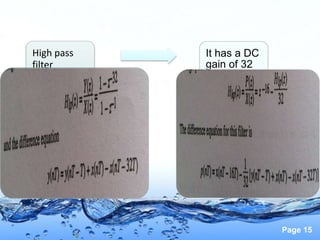
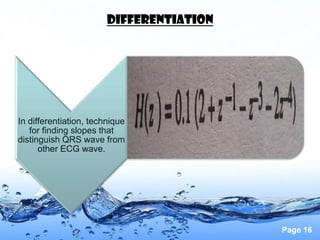
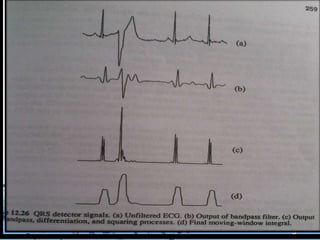
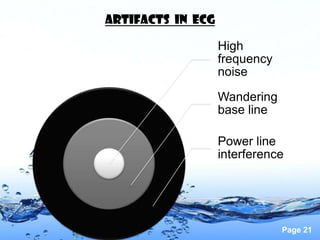
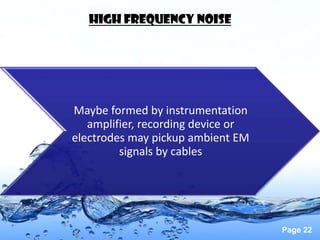
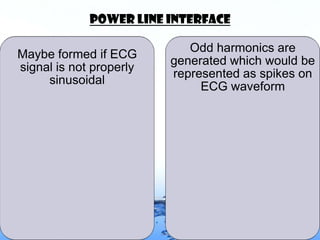
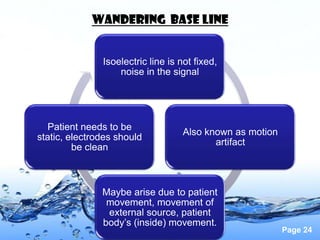
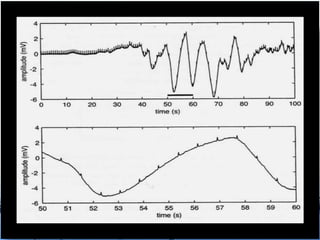


This document discusses the electrocardiogram (ECG) and the electrical activity of the heart. It provides information on how ECG is used to measure heart rate and detect any heart damage. The basics of heart anatomy and function are described, including the four chambers and pacemaking nodes. The key waves of the ECG are defined, such as the P, QRS, and T waves. Methods for detecting QRS complexes are outlined, including filtering, differentiation, and thresholding. Potential artifacts in ECG signals are also reviewed, such as noise, baseline wandering, and powerline interference.