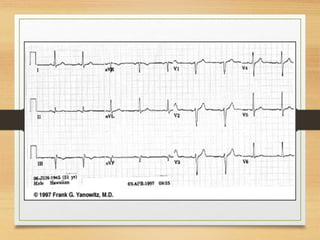
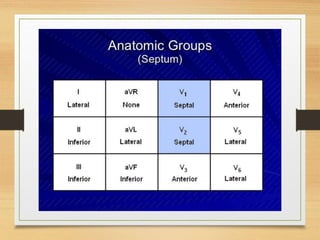
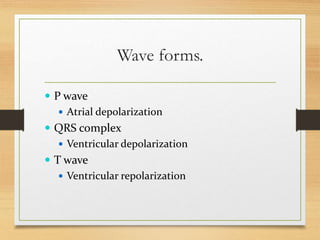
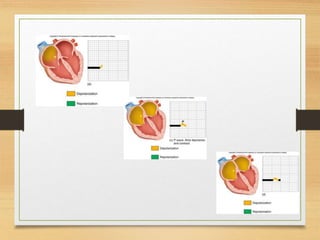
The document discusses electrical activity of the heart as recorded by an electrocardiogram (ECG). It defines key ECG terminology like waves, intervals, complexes and explains what each part of the ECG represents in terms of electrical activity in the heart. Specific waves like P, QRS, T are described in detail along with common abnormalities. Other concepts covered include heart rate calculation methods, cardiac rhythms and axis determination. The document provides a comprehensive overview of interpreting and understanding ECG readings.
crème de la crème basics to understand electrocardiographic analysis in an easy & simple way with some specifications to its use in Emergency medicine/clinical toxicology practice.
This presentation is very useful for undergraduate medical students, premedical students to know about the basics of ECG in a very less time.This presentation teaches us how to proceed systematically to interprate an electrocardiographic tracing.
This presentation covers few basic things about ECG, especially for UG Medical students like ECG leads, normal ECG waves, axis of ECG and how to look for common ECG misplacements.
Wolff–Parkinson–White syndrome (WPW) is one of several disorders of the conduction system of the heart that are commonly referred to as pre-excitation syndromes. WPW is caused by the presence of an abnormal accessory electrical conduction pathway between the atria and the ventricles. Electrical signals traveling down this abnormal pathway (known as the bundle of Kent) may stimulate the ventricles to contract prematurely, resulting in a unique type of supra-ventricular tachycardia referred to as an atrio-ventricular reciprocating tachycardia.
Olga Senyukova - Machine Learning Applications in MedicineOlsen222
How can beautiful algorithmic findings be helpful in our everyday life? One of the answers to this question lies in the area of healthcare applications. Nowadays machine learning methods are becoming more and more useful in medicine. They are able not only to assist medical specialists in processing large amounts of data, but also to help in diagnostics and patient follow-up.
This course is devoted to the discussion of some interesting applications of machine learning methods to automatically analyse medical images and physiologic signals. Medical images acquired by means of special equipment represent internal structures of the human body and/or processes in it. The most modern technologies for acquisition of such images are magnetic resonance imaging (MRI) and computed tomography (CT). Physiologic signals usually refer to cardiologic time series such as electrocardiograms (ECG), but can also represent other physiological data, for example, stride intervals of human gait.
Several important problems will be highlighted along with successful solutions involving machine learning methods including examples both from the worldwide practice and the author’s own research. Description of the basic principles of the algorithms used will provide a good opprotunity to strengthen the knowledge acquired from the other courses of the school.
Emergency is the gateway to the hospital, patients with pain and agony, relative emotionally charged enter the emergency department at any hour of the day or night, expecting immediate treatment and solace.
An electrocardiogram(ECG) is a simple test that can be used to check your heart's rhythm and electrical activity. Sensors attached to the skin are used to detect the electrical signals produced by your heart each time it beats.
Electrocardiography: is the recording of the electrical impulses that are generated in the heart. These impulses initiate the contraction of cardiac muscles.
Normal Labour/ Stages of Labour/ Mechanism of LabourWasim Ak
Normal labor is also termed spontaneous labor, defined as the natural physiological process through which the fetus, placenta, and membranes are expelled from the uterus through the birth canal at term (37 to 42 weeks
Macroeconomics- Movie Location
This will be used as part of your Personal Professional Portfolio once graded.
Objective:
Prepare a presentation or a paper using research, basic comparative analysis, data organization and application of economic information. You will make an informed assessment of an economic climate outside of the United States to accomplish an entertainment industry objective.
How to Build a Module in Odoo 17 Using the Scaffold MethodCeline George
Odoo provides an option for creating a module by using a single line command. By using this command the user can make a whole structure of a module. It is very easy for a beginner to make a module. There is no need to make each file manually. This slide will show how to create a module using the scaffold method.
This slide is special for master students (MIBS & MIFB) in UUM. Also useful for readers who are interested in the topic of contemporary Islamic banking.
Delivering Micro-Credentials in Technical and Vocational Education and TrainingAG2 Design
Explore how micro-credentials are transforming Technical and Vocational Education and Training (TVET) with this comprehensive slide deck. Discover what micro-credentials are, their importance in TVET, the advantages they offer, and the insights from industry experts. Additionally, learn about the top software applications available for creating and managing micro-credentials. This presentation also includes valuable resources and a discussion on the future of these specialised certifications.
For more detailed information on delivering micro-credentials in TVET, visit this https://tvettrainer.com/delivering-micro-credentials-in-tvet/
Introduction to AI for Nonprofits with Tapp NetworkTechSoup
Dive into the world of AI! Experts Jon Hill and Tareq Monaur will guide you through AI's role in enhancing nonprofit websites and basic marketing strategies, making it easy to understand and apply.
The simplified electron and muon model, Oscillating Spacetime: The Foundation...RitikBhardwaj56
Discover the Simplified Electron and Muon Model: A New Wave-Based Approach to Understanding Particles delves into a groundbreaking theory that presents electrons and muons as rotating soliton waves within oscillating spacetime. Geared towards students, researchers, and science buffs, this book breaks down complex ideas into simple explanations. It covers topics such as electron waves, temporal dynamics, and the implications of this model on particle physics. With clear illustrations and easy-to-follow explanations, readers will gain a new outlook on the universe's fundamental nature.
Strategies for Effective Upskilling is a presentation by Chinwendu Peace in a Your Skill Boost Masterclass organisation by the Excellence Foundation for South Sudan on 08th and 09th June 2024 from 1 PM to 3 PM on each day.
2. ECG(electrocardiograph)
• ECG is define as ‘’ recording of electrical activity of
heart on a graph paper.’’
Or
• Graphical representation of electrical activity of
heart.
3. Electrocardiograph.
• The machine which is used to record the electrical
activity of heart is ELECTROCARDIOGRAPH.
• a) ECG machine.
• b) power lab.
6. Significance of ECG.
• ECG gives information about rate and rhythm of
the heart.
• The physical orientation of heart i.e axis.
• Its a diagnostic tool for various heart conditions like
hypertrophies , ischemia, infarction , arrhythmias
conduction problems and pace maker activity.
• ECG does not provide information about
mechanical activity.
7. ECG paper.
• This is long role of paper ,composed of small
squares .
• One square is 1mm wide and 1 mm high.
• On ECG paper there are thick lines, between two
thick lines there are 5 small squares.
• The speed of ECG machine is 25 mm per second.
11. ECG Paper.
• The time internal of each small square can be
calculated as
• 25 small sqrs are equal to 1 second.
• 1 small sqr is equal to 1/25 second.
• i.e 0.04 seconds.
12. ECG paper
• vertically the small square represent the amount of
electrical potential.
• One small sqr represent the potential of 0.1 mv.
• 10 small squares represent the potential of 1 mv.
13.
14. ECG leads.
• leads are electrodes which record the
electrical potential of heart at different sites.
• There are 12 ECG leads.
a) 3 bipolar limb leads.
b) 3 augmented limb leads.(unipolar).
c) 6 chest leads.
15.
16. Bipolar limb leads.
• Lead 1 = left arm + ve , right arm _
ve
• Lead 2 = right arm _ ve ,left leg + ve..
• Lead 3 = left arm _ ve , left leg +ve.
17.
18.
19. Augmented limb leads.
• AVR attach to right arm..
• AVL attach to left arm.
• AVF attach to left foot.
20.
21.
22.
23.
24. Einthoven”s triangle
• Einthoven s triangle is a diagrammatic
way of illustrating that the two arms
and left leg form the apices of triangle
surrounding the heart.
• It is an equilateral triangle.
25. Einthoven “s rule.
• Einthovens law states that if the
electrical potentials of two leads are
known at any instant ,the third can be
determine by simply summing the first
two.
34. Basic terminologies
Base line : flat, straight and isoelectric line
Wave form :deviation or movement away
from base line may be upward or downward
Segment : A line between two waves
Interval : a wave form plus a segment this
shows time duration
Complex : combination of several wave form
without segment.
35.
36.
37.
38.
39.
40.
41. P wave
• P Wave shows atrial depolarization..
• Its duration is 0.1 sec (2 and half small sqr) and
height is 2.5 mv (2 and half small sqr).
• Presence of p waves in ECG strip shows the sinus
rhythm.
42. Abnormalities of P wave.
P .pulmonale :- This is tall and peaked P wave in
lead 1 and lead 2 and 3 in right atrial hypertrophy.
(pulmonary hypertension).
P. mitrale ;_ It is biphasic or broad P wave seen in
left atrial hypertrophy.(mitral stenosis).
-. Best seen in lead 2.
43.
44. P wave.
• Inverted P wave :- may be present in .
• a) Normally in lead V 1 and V2..
• b) In dextro cardia.
• c) Incorrectly placed electrodes.
45.
46. QRS complex.
• QRS complex represent the ventricular
depolarization.
• its normal duration is about 0. 08 seconds.( less than
2 small sqr) and hight is about 5 to 20 small sqrs.
• It is a wide complex because it mask the atrial
repolarization.
• Q wave is first wave of this complex but often
absent.
47. QRS complex.
• Q wave present the interventricular septal
depolarization.
• It is first wave in ECG with negative deflection.
• Q wave greater than 1/3 the height of the R wave,
greater than 0.04 sec are abnormal and may represent
the old infarction.
.
48.
49.
50. Low voltage QRS complex.
• when the height of R or S wave is not more than
5mm… it is seen in..
Hypothyroidism.
Pericardial effusion.
Thick chest wall.
Problem in ECG machine.
51. High voltage QRS complex.
• This is present in ventricular hypertrophies.
• The maximum voltage of QRS complex may be 35
mv(35 small square).
• V1 and V2 show high voltage QRS complex in right
ventricular hypertrophy.( s wave)
• V5 and V6 show such QRS complex in left
ventricular hypertrophy. (r wave)
52.
53. T Wave.
• it represent the ventricular repolarization.
• It is repolarizing wave but shows the upward
deflection because the part depolarized in the last is
first to be repolarized,, that is base of heart
depolarized in the last but is first to be repolarized.
54. T wave.
•
• T wave should not be more than one third of R
wave.
• T wave inversion represent ischemia of heart.
• Tall and peaked R wave is present in hyperkalemia.
• Flattened R waves in pericarditis and myocarditis.
55. PR interval.
• This is from beginning of P wave to the beginning
of Q wave.
• Its normal duration is from 0.12 to 0.2 sec..
• It represent the conduction time of impulse from SA
node to the ventricles and AV delay.
56. Prolong PR interval.
• Prolong PR interval shows delayed conduction from
SA to AV node….
In first degree heart , 2nd degree and complete heart
block.
Digitalis therapy.
Hyperkalemia.
57. First degree heart block.
• A-V BLOCK, FIRST DEGREE
Atrio-ventricular conduction lengthened
• Interval is about 0.2 to 0.3 sec.
58. Second degree heart block.
• A-V BLOCK, SECOND DEGREE
Sudden dropped QRS-complex
• PR interval is about 0.4 sec.
•
60. 3rd degree heart block.
• When there is AV block , atria continue to beat at
normal rhythem while new pace maker develops in
purkinjie system with a rate of 15 to 50 beats /min.
• With a sudden block purkinje system cannot take
over pace maker activity immediately ,it takes about
16 to 30 sec. during which ventricles fail to contract
and person faint.
• This delayed pickup of heart beat is called stokes
Adams syndrome.
61. QT interval
• Measured from beginning of Q to the
end of the T wave
. Its duration is about (10 small sqrs).
. it indicates total systolic time of ventricles.
63. ST segment.
• this segment present between S wave and T
wave.
• It represent the plateau phase.
• its duration is 0.04 sec .
64. J point.
• The exact point at which all parts of ventricles are
depolarized i.e at the just end of QRS comples and
just at the begining of ST segment.
• At the point potential of ECG is zero with no
current is flowing through heart.
65.
66. ST segment
• Elevation . Seen in recent MI and
hyperkalemia.
• Depression. Seen in ischemia, digitalis
therapy and hypokalemia.
70. Electrophysiology
If an electrode is placed so that wave of
depolarization spreads toward the recording
electrode, the ECG records a positive
(upward) deflection.
If wave of depolarization spreads away from
recording electrode, a negative (downward)
deflection
80. 1. ECG recording of electrical activity not the
mechanical function
2. ECG is not a direct depiction of abnormalities
3. ECG does not record all the heart’s electrical
activity
83. How to calculate heart rate.
heart rate define as the no of heart beats per
minute.it can be determine by ECG VIA TWO
RULES.
Rule of 300
10 Second Rule
84. Rule of 300
Take the number of “big boxes” between
neighboring QRS complexes, and divide this
into 300. The result will be approximately
equal to the rate.
Although fast, this method only works for
regular rhythms.
91. Rule of 10 sec
As most EKGs record 10 seconds of rhythm per
page, one can simply count the number of
beats present on the EKG and multiply by 6 to
get the number of beats per 60 seconds.
This method works well for irregular rhythms
92.
93. Rhythm.
• This is checked by the intervals between two R
waves or two S waves.
• If the no of small or large sqs are equal between two
R or S waves,, the rhythm is said to be normal.
• If not the rhythm is said to be irregular.
• Irregular rhythm is called Arrythmias.
95. Sinus arrhythmia
• There is sinus rhythm , but the RR interval
(heart rate) varies with respiration.
• Heart rate increase during inspiration and
decrease during expiration.
97. Atrial flutter.
• When atrial rate is between 200 to 300 betas /min
• During atrial flutter AV node is not able to transmit
all the impulses to ventricles so ventricular rate is 1/3
or ¼ of atrial rate.
• P wave is like saw tooth.
• Present is IHD , rheumatic heart disease.
99. Atrial fibrillation.
• A totally irregular and rapid atrial rate in which there
is a contraction of only small portion of atrial
musculature.
• P waves replace by irregular F waves , bcoz whole
atria is not contracting.
• QRS complex and T waves r normal but rhythm is
irregular.
102. Ventricular fibrillation.
• Rapid ,irregular and ineffective contractions
of small segments of ventricles is termed as
ventricular fibrillation.
• Peripheral pulse is absent bcoz cardiac out
put is zero.
105. Cardiac axis
• The flow of current from one point to another is
representing by an arrow. This is called Vector.
• The direction of flow of current i.e the arrow
point is always towards the positive direction.
The range of cardiac axis is 0 to +90 degrees.
Beyond this limit it is said to be deviated.
108. QRS axis.
By near-consensus, the normal QRS axis is defined as
ranging from -30° to +90°.
-30° to -90° is referred to as a left axis deviation (LAD)
+90° to +180° is referred to as a right axis deviation
(RAD)
109.
110. Axis deviation
• Deviation to R: increased activity in R vent. –
obstruction in lung, pulmonary emboli, some heart
disease
• Deviation to L: increased activity in L vent. –
hypertension, aortic stenosis, ischemic heart disease