Defination
• Electrocardiography isthe graphic display of
the hearts integrated current, as voltage
changes over time
• Or the process of producing a graphic record
of the electrical activity of the heart, voltage
versus time, using electrodes placed on the
skin.
3.
Introduction
• Membrane potential(also transmembrane
potential or membrane voltage) is the
difference in electric potential between the
interior and the exterior of a cell. With respect
to the exterior of the cell, typical values of
membrane potential ranges from –40 mV to
–80 mV.
4.
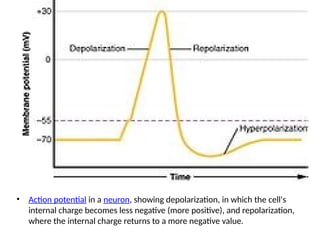
• Action potentialin a neuron, showing depolarization, in which the cell's
internal charge becomes less negative (more positive), and repolarization,
where the internal charge returns to a more negative value.
5.
Introduction
• Action potentialoccurs when the membrane
potential of a specific cell location rapidly rises
and falls: this depolarisation then causes
adjacent locations to similarly depolarise.
Action potentials occur in several types of
animal cells, called excitable cells, which
include neurons, muscle cells,
6.
Introduction
• Depolarization isa change within a cell, during
which the cell undergoes a shift in electric
charge distribution, resulting in less negative
charge inside the cell.
• Electrical depolarisation of myocardial tissue
produces a small current which can be
detected by electrode pairs on the body
surface
7.
Uses of Electrocardiogram
•The ECG is used to assess the electrical and muscular functions of
the heart.
• Rhythm disturbances (such as atrial fibrillation and ventricular
tachycardia)
• Information about and conduction, chamber size and pericarditis.
• Suspected myocardial infarction (heart attack),
• Symptoms such as palpitations or monitoring of known cardiac
arrhythmias
• Medication monitoring (e.g., drug-induced QT prolongation, Digoxin
toxicity) and management of overdose (e.g., tricyclic overdose)
• Electrolyte abnormalities, such as hyperkalemia
8.
Other indications forECG
• Perioperative monitoring whenany form of anesthesia is
involved.
• Cardiac stress testing
• Computed tomography angiography (CTA) and magnetic
resonance angiography (MRA) of the heart (ECG is used to
"gate" the scanning so that the anatomical position of the
heart is steady)
• Clinical cardiac electrophysiology, in which a catheter is
inserted through the femoral vein and can have several
electrodes along its length to record the direction of
electrical activity from within the heart.
9.
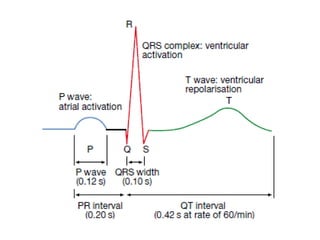
The Electrocardiogram
• Duringsinus rhythm, the SA node triggers atrial
depolarisation, producing a P wave.
• Depolarisation proceeds slowly through the AV
node, which is too small to produce a depolarisation
wave detectable from the body surface.
• The bundle of His, bundle branches and Purkinje
system are then activated, initiating ventricular
myocardial depolarisation, which produces the QRS
complex.
10.
The Electrocardiogram
• Themuscle mass of the ventricles is much
larger than that of the atria, so the QRS
complex is larger than the P wave.
• The interval between the onset of the P wave
and the onset of the QRS complex is termed
the ‘PR interval’ and largely reflects the
duration of AV nodal conduction
11.
The Electrocardiogram (contd)
•Repolarisation is a slower process that spreads
from the epicardium to the endocardium.
Atrial repolarisation does not cause a
detectable signal but ventricular repolarisation
produces the T wave.
• The QT interval represents the total duration
of ventricular depolarisation and
repolarisation.
14.
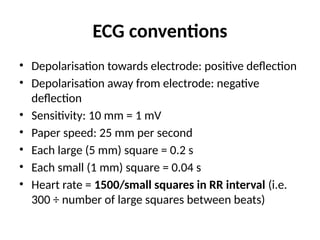
ECG conventions
• Depolarisationtowards electrode: positive deflection
• Depolarisation away from electrode: negative
deflection
• Sensitivity: 10 mm = 1 mV
• Paper speed: 25 mm per second
• Each large (5 mm) square = 0.2 s
• Each small (1 mm) square = 0.04 s
• Heart rate = 1500/small squares in RR interval (i.e.
300 ÷ number of large squares between beats)
15.
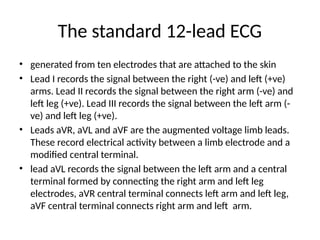
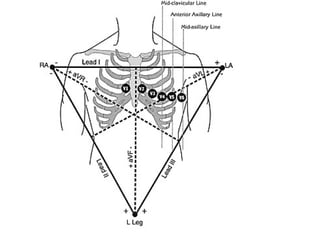
The standard 12-leadECG
• generated from ten electrodes that are attached to the skin
• Lead I records the signal between the right (-ve) and left (+ve)
arms. Lead II records the signal between the right arm (-ve) and
left leg (+ve). Lead III records the signal between the left arm (-
ve) and left leg (+ve).
• Leads aVR, aVL and aVF are the augmented voltage limb leads.
These record electrical activity between a limb electrode and a
modified central terminal.
• lead aVL records the signal between the left arm and a central
terminal formed by connecting the right arm and left leg
electrodes, aVR central terminal connects left arm and left leg,
aVF central terminal connects right arm and left arm.
16.
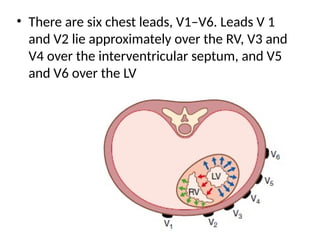
• There aresix chest leads, V1–V6. Leads V 1
and V2 lie approximately over the RV, V3 and
V4 over the interventricular septum, and V5
and V6 over the LV
17.
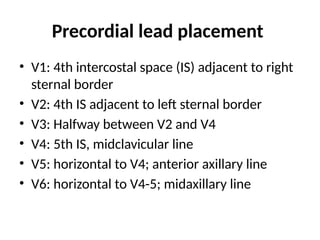
Precordial lead placement
•V1: 4th intercostal space (IS) adjacent to right
sternal border
• V2: 4th IS adjacent to left sternal border
• V3: Halfway between V2 and V4
• V4: 5th IS, midclavicular line
• V5: horizontal to V4; anterior axillary line
• V6: horizontal to V4-5; midaxillary line
19.
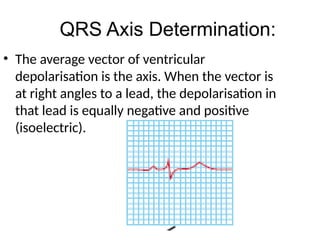
• The averagevector of ventricular
depolarisation is the axis. When the vector is
at right angles to a lead, the depolarisation in
that lead is equally negative and positive
(isoelectric).
QRS Axis Determination:
20.
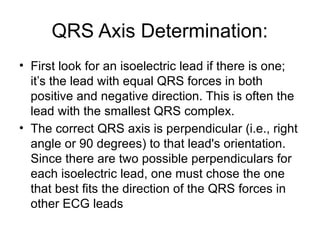
QRS Axis Determination:
•First look for an isoelectric lead if there is one;
it’s the lead with equal QRS forces in both
positive and negative direction. This is often the
lead with the smallest QRS complex.
• The correct QRS axis is perpendicular (i.e., right
angle or 90 degrees) to that lead's orientation.
Since there are two possible perpendiculars for
each isoelectric lead, one must chose the one
that best fits the direction of the QRS forces in
other ECG leads
21.
Axis Determination
• Ifthere is no isoelectric lead, there are usually
two leads that are nearly isoelectric, and these
are usually always 30° apart.
• Find the perpendiculars for each lead and
chose an approximate QRS axis within the 30°
range.
22.
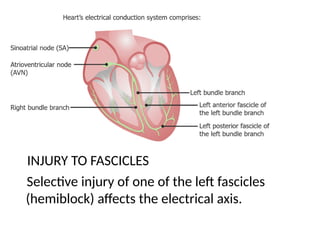
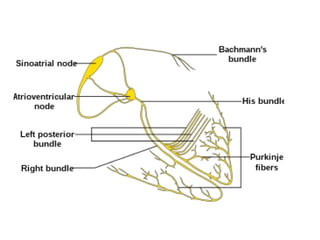
Conducting pathways
INJURY TOFASCICLES
Selective injury of one of the left fascicles
(hemiblock) affects the electrical axis.
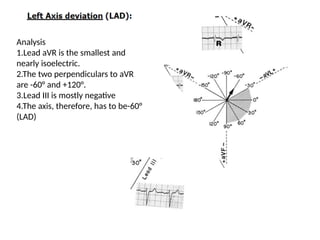
23.
Analysis
1.Lead aVR isthe smallest and
nearly isoelectric.
2.The two perpendiculars to aVR
are -60° and +120°.
3.Lead III is mostly negative
4.The axis, therefore, has to be-60°
(LAD)
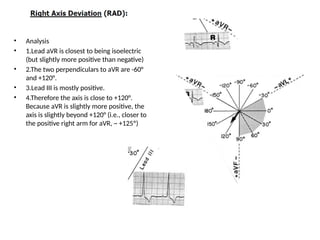
24.
• Analysis
• 1.LeadaVR is closest to being isoelectric
(but slightly more positive than negative)
• 2.The two perpendiculars to aVR are -60°
and +120°.
• 3.Lead III is mostly positive.
• 4.Therefore the axis is close to +120°.
Because aVR is slightly more positive, the
axis is slightly beyond +120° (i.e., closer to
the positive right arm for aVR, ~ +125º)
26.
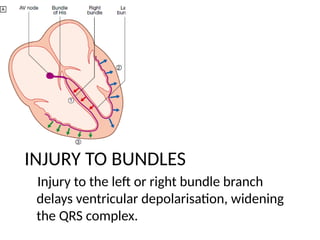
INJURY TO BUNDLES
Injuryto the left or right bundle branch
delays ventricular depolarisation, widening
the QRS complex.
27.
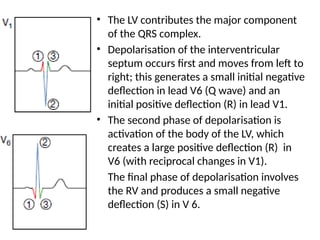
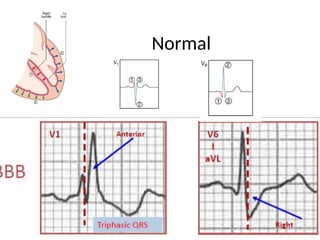
• The LVcontributes the major component
of the QRS complex.
• Depolarisation of the interventricular
septum occurs first and moves from left to
right; this generates a small initial negative
deflection in lead V6 (Q wave) and an
initial positive deflection (R) in lead V1.
• The second phase of depolarisation is
activation of the body of the LV, which
creates a large positive deflection (R) in
V6 (with reciprocal changes in V1).
• The final phase of depolarisation involves
the RV and produces a small negative
deflection (S) in V 6.
28.
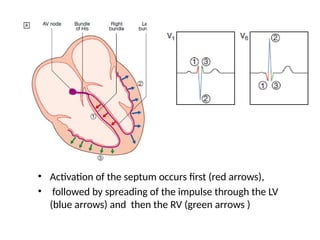
• Activation ofthe septum occurs first (red arrows),
• followed by spreading of the impulse through the LV
(blue arrows) and then the RV (green arrows )
ECG INTERPRETATION
• Itis important to follow a standardized sequence of
steps in order to avoid missing abnormalities in the
ECG tracing. The 6 major sections are:
• 1. Measurements
• 2. Rhythm Analysis
• 3. Conduction Analysis
• 4. Waveform description
• 5. Final Interpretation
• 6. Comparison (if available) to previous ECG
32.
1. MEASUREMENTS
• Heartrate (state both atrial and ventricular
rates, if different)
• PR interval (from beginning of P to beginning
of QRS complex)
• QRS duration (width of most representative
QRS)
• QT interval (from beginning of QRS to end of T)
• QRS axis in frontal plane-limb leads
34.
2. RHYTHM ANALYSIS:
•State the basic rhythm (e.g., "normal sinus
rhythm", "atrial fibrillation", etc.)
• Identify additional rhythm events if present
(e.g., "PVC's", "PAC's", etc.)
• Remember that arrhythmias may originate in
the atria, AV junction, and ventricles
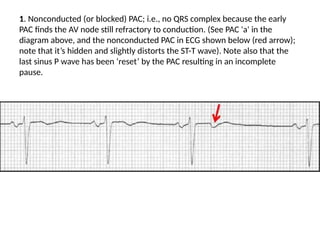
1. Nonconducted (orblocked) PAC; i.e., no QRS complex because the early
PAC finds the AV node still refractory to conduction. (See PAC 'a' in the
diagram above, and the nonconducted PAC in ECG shown below (red arrow);
note that it’s hidden and slightly distorts the ST-T wave). Note also that the
last sinus P wave has been ‘reset’ by the PAC resulting in an incomplete
pause.
38.
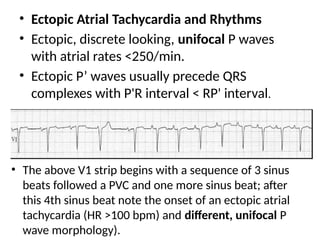
• The aboveV1 strip begins with a sequence of 3 sinus
beats followed a PVC and one more sinus beat; after
this 4th sinus beat note the onset of an ectopic atrial
tachycardia (HR >100 bpm) and different, unifocal P
wave morphology).
• Ectopic Atrial Tachycardia and Rhythms
• Ectopic, discrete looking, unifocal P waves
with atrial rates <250/min.
• Ectopic P’ waves usually precede QRS
complexes with P'R interval < RP' interval.
39.
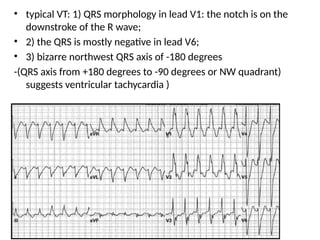
• typical VT:1) QRS morphology in lead V1: the notch is on the
downstroke of the R wave;
• 2) the QRS is mostly negative in lead V6;
• 3) bizarre northwest QRS axis of -180 degrees
-(QRS axis from +180 degrees to -90 degrees or NW quadrant)
suggests ventricular tachycardia )
40.
3. CONDUCTION ANALYSIS:
•"Normal" conduction implies normal sino-
atrial (SA), atrio-ventricular (AV), and
intraventricular (IV) conduction.
Common Conduction abnormalities may include
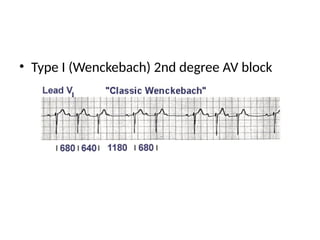
• 1st, 2nd (type I or type II), and 3rd degree AV
block
• IV blocks: bundle branch, fascicular blocks
41.
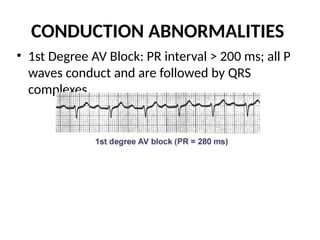
CONDUCTION ABNORMALITIES
• 1stDegree AV Block: PR interval > 200 ms; all P
waves conduct and are followed by QRS
complexes.
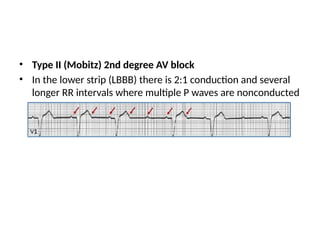
• Type II(Mobitz) 2nd degree AV block
• In the lower strip (LBBB) there is 2:1 conduction and several
longer RR intervals where multiple P waves are nonconducted
44.
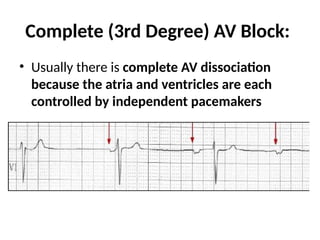
Complete (3rd Degree)AV Block:
• Usually there is complete AV dissociation
because the atria and ventricles are each
controlled by independent pacemakers
45.
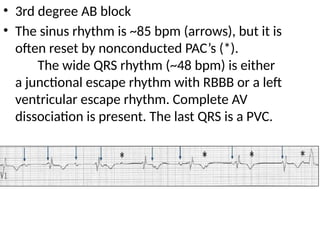
• 3rd degreeAB block
• The sinus rhythm is ~85 bpm (arrows), but it is
often reset by nonconducted PAC’s (*).
The wide QRS rhythm (~48 bpm) is either
a junctional escape rhythm with RBBB or a left
ventricular escape rhythm. Complete AV
dissociation is present. The last QRS is a PVC.
46.
4. WAVEFORM DESCRIPTION:
•Carefully analyze each of the12-leads for abnormalities of the
waveforms in the order in which they appear: P-waves, QRS
complexes, ST segments, T waves, U waves.
• P waves: are they too wide, too tall, look abnormal (i.e., are they
ectopic), etc.?
• QRS complexes: look for pathologic Q waves, abnormal voltage, etc.
• ST segments: look for leads with abnormal ST elevation and/or
depression.
• T waves: look for abnormally inverted T waves or unusually tall T
waves (hyperk).
• U waves: look for prominent (hypok) or inverted U waves (Ischemia
of LAD).
47.
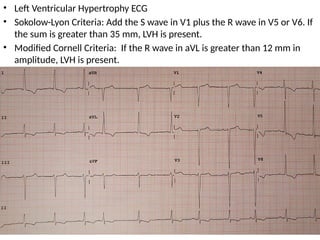
• Left VentricularHypertrophy ECG
• Sokolow-Lyon Criteria: Add the S wave in V1 plus the R wave in V5 or V6. If
the sum is greater than 35 mm, LVH is present.
• Modified Cornell Criteria: If the R wave in aVL is greater than 12 mm in
amplitude, LVH is present.
48.
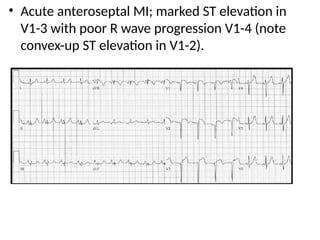
• Acute anteroseptalMI; marked ST elevation in
V1-3 with poor R wave progression V1-4 (note
convex-up ST elevation in V1-2).
49.
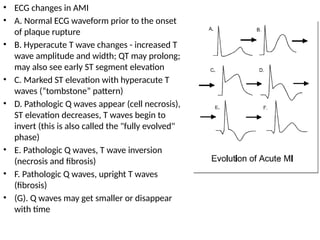
• ECG changesin AMI
• A. Normal ECG waveform prior to the onset
of plaque rupture
• B. Hyperacute T wave changes - increased T
wave amplitude and width; QT may prolong;
may also see early ST segment elevation
• C. Marked ST elevation with hyperacute T
waves (“tombstone” pattern)
• D. Pathologic Q waves appear (cell necrosis),
ST elevation decreases, T waves begin to
invert (this is also called the "fully evolved"
phase)
• E. Pathologic Q waves, T wave inversion
(necrosis and fibrosis)
• F. Pathologic Q waves, upright T waves
(fibrosis)
• (G). Q waves may get smaller or disappear
with time
50.
5. FINAL ECGINTERPRETATION:
• Interpret the ECG as "Normal", or "Abnormal".
Examples of "abnormal" statements are:
• Left ventricular hypertrophy (LVH)
• Right atrial enlargement (RAE)
• Nonspecific ST-T wave abnormalities
• Specific rhythm abnormalities such as atrial fibrillation
• Inferior MI, probably acute
• Old anteroseptal MI
• Left anterior fascicular block (LAFB)
Editor's Notes
#15 An electrode is a small piece of metal or other substance that is used to take an electric current to or from a source of power, a piece of equipment, or a living body.


![CASE_PRESENTATION_ON_subdural_hematoma(SDH)[1 FINAL PPT]-1.pptx](https://cdn.slidesharecdn.com/ss_thumbnails/casepresentationonsubduralhematomasdh1finalppt-1-260129172522-d405d375-thumbnail.jpg?width=640&height=640&fit=bounds)

